Balancing between
exploration and
exploitation in a lean
business environment
31 August 2016 Max Joris van Oort s1120093
1
Management summary
Since a few decades lean management is a popular production technique. The purpose of lean
management is to remove all waste from the production process. Because innovations do not
directly add value to the current products organization focus on exploitation at the cost of
exploration. By being able to simultaneously performing exploration and exploitation an
organization can become ambidextrous. Innovations are vital for organizational survival but
because lean organizations do not put a focus on innovative activities this creates a tension.
Due to the limited size of small and medium-sized enterprises (SMEs) resource constraints
limit the ability to be ambidextrous, moreover do SMEs have a centralized nature which puts
extra pressure on exploration. This research examines the tension created by lean SMEs
which in exploration and exploitation. The following question is used as the main research
question: How can SMEs which operate with lean techniques handle the tension between
exploration and exploitation in order to be successful in short and long term?
In order to answer the main research question 42 lean SMEs active in the manufacturing
industry in the east of the Netherlands were examined. Surveys and interviews were used to
gather information. To analyse the information which was gathered at the businesses a fuzzy
set Qualitative Comparative Analysis (fs/QCA) was performed. fs/QCA is a method to
analyse combinations of factors in relation to a certain outcome. The steps which need to be
taken in order to carry out a fs/QCA well are explained in the results section. The results show
that there are multiple “paths” for most performance indicators, this means that there is more
than one possibility of combinations of factors leading to the form of success.
This paper contributes to the literature in a few ways. It further contributes to the existing
literature on SMEs, more specifically in lean management. Moreover does it give an insight in
how factors complement each other in facilitating ambidexterity in lean organizations. This
information can be useful in practice as it provides managers with valuable knowledge on
innovation in relation to successful asset growth, employee growth and product launch. The
discussion section further describes which steps organization can take and which factors they
2
Acknowledgements
De scriptie die nu voor u ligt is het sluitstuk van een gecombineerde Masteropleiding in
bedrijfskunde en innovatiemanagement en ondernemerschap. Deze opleidingen worden
aangeboden door de Universiteit Twente in Nederland en de Technische Universiteit van
Berlijn in Duitsland. Met veel plezier heb ik een aantal jaren aan deze innovatieve
universiteiten gestudeerd. De kennis die ik tijdens mijn studies heb opgedaan was zeer nuttig
tijdens de uitvoering van dit onderzoek. Dit onderzoek was echter ook prikkelend, het heeft
mij veel nieuwe vaardigheden laten ontwikkelen.
Op deze plek wil ik graag mijn begeleider, Sandor, bedanken voor zijn adviezen en
ondersteuning. Daarnaast gaat mijn dank ook uit naar Matthias, de tweede begeleider van
deze scriptie. De input die zij gegeven hebben bleken van veel betekenis voor de uitvoering
van dit onderzoek. Zonder de hulp van mijn begeleiders had deze thesis niet in zijn huidige
vorm voor u gelegen.
Speciale dank gaat uit naar mijn ouders en zus die mij hebben gesteund om dit werk te kunnen
voltooien. Uiteraard wil ik ook alle bedrijven bedanken die hebben deelgenomen aan dit
onderzoek, met name de bedrijven waar ik ook de interviews heb mogen afnemen.
Max van Oort
3 Table of contents
Management summary ... 1
Acknowledgements ... 2
Abstract ... 6
1. Introduction ... 7
1.1 Problem formulation ... 8
1.2 Objective ... 9
2. Theoretical foundations ... 12
2.1 Organizational success ... 12
2.2 Lean management ... 12
2.2.1 Principles of lean ... 12
2.2.2 Limitations of lean management ... 14
2.3 Exploitation and exploration ... 14
2.4 Small and medium-sized enterprises ... 16
2.4.1 Ambidexterity in a lean SME... 16
2.5 Research model ... 17
2.6 Factors ... 19
3. Methodology and operationalization ... 21
3.1 Methodology ... 21
3.1.1 Sample ... 22
3.1.2 Strategy ... 24
3.1.3 Qualitative Comparative Analysis ... 24
3.1.4 Common method variance ... 25
3.2 Operationalization ... 26
3.2.1 Lean management ... 26
3.2.2 Exploration and exploitation ... 27
4
3.2.4 Factors ... 27
3.2.5 “Success” of a firm ... 28
4. Results ... 31
4.1 Reliability ... 31
4.2 Step 1: calibration ... 33
4.2.1 Conditions ... 33
4.3 Step 2: necessary causal conditions ... 34
4.4 Remote and proximate conditions ... 35
Step 3a: remote conditions ... 36
Step 3b: proximate conditions... 37
4.5 Step 4: remote and proximate solutions ... 38
4.6 Step 5: fuzzy set fs/QCA ... 39
4.7 Practical activities ... 42
4.7.1 Interview I ... 42
4.7.2 Interview II ... 43
5. Discussion and conclusion ... 45
5.1 Discussion ... 45
5.1.1 Theoretical implications ... 45
5.1.2 Practical implications ... 46
5.2 Conclusion ... 47
6. Limitations and future research suggestions ... 48
6.1 Limitations ... 48
6.2 Future research suggestions ... 49
7. List of references ... 50
Samenvatting ... 63
Appendix ... 64
5
Appendix II ... 65
Appendix III ... 79
Index of figures and tables Figure 1: five key principles of lean management ... 13
Figure 2: planned research model ... 18
Figure 3: research model ... 30
Table 1: key data questionnaires ... 23
Table 2: reliability ... 31
Table 3: steps for a fs/QCA ... 32
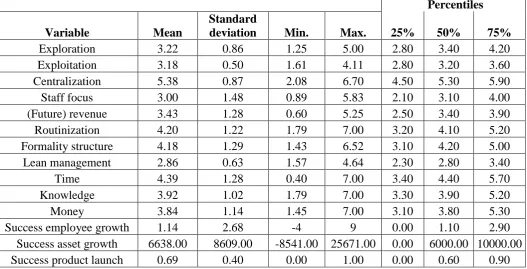
Table 4: descriptive of variables ... 34
Table 5: necessary conditions for outcomes ... 35
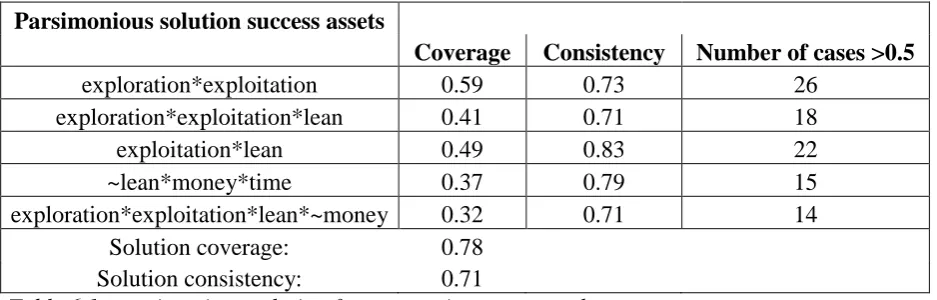
Table 6.1: parsimonious solution for success in asset growth ... 37
Table 6.2: parsimonious solution for success in employee growth ... 37
Table 6.3: parsimonious solution for success in product launch ... 37
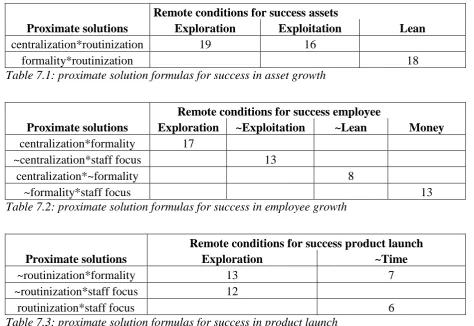
Table 7.1: proximate solution formulas for success in asset growth ... 38
Table 7.2: proximate solution formulas for success in employee growth ... 38
Table 7.3: proximate solution formulas for success in product launch ... 38
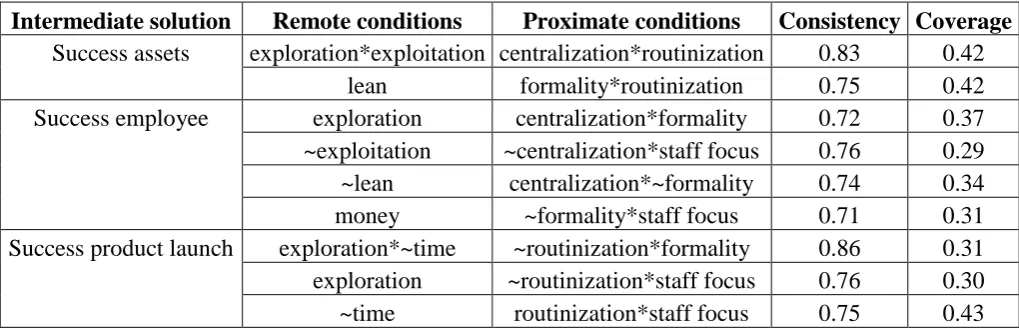
Table 8: intermediate solution with configurations for different forms of success... 39
6
Abstract
Previous research has shown the existence of different factors which affect the tension of
exploration and exploitation in innovation. Some scholars have suggested links between
this tension and lean management exist. However, few studies have examined the factors
which facilitate ambidexterity in small and medium-sized lean organizations.
Performing exploration and exploitation is vital for organizational survival. This
research examined 42 small and medium-sized enterprises which are active in the
manufacturing industry in the east of the Netherlands. Three ways for organizations to
be successful were predefined and analysed in a fuzzy set Qualitative Comparative
Analysis in combination with five factors. Data was gathered through surveys and
interviews. The analysis led to different solutions for small and medium-sized
enterprises to be successful in the short and long term. The findings showed that it is
very challenging for organizations to be successful in all three definitions as some
performance indicators have contrary success factors.
7
1.
Introduction
The current view on lean production techniques has been steadily developed in the last few
decades, but it’s origins are already older. The 20th
century saw some large changes in the
methods of industrial production. A major change within the area of industrial production
occurred after the second world war in Japan (Melton, 2005). The industrial engineers Taiichi
Ohno and Eiji Toyoda developed a socio-technical system at Toyoto Motor Corporation
which became known as the Toyota Production System (Beale, 2007). The Toyota Production
System was the first step of a system which would evolve to a set of theories known as lean
manufacturing (Womack et al., 1990). The focus of lean manufacturing is on continuous
improvement. This happens by removing all side-effects of a production process and solely
focussing on the main production process which delivers the final product to the customer.
Lean management is a hot topic last decades. Being lean is reached through waste
elimination, non-value added operations reduction and improve the added value of internal
processes. Most organizations work in environments that are changing quickly. By
introducing continuous improvement, organizations are trying to stay active in highly
competitive markets.
Staying active in highly competitive markets, is it just a matter of continuous improvement or
does it require more than that? By producing the same products over and over again, it’s
possible that products outdated someday, the T-Fords are not produced anymore either. For
the survival of a business it needs to work on its incremental and radical innovations, also
known as exploitation and exploration. By continuously improving the business processes
(“incremental innovation”) but also making sure new products, services and ways of production are invented a business can make sure it’s just as successful in the future as it is
now.
This thesis will explore the tension which exists between exploration and exploitation in a
lean environment. Previous studies have pointed out that there are combinations of factors
which will facilitate this tension. These factors don’t only influence the tension but also
influence each other. By applying a fuzzy set Qualitative Comparative Analysis (fs/QCA) the
complex relationships in lean small and medium-sized enterprises can be examined and
8 1.1Problem formulation
“As we are only a small company every day it’s a new conflict to assign enough people
between production and R&D. I need to reach my monthly targets but also need to pay
attention to our future production possibilities, meanwhile does my firm have a strict policy in
reducing organizational waste and working lean.”
- Product manager during one of the interviews
A practical problem which occurred to me was the statement above. Many organizations do
not know how to spend their scarce resources well and how to put enough focus on radical
innovations which cannot be left out at the expense of efficient exploitation. When an
organizations works with lean principles this problem becomes even more prevalent as lean
management indicates that all waste should be eliminated systematically.
The goal of this study is to examine how small and medium sized-enterprises (SMEs) which
operate with lean techniques handle the tension of exploration and exploitation. Exploitation
is linked to incremental innovation which is directed at short term efficiency. Exploration on
the other hand is linked to radical innovation directed at long term flexibility (March, 1991).
Activities include searching for, creating or experimenting with new opportunities. Efficiency
in the short term and flexibility in the long term are contrary to each other and creates a
tension. Ambidextrous organizations are organizations who are able to create a sustainable
competitive advantage. These organizations are able to compete in mature markets and
simultaneously develop new products or services for emerging markets (Preda, 2014). Lean
techniques are a set of methods derived from the Toyota Production System and have the
elimination of waste as a main focus (Womack and Jones, 1990). It wants to create maximum
customer value by removing everything from the production system which does not directly
add value to the final product (Womack, 2006).
Lean management makes handling the tension of exploration and exploitation harder because
of its focus on efficiency. The efficiency, and thus standardization, which is created by lean
management stimulate exploitation but reduce exploration. Standardization and a focus on
production leaves less possibilities for innovation and creative thinking (Chen and Taylor,
2009). In order to be successful and have a sustainable competitive advantage lean
9 increase productivity in the short term but decreases the innovation capabilities of an
organization in the long term (Chen and Taylor, 2012; Amabile, 1998).
1.2Objective
The objective of this study is to analyse the supposed clash which exists between exploration
and exploitation in a lean organization. For many organizations it’s a constant struggle how
efficiency and innovation can be reached at the same time. Because exploration and
exploitation influence both short and long term, both time frames will be taken into account.
In the current literature there is no unambiguous agreement on the possibility of organizations
to handle the tension of exploration and exploitation, especially in a lean environment. It is
argued that balancing exploration and exploitation positively relates to sales growth rates
while a relative imbalance is negatively related to growth rates (He and Wong, 2004). How
this balance is reached remains an important gap within the existing literature (Chang and
Hughes, 2012). In another way is it acknowledged that both exploration and exploitation are
essential for organizations but are these actually not able to be performed at the same time due
to competition for the same scarce resources. The result from this is that companies still make
a choice between exploration and exploitation at the expense of the other (March, 1991).
This study specifically focusses on SMEs because they are relatively under examined in
current literature. A lot of research has been conducted on how large multinational companies
like British Airways and Apple handle the tension of exploration and exploitation in a lean
environment but a gap exists within the literature on the tension in SMEs (Tushman and
O’Reilly, 1996). SMEs are an important part of the Dutch economy, out of all companies in
the Netherlands almost 99% are considered to be a SME (Roth, 2011). Moreover do SMEs
generate about half of the GDP of rich countries and do they employ 75% of the workforce in
OECD countries (Roth, 2011). The relative lack of attention to SMEs in current literature on
ambidexterity also leaves a disproportionate gap compared to the economic importance of
SMEs in not only the Netherlands but also in other major Western economies.
It is vital for a company’s survival to be explorative and exploitative. Without optimizing
current production techniques and exploitation the current product portfolio a business will be
competed out of business. Moreover is exploration necessary as products can get outdated and
10 innovation. Because simultaneously performing exploration and exploitation are key to
success and are at the base of how a company sees its current and future products, exploitation
and exploration should both be taken into account in this research. By merely focusing on
lean management and exploration the research would be incomplete, as a company cannot
only survive on exploration. As March (1991, p. 71) clearly describes: “Conversely, systems
that engage in exploitation to the exclusion of exploration are likely to find themselves
trapped in suboptimal stable equilibria. As a result, maintaining an appropriate balance
between exploration and exploitation is a primary factor in system survival and prosperity.”
Taking into account the objective of this study the following research question will be asked:
How can SMEs which operate with lean techniques handle the tension between exploration
and exploitation in order to be successful in short and long term?
This research question will be answered by using a fuzzy set qualitative comparative analysis.
In order to answer this research question this thesis will use two sub research questions. The
first research question will be answered by conducting an extensive literature study, its
purpose is to determine which factors are able to influence the tension. The first sub research
question for this study will be as follows:
Which factors are able to influence the tension between exploration and exploitation?
The second sub research questions look at the practical side of the factors which were derived
in the previous sub question and how they relate to everyday problems in organizations. To
answer this research question interviews will conducted. The second sub research question
will be as follows:
How do the factors of this study reflect the practical activities of the organizations?
This first chapter is an introduction to the topic of this thesis. Chapter two will place the
theoretical foundations, these are lean management, the tension of exploration and
exploitation in SMEs, success and the different factors used in this research. In chapter three
11 published in chapter four. Chapter five will discuss the limitations of this study and the future
12
2. Theoretical foundations
In this chapter the theoretical foundations for this thesis will be introduced and discussed. The
chapter will describe organizational success, lean management and exploration and
exploitation (ambidexterity). Finally, this chapter will present the research model and the
factors used in this study.
2.1 Organizational success
Organization strive for organizational success, but what organizational success is can be
interpreted in many different ways. Organizational success in general can be seen as how far
an organization is able to pursue its goals. Organizational goals can be defined in multiple
ways, profit maximization (Hayter, 2011) or shareholder value maximization (Lazonick and
O’Sullivan, 2000) are common goals of organizations. Lingegård and Sandström (2008) state
that Levin and Weström (2003) stress out that within the academic world measuring growth in
employees is common to measure success. Employee growth is key in determining the
success of a small and medium-sized enterprise (SME) (OECD, 2002; Jasra et al., 2011).
Growth of the work force of an organization is a better indicator for success than turnover
growth (Foreman-Peck et al., 2006).
2.2 Lean management
2.2.1 Principles of lean
Lean management is a set of techniques which finds it origins in Japan, it’s a system which
strives for continuous improvement in a production process (Womack et al., 1990). Lean is
not reached on an individual level, the principles work on a system wide level and only work
in the organization as a whole. The organization has to take a holistic approach to its activities
(Fullerton et al, 2014). Even though lean management was originally meant for manufacturing
organizations, lean is also applied to service organizations nowadays. Lean management has
become an important topic in literature because the technique is seen as a method of best
practice (Hampson, 1999), its principles can lead to improved performance and
competiveness of an organization as it works on optimizing the organization’s processes and
eliminating waste. Important within lean management is putting the customer on a central
position in the processes, only the activities that directly add value to the product for the
customer are allowed to stay in the production process (Womack and Jones, 1996;
13 Figure 1: the five key principles of lean management (Womack and Jones, 1996; Peters,
2015)
Five key principles play an important role in the elimination of spill overs in becoming lean.
These key principles are at the base of implementing lean techniques successfully (Womack
and Jones, 1996; Peters, 2015). The principles can act as a framework for the implementation
of lean management. It is important to know that only small parts in the process add real value
for the customer, by acknowledging this recognizing waste will be easier. The identified
principles are:
- Specify the added value: only a part of the production process adds real value for the
customer. By understanding that this part is small but essential all the other activities
that do not add any value can be removed.
- Define all activities in the current process: by knowing how a product is delivered
necessary steps can be taken to ensure the customer gets the correct service.
- Eliminate waste: by eliminating all waste in the system you can make sure the product
or service can flow easily and without interruption to the customer.
- Let the customer trigger the process: by letting the customer trigger the process
products are only produced to customer demand and when the customer wants it. This
improves the product flow in the production.
VALUE
ACTIVITIES
WASTE TRIGGER
[image:14.595.144.432.91.340.2]14 - Strive for perfection: by continuously eliminating waste and improving the flow of the
process the customer can be served in a better way. This way, an organisation can
become lean.
2.2.2 Limitations of lean management
Lean management is widely acknowledged as an important production system but it also has
its drawbacks. Lean management has benefits in a production process like improving quality,
reducing costs and a customer focus (Womack and Jones, 1996) but it is also criticised.. Some
critics have stated that lean management lacks overall effectiveness (Näslund, 2008). Lean is
usually implemented in an ad hoc and quick way without looking for company characteristics.
If the whole company is not reviewed in a holistic way this affects the effectiveness in a
negative way. Lean management on itself is also not a new concept (Näslund, 2008), it’s just
a different version of the previous techniques of just-in-time and total quality management.
These techniques are based on the same fundamental approach as lean management, which
means lean management cannot be considered to be a technique on itself.
In a lean system production system there are no margins of errors which means it is very hard
to become a fully lean organization. Safety stock is non-existent. The costs for implementing
lean can be very high as it requires a lot of effort to set up a fully lean system (Fullerton and
Wempe, 2008). Moreover does the external environment play a substantial role in lean
production. These external factors play a role in for example supplying a firm but cannot
always be controlled to the benefit of the company. These external factors are moreover
influenced by the dominant company in a supply chain. When supplier dominance exists
because of only a few suppliers operating in the market it is not possible to demand extra
conditions (Cox and Chicksand, 2005). The same applies to downstream buyers. This means a
business is only able to use lean techniques to the fullest when it has both supplier dominance
upstream and buyer dominance downstream.
2.3 Exploitation and exploration
Exploitation is associated with refinement, production, efficiency and execution (March,
1991). Exploitation within a business context are incremental innovations. Small changes to
15 (Andriopoulos and Lewis, 2009). Its main purpose is to continue with the current product
portfolio and using this as effective as possible. All uncertainty is removed from the process,
only current knowledge is put to use. Exploitation is necessary for short term survival of the
company, it’s directed at short term efficiency.
Exploration is associated with search, risk taking, experimentation, flexibility and innovation
(March, 1991). In a rapid changing world, companies are forced to come up with new ideas
every day (Dunk, 2011). In order to stay competitive and ahead of competition these
organizations should not stick to the capabilities they already have but make sure they
develop new ways to align in this ever changing world (Zhang, 2011). Exploration is
necessary to stay flexible and survive in the long term (March, 1991). Exploration can be seen
as the opposite of exploitation, it is not only directed at products but also at entering new
markets with existing products (He and Wong, 2004). Exploration is seen as risk taking to
flexibility and discovery (March, 1991). Exploration works in environments which are
dynamic and have an open culture to support generating ideas (Chang et al., 2011). The future
results of exploration activities is insecure because demand is not known (Greve, 2007), the
current exploitation activities of a company are easier to forecast.
Pursuing exploitation and exploration simultaneously is important, yet can be challenging for
firms. Exploration and exploitation are a central part in the organization’s view of old
certainties and new possibilities (March, 1991). Explorative innovation and exploitative
innovation are both forms of innovation. Innovation means transforming new knowledge into
new or better products, services or processes. Exploration and exploitation can be seen as
contradicting as they need to make use of the same limited resources. A tension between these
two actions exist as too much focus on one of the two will harm the other (He and Wong,
2004). For the continuity of a business both exploration and exploitation are important as the
ability to build upon current capabilities and meanwhile being able to develop new
capabilities is essential to the firm’s ability to compete overtime (Teece et al., 1997). A
so-called “balance” (ambidexterity) is necessary (March, 1991). Ambidexterity means that an
organization is able to simultaneously perform exploration and exploitation. To achieve an
ambidextrous balance active management involvement is necessary (Raisch et al., 2009).
Ambidexterity does not mean both exploration and exploitation get the same amount of
attention and resources but it means both get enough attention and resources. A stable balance
16 resources for both sides of the innovation scale is very rare, as organizations tend to favour
one over the other. This is not a problem as long as an organization can be innovative and
effective at the same time. Exploration and exploitation are competing for the same scarce
resources (information, knowledge, skills, time, money). To achieve long term success both
exploration and exploitation need to adapt to the business needs.
2.4 Small and medium-sized enterprises
Small and medium-sized enterprises (SMEs) are not only distinct from large organizations
because of their size but also in the different challenges they face. This chapter will look more
into these challenges which play an important role in doing business for an SME.
Small and medium-sized enterprises are occasionally called the “engine of the economy”
(Rijksoverheid, 2014). SMEs are also considered to play a key role in radical innovations
(Cosh and Zhang, 2012). Most of the literature which is available on ambidexterity has a
focus on large companies. Large companies however, have a lot more resources (for example:
time, money and knowledge) available to support them in being ambidextrous. SMEs feel,
because of their smaller size, a larger constraint on the resources which are available to them.
Both exploration and exploitation will compete for the same scarce resources (March, 1991).
Large companies are able to balance their strategy and simultaneously perform exploration
and exploitation.
SMEs are less able to be ambidextrous but also profit less from being ambidextrous (Voss and
Voss, 2013). For organizations with more resource constraints it is more beneficial to follow a
balanced ambidexterity while organizations who have more access to internal or external are
more beneficial following a combined ambidexterity. When resources are sufficient, large
organizations don’t have to make choices between trade-offs of exploration and exploitation
(Cao et al., 2009).
2.4.1 Ambidexterity in a lean SME
Exploration and exploitation take in different role in a SME compared to a large firm. The
ambidexterity of exploration and exploitation is important in balancing the strategy for
short-term efficiency but also flexibility in the long-short-term (March, 1991; He and Wong, 2004).
Resources in a SME are limited which means they cannot always cover all aspects of
17 innovation strategy (March, 1991). Due to limited size of SMEs compared to large
competitors the restrains of the amount of available resources puts pressure on the innovation
system (Terziovski, 2010). In a lean environment all activities that do not directly add value
are removed, this includes activities that could possibly generate ideas (Chen and Taylor,
2009). Organizations that focus on productivity, compliance with the regulations and turn the
workplace into one of control and surveillance will (unintentionally) annihilate all innovative
behaviour (Green, 1999).
Lean management focusses on standardization and efficiency, this means it will enhance
exploitation at the cost of exploration. The sole focus on effectiveness and standardization of
the work place will reduce job commitment by employees (Chen and Taylor, 2009). Passion
for work is lost and an employee will stick to its pure job description. A reduced amount of
employee involvement and standardized job characteristics impact exploration negatively (Al
Hasan and Al-Zu’bi, 2014). Empowering employees to be able to organize their own work
and solve their own problems is key in the ability of employee learning. The impact of lean
was observed by Mehri (2006) in the Toyota production system, the design of the system
negatively influenced creativity and innovative behaviour of employees.
Due to the limited size of SMEs do resource restraints have a different effect than they have in
larger corporations. Innovation ambidexterity is a large challenge for SMEs because of
resource constraints which favour exploitation and can decrease employee learning. Moreover
is it suggested that the centralized nature of many SMEs increase exploitation as it’s seeking
to react quickly with current competencies to market uncertainties (Jansen et al., 2006; Chang
et al., 2011).
2.5 Research model
The research model which is used in this thesis combines the challenges for SMEs as stated in
the previous chapter. Not only a tension exists in being ambidextrous but also in being able to
perform exploration and being lean. Ordanini et al. (2013) and Cheng et al. (2012) suggest in
their work that there are different paths leading to success in innovative organizations through
combinations of factors, these factors are complimentary to each other (Hodson and
Roscigno, 2004). The existence of combinations of factors leading to success has widely been
acknowledged (Mom et al., 2006; Pandey and Sharma, 2009; Voss et al., 2008). Reichert et
18 exploratory performance. This previous research points in a direction of different factors
which influence the performance between exploration and exploitation but also the overall
success of an organization. Currently, the view of the combinations of these factors are as a
facilitator for exploration and exploitation. So these factors enhance the possibility to combine
exploration and exploitation in an organization. Sierra and Malone (2003) furthermore
suggested that paths leading to success are heavily influenced by lean management in the
manufacturing industry. By taking into account previous research which suggests the
existence of combinations of factors leading to an organization’s success but also the
influence of these factors on exploration and exploitation in a lean environment this research
will combine these parts and look at the tension of exploration and exploitation in a lean
environment. It’s expected from previous studies that there are factors which facilitate or
[image:19.595.75.548.331.543.2]hinder ambidexterity of exploration and exploitation.
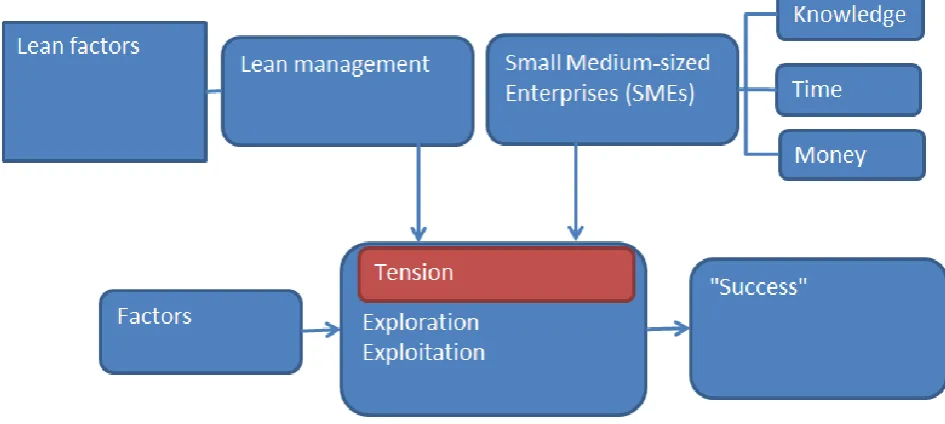
Figure 2: planned research model
The proposed research model for this thesis is placed above. This study focusses on the
tension of exploration and exploitation, this tension is either positively or negatively
facilitated by certain factors. These factors will be described in the next paragraph. Lean
management and being a Small Medium-sized Enterprise influence the tension of exploration
and exploitation as well. The outcome of the tension of exploration and exploitation has a
certain level of success. By being ambidextrous and being able to simultaneously perform
19 2.6 Factors
Different factors influence the tension of exploration and exploitation. To answer the sub
question which was stated at the end of the previous paragraph an extensive literature study is
performed. Based on literature about different factors on innovation management, five
different factors were chosen. These five factors will be used in relation to their ability to
influence the tension which exists in the ambidexterity between exploration and exploitation.
Defining which factors are important in their relation to the tension between exploration and
exploitation in a lean environment is an essential part of this research. The factors were all
chosen because of their ability to influence exploration and exploitation. Several studies have
already linked these factors to innovation management but have not reviewed these factors in
a lean business environment. By selecting these factors it is expected that they have the most
important influence within this research and are thus most suitable to examine.
Centralization
Centralization relates to centralization in decision making (Chang et al., 2011). It defines in
which way the power in an organization is divided. In a centralized organization the power is
hold by top management and all decisions are made by the same top management. In a
decentralized organization, departments have more power to decide by their own.
Decentralizing an organization makes the organization better and quicker able to fulfil the
customer’s needs (Sheremata, 2000). SMEs tend to be very centralized which has a negative
impact on ambidexterity in SMEs, the centralized nature of SMEs gives it a focus on
exploitation at the cost of exploration (Jansen et al., 2006).
Staff focus
With a clear task description it’s easier for employees to stick to their day-to-day work (Mahr,
2010). By shifting people between departments an organization can influence it’s exploration
and exploitation. Hiring out activities is also included in staff focus as a clear distinction
between exploitation (internal) and exploration (external) is being made (Tønnessen, 2012).
Due to the smallness of many SMEs is it a large challenge to stick to staff focus, SMEs don’t
have enough staff to make a large distinction between tasks, in general employees will have
the responsibility for both explorative and exploitative tasks.
(Future) revenue
Revenue is important for an organization as it needs cash flowing in to pay its current
responsibilities (La Rocca et al., 2016). Today’s operations generate revenue but it’s not sure
20 firms with limited financial abilities, will therefor focus on exploitation of a current product
portfolio and will not pay enough attention to future possibilities. SMEs however, are in many
occasions family-owned businesses (Madueño et al., 2011). Family-owned businesses are
very future or next generation oriented which means (future) revenue will facilitate the
tension of exploration and exploitation.
Routinization
Routinization is used to simplify work tasks and give structure to the production process
(Chen and Taylor, 2009). It defines to what extent work is formalized and standardized in an
organization (Daft et al., 2010) Exploration is reached through trial and error and creativity
(Hoerl and Gardner, 2010) which gets minimalized in standardized work positions.
Routinization which leads to standardization reduces job commitment (Chen and Taylor,
2009), it is expected that routinization will have a negative effect on the tension because of a
focus on exploitation.
Formality structure
Formalization reflects in which way procedures in an organization are arranged within the
organization. Formalization in an organization relies on written rules and procedures which
are formally institutionalized in a business (Khandwalla, 1977; Jansen et al., 2005). Too much
formalization, also seen as too much bureaucracy, reduces exploration as new knowledge
cannot be processed quickly (Weick, 1979), which makes formality an important challenge
21
3. Methodology and operationalization
This chapter focusses on the methodology used in this study, information about the sample
will also be presented. The choice for the research method (fs/QCA) will also be discussed in
this chapter. Finally, the variables will be operationalized and the final research model will be
presented.
3.1 Methodology
Most of the data in this thesis is gathered through questionnaires, in a later stage interviews
are also be conducted. The questionnaires are divided into four different parts (see appendix).
The first part of the survey is focussed on the way exploration and exploitation are used
within the business. Part two looks at several different factors which influence the tension
between exploration and exploitation. Part three is about measuring the implementation of
lean in an organization. Finally, the last part of the survey looks at how resource scarcity
plays a role in an SME. The scales of the questionnaires differ between the different sections
but follow a progressive pattern. The answer options were chosen with the use of the
commonly used 5 or 7-point Likert-type scales (Dawes, 2008). Questions according to this
scale system give uniform answers which can be compared in a cross-sectional study. In the
second part it is possible to go deeper into the understanding of how the business is run and
how the participant sees the strong and weak points.
In the survey research, innovative technical organizations will be examined. The surveys will
be spread digitally. These are businesses that 1) make use of a manufacturing process and 2)
are active in an innovative manner, this means creating new goods or services for customers.
Technical organizations are specifically chosen as they make use of a manufacturing process,
because lean management originated in the manufacturing industry it is easier to review how
lean a technical organization is. Moreover is exploration and exploitation much more
important in the manufacturing industry then in the service industry (Gallouj, 2002). So by
conducting this research technical organizations were the better choice. Organizations will be
selected by their ability to innovate and the way they organize lean techniques. The
organizations operate within the Netherlands. The participants have to be in touch with lean
management and exploration and exploitation within the company. Preferably these people
have a different background on the work floor, this can be a workplace/finance manager or
22 as companies up to 250 employees. As my focus is on SMEs it is likely that the whole
organization gets in touch with lean management and exploration and exploitation.
3.1.1 Sample
For this research I will look at small and medium sized-enterprises, in short SMEs. The
definition for SMEs varies between countries but for this study the official definition of the
Dutch industry organization will be used. This means that a small organization is an
organization with less than 50 employees and a mid-sized organization has between 50 and
250 employees (MKB Nederland, 2016). Thus an SME has less than 250 employees.
In this research only production companies will be taken into consideration. As lean
management originated from this industry and is most related to the concept it will contribute
to a better understanding of the overall work. Because products can get outdated very quickly
(Cronin, 2010) production companies are keen in making sure they innovate.
Businesses were selected through different sources, there are varying lean organizations and
lean networks which either support businesses or have lean members. Through contact with
these organizations and information displayed on their websites the lean organizations for this
thesis were selected. The backgrounds of the respondents and their industry differs, the key
Case Industry Position respondent Age Empl. Establish- Case Industry Position respondent Age Empl. Establish-
respondent years ment respondent Years ment
Company 1 Metal CEO 61 32 1984 Company 22 Metal CEO 52 26 1910
Company 2 Machinery CEO 45 14 2002 Company 23 Metal Quality officer 31 5 1981
Company 3 Electronics Production manager 36 4 1970 Company 24 Printing CEO 43 17 1999
Company 4 Machinery Office manager 26 1 2002 Company 25 Metal Quality officer 25 3 1990
Company 5 Automotive Production manager 37 4 2000 Company 26 Automotive Product developer 46 1 1985
Company 6 Automotive Product developer 32 2 2010 Company 27 Metal Product manager 32 7 1931
Company 7 Metal CEO 52 2 1993 Company 28 Machinery Product manager 57 19 1956
Company 8 Agriculture Lean manager 42 7 1939 Company 29 Agriculture CEO 53 32 1980
Company 9 Machinery Production manager 32 3 1982 Company 30 Metal Production manager 53 30 2001
Company 10 Automotive Product developer 36 10 1928 Company 31 Packaging Production manager 54 10 1952
Company 11 Machinery CEO 62 37 1979 Company 32 Electronics Production manager 48 8 2008
Company 12 Maritime CEO 57 23 1900 Company 33 Furniture Product manager 26 6 1888
Company 13 Machinery CEO 48 5 1955 Company 34 Machinery Lean manager 43 8 1854
Company 14 Metal Commercial manager 38 12 1929 Company 35 Metal Lean manager 45 9 1961
Company 15 Metal Lean manager 49 1 1930 Company 36 Automotive CEO 53 26 1969
Company 16 Pharmaceutics Production manager 23 5 1993 Company 37 Metal Process manager 43 9 1918
Company 17 Metal Product developer 57 7 1935 Company 38 Metal Production manager 57 30 1938
Company 18 Metal Lean manager 29 1 1900 Company 39 Automotive Product manager 32 2 1990
Company 19 Metal Production manager 36 16 1963 Company 40 Metal Product developer 34 5 1973
Company 20 Machinery Production manager 47 9 1974 Company 41 Packaging CEO 62 22 1994
Company 21 Machinery Business analyst 23 1 1911 Company 42 Paint CEO 48 9 1970
24 3.1.2 Strategy
The strategy which is used in this thesis is to perform questionnaires and based on the
gathered data go more in depth through some interviews. Data acquired through interviews
and questionnaires will be handled with great care and will not be shared with third parties.
When preferred by the interviewees, the exact answers of interviews will not be shared. This
is done on purpose to keep an open and honest conversation. For the first part of this thesis
data was acquired through questionnaires, questionnaires give the ability to generate a larger
pool of data suitable for comparison between different organizations. This was necessary to
determine how the factors appear in organizations. The questionnaire was sent to 183
companies in the east of the Netherlands, within a week 48 companies responded of which 40
responses were complete and 8 responses were empty. After one week a reminder was sent to
the remaining businesses which had not yet filled in the questionnaire, after this reminder
there were 5 more responses out of which 2 were fully filled in. The 2 questionnaires which
were filled in after the reminder do not differ from the questionnaires which were filled in
immediately. In total there were 53 responses recorded which is a response rate of 28,9%. The
response rate of valid responses is 22,9%.
After the questionnaires were analysed, interviews were held. This method was chosen to get
a better understanding of the results and how these take place in two of the companies who
took part in the questionnaire as well. The owner of company 22 was interviewed for about
1,5 hours. The production manager and an employee of the production preparation department
of company 30 were separately interviewed for 1,5 hour. A set of interview questions were
prepared but the interviewer was able to ask other questions too and ask further when
necessary. These organizations were selected on how they fit into the data, company 30 was
less successful than company 22. The solution in which the organizations fit can be seen in
chapter four in table XII.
3.1.3 Qualitative Comparative Analysis
Qualitative Comparative Analysis (QCA) is a relatively new research tool which is very
suitable for comparative case studies (Schneider and Wagemann, 2010). Case studies help to
become familiar with a large set of data in a fair amount of time and by applying a QCA it is
possible to cluster cases in certain paths which will lead towards a shared outcome. A QCA
25 A more specific tool in a Qualitative Comparative Analysis is the use of a fuzzy set. The
inspiration to create this tool (Ragin, 2008) was that certain variables can be labelled as a
degree. More practically, in this research for example can organizations be fully lean or not
lean at all. But by stating the variable “lean management” so bold it will be likely (almost) all
firms will be labelled as not lean at all which would be harmful to the results of the thesis. So
in order to get a complete understanding of the situation in the cases as is, it is necessary to
use a fuzzy set instead of a normal Qualitative Comparative Analysis.
Using a fs/QCA is a very suitable research tool to use in this thesis. There is a large pool of
data of several cases which needs to be analysed and compared to be able to see if certain
factors influence how organizations handle the tension between exploration and exploitation.
fs/QCA is best suitable to tackle this problem because of the complex nature of organizations
(Fiss, 2011). By translating the scores of the questionnaire into data which is suitable to run a
fs/QCA different typologies between the cases will be able to be spotted.
3.1.4 Common method variance
Common method variance can occur within self-reporting survey research, it’s a bias in which
variance in answer cannot be attributed to the actual real life situation but to the variance in
the measurement method. It’s a potential problem as it reduces validity and can either support
non-existing relations or neglect existing relations. Potential sources for common method
variance can occur when respondents quickly fill in equal answers to finish the survey in a
rush, answers on previous questions influence the choice of answer on a (un)related question
(Podsakoff et al., 2003), results are being inflated or deflated against their actual situation.
The real effects of common method variance are not undisputed (Spector, 2006) but will be
tried to be tackled as much as possible.
Unfortunately obtaining information from the respondents separated by time, space and
method will not be possible for this research as it relies on the willingness of the respondents
to take the survey and provide enough information. On the other hand will the survey be
handed anonymously and with great care, moreover will it be stressed that right or wrong
answers do not exist. The survey will be split into two versions with counterbalanced
questions, this way the potential interference between the question sets will be reduced. The
26 sets are split into two and placed on a new page so participants can fully concentrate on a
limited amount of questions. Respondents with sufficient knowledge are asked to fill in the
survey to be sure a suitable answer is retrieved.
3.2 Operationalization
In the conceptual model which was proposed in the introduction several parts were still
considered to be unknown or a “black box”. The gaps which were still open in the model will
be determined in this part of this thesis. In this chapter all concepts will be further defined and
operationalized.
3.2.1 Lean management
There are multiple ways to measure the leanness of an organization. An important part in this
research is to measure to what extent a business performs in a lean manner. As the extent to
which lean management is implemented plays an important role in the way the tension
between exploration and exploitation is created. Li et al. (2005) used a method to review pull
production, short lead times from suppliers, set-up times, continuous quality improvement and
streamlining. These factors were combined into the “internal lean practices”. The extent to
which lean tools are implemented varies between industries (Krishnan and Parveen, 2013) but
lean management is used across all sectors. The operations of lean management were captured
in 48 tools by Shah and Ward (2007) which was further specified to ten dimensions to
measure how far businesses operated lean. These ten dimensions will be used in this research
to measure lean within a SME. The ten dimensions all weight the same in the number which
is given for lean. Three of these dimensions measure involvement of the supplier, one
measures involvement from the customer and the remaining six measure internal issues of the
firm. The dimensions are:
- Supplier feedback: measures if organization gives feedback to suppliers about
performance
- Just-in-time delivery by suppliers: measures if the right quantity at the right time in the
right place
- Supplier development: measures if suppliers are involved in the production process of
an organization
- Customer involvement: measures the focus of an organization on the needs of the
customers
27 - Continuous flow: measures the easiness of production flow through an organization
- Set-up time reduction: measures downtime between two different production types
- Total productive/preventive maintenance: measures downtime of production due to
maintenance, goal is to achieve high availability of equipment
- Statistical process control: measures the extent of units without errors are delivered
- Employee involvement: measures the involvement of employees in solving problems
3.2.2 Exploration and exploitation
An important aspect of this research is to examine to what extent the tension between
exploration and exploitation can be experienced in an organization. Feeling the tension does
not relate to any specific divide between the two terms but can occur at either focus or at
complete ambidexterity. In order to measure how exploration and exploitation are used in a
company a set of questions which were based on Jansen et al. (2006) were used.
3.2.3 Resource scarcity
Within a SME all departments rely on the same limited amount of resources. Because of scale
problems which small organizations face does resource scarcity have a larger impact in setting
priorities in a SME than in a larger organization. Several factors are determined which
influence setting priorities, these are information, knowledge, skills, time and money
(financial resources) (Stewart, 1998; Gupta et al., 2006). To achieve long term success both
exploration and exploitation need to adapt to the business needs. It is also argued that because
of the resources freely available in the external environment not all resources necessary for
exploration and exploitation are scarce (Gupta et al., 2006). This study uses knowledge, time
and money to determine if resources are widely available within the examined companies, the
set of questions were based on Zauberman and Lynch (2005), Kraatz and Zajac (2001) and
Holsapple and Joshi (2001). These resources were asked separately and will also be taken
separately as three variables in the analysis.
3.2.4 Factors
Centralization
Centralization is measured by using the items of Jansen et al. (2006), Hage and Aiken (1967)
and Dewar et al. (1980). This part of the research measures whether employees are free in
making their own decisions and if someone up in the hierarchy of the company needs to
28 Staff focus
Staff focus is a factor to determine whether employees are able to work on innovative
capabilities. Several propositions (Neely et al., 2002; McKenna, 1997) will be stated for the
participants in the survey to determine if staff also gets the ability to work on either
exploration or exploitation. It’s to examine if innovation also gets priority within a firm or
that staff is shifted away from the research department.
(Future) revenue
To measure the (future) revenue focus of an organization it’s important to look at the way the
organization sees its future. When an organization has a strong focus on future products,
services and success it will already need to take action today. (Future) revenue measures if the
organization is future oriented. If the future performance already plays an important role in
current innovation activities. (Future) revenue is measured by several propositions (Ward,
1997; Storey, 1994).
Routinization
Routinization is measured by using the propositions of Hage and Aiken (1967) and Dewar et
al. (1980). This part of the research measures whether employees work on routine, if tasks are
split up and if work is the same from day-to-day. By measuring if work is repetitious the
amount of routinization can be determined.
Formality structure
The formality structure is measured by using the propositions of Jansen et al. (2006), Hage
and Aiken (1967) and Dewar et al. (1980). This part of the research measures if the work
environment of a firm is formal or informal. The formality of a work environment determines
if procedures and bureaucracy drive the organization in following written procedures and
rules. Formality is an important indicator of the structure and work place design of a firm.
3.2.5 “Success” of a firm
Organizations, including SMEs, strive to be successful. If an organization is not able to handle
the ambidexterity between exploration and exploitation it will not be successful. By handling
the ambidexterity between exploration and exploitation well a business can grow. In this
paper I will use three ways to measure how successful an organization is. The first definition
of success used are employee and asset growth over a three year period. Lingegård and
Sandström (2008) state that Levin and Weström (2003) stress out that within the academic
29 the success of an SME (OECD, 2002; Jasra et al., 2011). In this thesis employee growth is
defined as the growth/decline in employees in the last two years. Growth of the work force of
an organization is a better indicator for success than turnover growth (Foreman-Peck et al.,
2006).
The second definition is asset growth in a business. Asset growth is key in predicting future
abnormal returns thus future success (Cooper et al., 2008). Data for asset and employee
growth will be taken from balance sheets which are available at the Dutch chamber of
commerce, the Kamer van Koophandel. A three year period (Lingegård and Sandström, 2008)
is essential in looking at the span of growth as there could be general fluctuations within a one
or two year period. By looking at three years a trend can be noticed.
The third definition is looking are product launches by a business. Through open sources, like
newspaper articles it can be examined how many product launches have taken place in the last
3 years and will take place in the next 3 years. This way the data gathered on product launches
will be independent and reliable. Launching products is an essential part in being successful at
exploration and is a key element in sustainable growth (Hart, 1993; Benedetto, 1999). Product
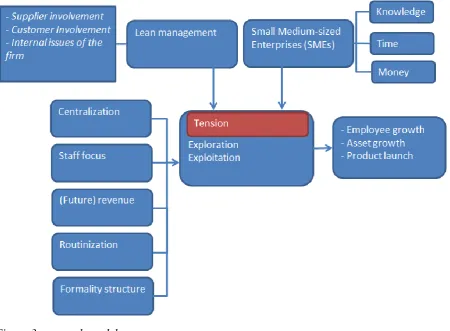
30 Figure 3: research model
In line with the factors which were determined and the way lean management can be
measured the final research model is proposed. The model shows the relationship between
centralization, staff focus, (future) revenue, routinization and formality structure how they
positively or negatively facilitate the tension of exploration and exploitation. Moreover is lean
management devided in the three parts: supplier involvement, customer involvement and the
internal issues of the firm. The problems which SMEs face are determined by scarcity of
knowledge, time and money. Lean management and the characteritics of SMEs also influence
the tension between exploration and exploitation. Whether a business is successful in handling
31
4. Results
This chapter reviews the results which were gathered through the surveys. Cases will be
compared on a few key data and by using the fs/QCA program of Ragin et al. (2006). The
chapter starts off with a paragraph about the reliability of this study and an overview of the
steps which are taken in the two-step approach of a fs/QCA and the analysis itself. This
chapter finishes by answering the last sub research question.
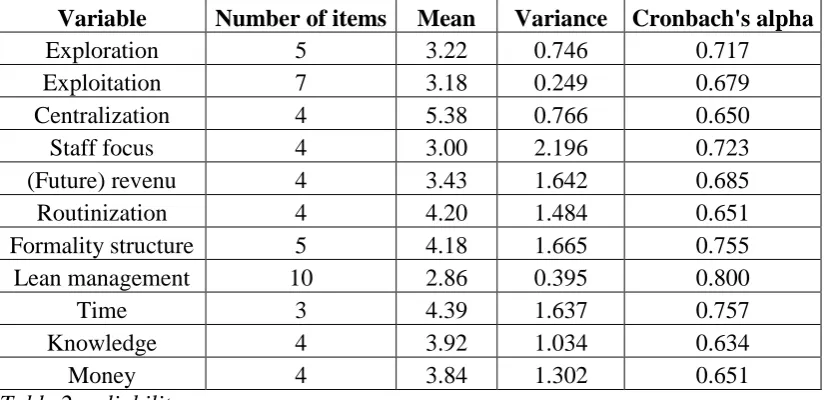
4.1 Reliability
Reliability relates to the overall consistency of a study, it is therefore important to test if
results will be similar under similar conditions. Even though this thesis has a relatively small
number of cases it is important to review the reliability of this study. Cronbach’s alpha is a
measure of internal consistency (UCLA, 2016), it’s considered to be a measure of scale
reliability. The reliability of a test should be measured before any conclusions can be drawn
(Tavakol and Dennick, 2011). A Cronbach’s alpha between 0,70 and 0,95 is considered to be
good in general whereas a number between 0,60 and 0,70 is questionable (Nunnally and
Bernstein, 1994). Most of the variables in this research fall into the good category. However,
due to the low amount of questions and items per variable the remaining variables can also be
considered to be reliable. Cronbach’s alpha minimum bound can be lowered to 0,60 (Slavec
and Drnovsek, 2012). Even though the variables with a Cronbach’s alpha between 0,60 and
0,70 will be accepted for this study, they should be viewed with caution (Hulland, 1999).
Variable Number of items Mean Variance Cronbach's alpha
Exploration 5 3.22 0.746 0.717
Exploitation 7 3.18 0.249 0.679
Centralization 4 5.38 0.766 0.650
Staff focus 4 3.00 2.196 0.723
(Future) revenu 4 3.43 1.642 0.685
Routinization 4 4.20 1.484 0.651
Formality structure 5 4.18 1.665 0.755
Lean management 10 2.86 0.395 0.800
Time 3 4.39 1.637 0.757
Knowledge 4 3.92 1.034 0.634
[image:32.595.71.484.522.722.2]Money 4 3.84 1.302 0.651
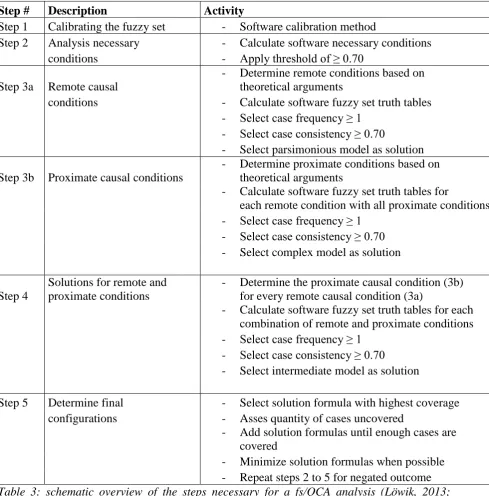
32 The table below shows an schematic overview of all the steps which were taken in this
fs/QCA analysis of Ragin (2008). It describes what is happening in each step through which
activities. The table is taken from Löwik (2013) and based on Devers et al. (2013).
Step # Description Activity
Step 1 Calibrating the fuzzy set - Software calibration method
Step 2 Analysis necessary - Calculate software necessary conditions
conditions - Apply threshold of ≥ 0.70
Step 3a Remote causal
- Determine remote conditions based on theoretical arguments
conditions - Calculate software fuzzy set truth tables
- Select case frequency ≥ 1
- Select case consistency ≥ 0.70
- Select parsimonious model as solution
Step 3b Proximate causal conditions
- Determine proximate conditions based on theoretical arguments
- Calculate software fuzzy set truth tables for
each remote condition with all proximate conditions
- Select case frequency ≥ 1
- Select case consistency ≥ 0.70
- Select complex model as solution
Step 4
Solutions for remote and proximate conditions
- Determine the proximate causal condition (3b) for every remote causal condition (3a)
- Calculate software fuzzy set truth tables for each combination of remote and proximate conditions
- Select case frequency ≥ 1
- Select case consistency ≥ 0.70
- Select intermediate model as solution
Step 5 Determine final - Select solution formula with highest coverage configurations - Asses quantity of cases uncovered
- Add solution formulas until enough cases are covered
- Minimize solution formulas when possible
- Repeat steps 2 to 5 for negated outcome
[image:33.595.73.563.142.639.2]33 4.2 Step 1: calibration
Calibration of a data set is essential in performing a fs/QCA. In the first part of the analysis no
calibration had been used yet, these were just the uncalibrated results which were acquired
through the survey. The calibrating of the data set is giving a meaning to the answers which
are given by the participants in this research, a ratio or interval variable will be transformed
into a fuzzy set using this method. The values of the conditions need to be transformed into
numbers which need to be anywhere in between 0 and 1. 0 means the answer is not applicable
at all in the organization and when the answer is 1 it means falls into the category of fully
applicable within the business (Ragin, 2000). It is possible to use uncalibrated fuzzy sets but
these are inferior to calibrated fuzzy sets (Ragin, 2008).
In this research the calibrating technique which is offered by the fs/QCA 2.0 software (Ragin,
2008) is used. The data acquired in this research are fluid and can take any number in between
0 and 1. It’s a so-called “continuous” fuzzy set (Ragin, 2008). Due to the continuous character
of the set the three thresholds for the calibration were set at the percentiles of 25%, 50% and
75%. Values are distributed normally, this means 0 is no membership while 1 is full
membership (Ragin, 2008). Up to the first quarter is set as full non-membership while the top
quarter is full membership. The thresholds for the percentiles are shown in the table in the
next chapter.
4.2.1 Conditions
Setting frequency and consistency thresholds refine the data which can be produced in a truth
table in the fs/QCA programme (Ragin, 2008). In frequency thresholds it is shown to what
extent the combinations of the different factors in this research are also empirically existent
(Leischnig et al., 2014). A cut-off point for the frequency threshold ensures that a minimum
of observations also occur. A cut-off frequency point of 1 is recommended by Ragin (2008)
and will be used in this study as well.
The second condition is the consistency threshold. The consistency threshold is the degree to
which the outcome is sufficient according to the combination of conditions used in the test
(Schneider and Wagemann, 2002). A cut-off point for consistency of 0.70 is suggested. This
cut-off point is lower than the 0.75 or 0.90 which is used in other studies but a lower cut-off