On-premise to SaaS Integration Risk Mitigation
Stijn Vorstenbosch
"I promise nothing complete; because any human thing supposed to be complete,
must for that very reason infallibly be faulty."
Master's thesis Business Information Technology
Faculty of Electrical Engineering, Mathematics, and Computer Science &
Faculty of Management and Governance University of Twente
(Alongi, 2008)
A framework to gain insight in the risks, and recommend
mitigation strategies, specific to on-premise to SaaS integration
Utrecht, February 2015
Author
Name: Stijn Vorstenbosch
Email: [email protected] Student number: s0169021
Supervisory committee
Internal supervisors Dr. Ir. Maya Daneva
Prof. Dr. Jos van Hillegersberg
External supervisor Rosanne Sigmans Managing consultant
Deputy Clustermanager Fusion Technology J41
PO Box 217 7500 AE Enschede
the Netherlands +31 534 89 91 11
[email protected] www.utwente.nl
MANAGEMENT SUMMARY
Large software systems, such as Enterprise Recourse Planning (ERP) systems, are considered notoriously hard to implement successfully. After years of experience in practice and scientific research towards critical success factors, organization impact, and economic impact only a small number of large implementation projects is a success. This research contributes to the definition of solution strategies to this challenge in order to increase the success rate of large implementation projects by addressing a small and new piece of the puzzle: Software-as-a-Service (SaaS) integration for ERP. The research has been specifically scoped to answer the following research question:
What are the risks specific to on-premise to SaaS integration and mitigation strategies to reduce these risks?
Integration between an on-premise ERP system and a SaaS solution results in a unique set of
integration dynamics when compared to the more traditional integration scenarios such as on-premise to on-premise or on-premise to hosted. The difference is fundamentally grounded into two
characteristics: ownership of the software and whether or not the integration crosses organizational boundaries. These two characteristics of ‘on-premise to SaaS’ integration provide insight in the specific integration risks that can be encountered.
To answer the research question we have adopted a multi-method research approach combining an explorative literature search, a rigorous systematic literature search, interviews with experts from practice and a workshop. By investigating the key drivers to ERP-as-a-service adoption and designing an integration risk factor framework, we have explicated multiple risks and formulated numerous mitigation strategies. The joint application of all research methods resulted in 36 specific on-premise to SaaS integration risks and 29 strategies to mitigate these risks. The 36 risks have been clustered into 12 overarching risk themes. These resulting themes are: complexity, compliancy, integration, support, security, release planning, change requests, system performance, maintainability, development costs, data confidentiality & integrity and user adoption. All these themes represent two different
perspectives covering the same risk set. The perspectives have been compared and the themes have been matched to mitigation strategies that reduce the specific risk theme.
We have concluded that integration between an on-premise ERP system and a SaaS solution is not a new technical challenge, but rather more a governance-oriented matter. Drawing upon this conclusion we argue that it is not just a matter of orientation, but that governance becomes more important and complex due to the unique dynamics of on-premise to SaaS integration. This, in turn, leads to the hypothesized claim that when a SaaS solution is truly embedded in the application landscape of a client organization, the costs savings made by avoiding initial investments costs are reduced due to the increased integration effort. This weakens many statements claiming SaaS solutions are considered cheaper than the tradition on-premise system.
Furthermore, the themes revolving around change, maintainability, development, performance, integration support and security consist of a relatively high number of risks in comparison with the mitigation strategies that we found. Creating a dedicated role for overseeing SaaS integrations, using a canonical model, having SaaS ready on-premise architecture, setting up (WSDL) service contracts in a smart way, making use of dev-ops teams and creating back up strategies for broken interfaces are considered to be the most versatile mitigation strategies. Testing the SaaS, in particular regarding its non-functional requirements, before use is considered to be the most cost-effective mitigation strategy found.
model. This understanding provides a powerful reasoning tool considering these types of integrations for both practitioners and researchers.
While we have identified numerous risks and mitigation strategies, we have not collected data on the probability and impact of the risks and mitigation strategies. This is necessary to make quantitatively substantiated claims concerning the impact of risks or the potential of mitigation strategies. We have also concluded that for every different integration environment, which includes the organization that uses the integration, the laws and standards they have to uphold, the application and infrastructure landscape including integration targets and the integration technologies used, the probability and impact of risks and the potential mitigation strategies can differ.
ACKKNOWLEDGEMENTS
This document marks the end of my time as a student at the university of Twente. In the following pages I present the results of my final project as a student, but before I do that I want to take a moment and reflect on my journey as a student.
My journey started in 2007 when I decided that studying Business and IT was the logical next step, but in retrospect you could also state I was lacking any real plans. Due to my ‘decision’ I tumbled down a hole that would even impress Alice herself. During my tumble I have met the most amazing people, embarked on countless adventures and even learned a thing or two about business and IT. Without these experiences I would not have been half the man I am today.
Writing this graduation thesis gave me the opportunity to use all these experiences to test my mettle in the ‘real world’. During my project I learned much about working in a professional environment, IT consultancy, cloud computing, project management, and arguably most importantly: myself. Still it would be unfair to accept any credits for my work without mentioning a few people who have helped me during this project. First, I would like to thank Rosanne, my supervisor at Capgemini. Rosanne, it was a great pleasure working with you. You truly were my ‘tour guide’ during my stay at Capgemini. You are kind, smart and always ready to help. Your contributions to finding the right interviewees were invaluable. Furthermore I would like to thank my supervisors from the university of Twente. Maya, you are an awesome motivator and your contributions to my research design pushed my thesis to a higher level. Jos, your critical assessment of my work and creative mind meant sparring sessions with you always got me unstuck.
I also want to thank all other colleagues that helped me during my project and made my time at Capgemini unforgettable. I always went home with a positive feeling and healthy motivation to give my best the following day. Special mentions are deserved for the colleagues that were involved in exploring potential research subjects, took the time to answer my questions during the interviews and attended or helped organize my workshop.
Besides the people that helped me write my graduation thesis I would also thank my family and friends for providing me with much needed relaxation. I am lucky to say that you are too numerous to mention all by name and I hope you will be just as present in my next journey as you were in this one.
Last but not least I want to thank Alina for putting up with me all these years and thank my parents for their unlimited support and love. You kept faith and allowed me to experience life to the fullest even at times when the progress I made was not represented by passing exams. Without you my achievements would not have been possible.
Stijn Vorstenbosch
TABLE OF CONTENTS
Management summary ... 1-2
Ackknowledgements ... 1-4
Table of contents ... 1-5
List of Figures ... 1-8
List of tables ... 1-10
1 Introduction ... 1-10
1.1 Capgemini ... 1-10
1.2 Motivation ... 1-11
1.3 Problem description ... 1-12
1.4 Research scope ... 1-13
1.5 Research goal ... 1-13
1.6 Research questions ... 1-13
2 Research approach ... 2-14
2.1 Explorative literature research ... 2-15
2.2 Systematic literature research ... 2-15
2.2.1 Search terms ... 2-15
2.2.2 Search toolS ... 2-16
2.2.3 Inclusion and exclusion criteria ... 2-16
2.2.4 Validity ... 2-17
2.2.5 Search process ... 2-17
2.3 Semi-structered interviews ... 2-17
2.3.1 Interview plan ... 2-18
2.3.2 Data Collection & analysis ... 2-19
2.3.3 Validity ... 2-21
2.4 Workshop ... 2-21
2.4.1 Workshop plan ... 2-21
2.4.2 Data collection and analysis ... 2-23
3 Drivers AND Barriers of ERP-as-a-serice adoption ... 3-24
3.1 Cloud computing ... 3-24
3.2 Enterprise Recourse Planning (ERP) ... 3-26
3.3 ERP-as-a-service ... 3-27
3.4 Drivers and barriers of ERP-as-a-service adoption ... 3-27
4 Factors influencing integration risks ... 4-30
4.1 Integration scenarios ... 4-30
4.1.1 ERP delivery models ... 4-30
4.1.2 ERP integration ... 4-32
4.2 Integration RISK level ... 4-36
4.2.1 Integration ... 4-36
4.2.2 Technical integration risk levels ... 4-37
4.2.3 Network connectivity ... 4-37
4.2.4 Data sharing ... 4-37
4.2.5 Application interoperability ... 4-37
4.2.6 Process coordination ... 4-38
4.2.7 integration governance ... 4-38
4.3 Application type ... 4-38
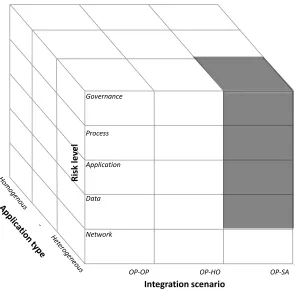
4.4 Conclusions from explorative research ... 4-39
4.5 Feedback on the integration factors framework ... 4-41
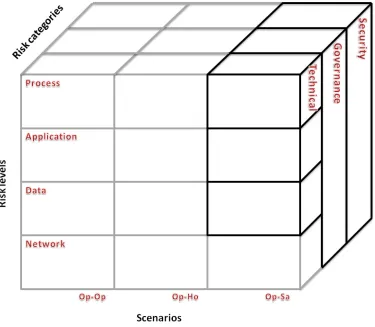
4.6 Changes made to the integration factor model ... 4-42
5 Risks and mititagation strategies ... 5-44
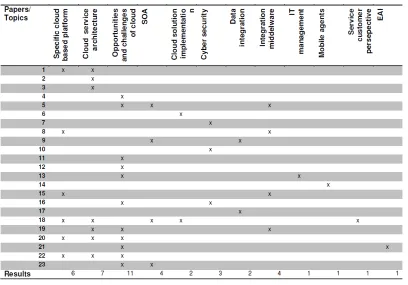
5.1 Findings from the scientific community ... 5-44
5.1.1 Risk found ... 5-45
5.1.2 Mitigation strategies found ... 5-46
5.2 Findings from experience experts ... 5-47
5.2.1 Risks found ... 5-47
5.2.2 Mitigation strategies found ... 5-50
5.3 Combination of views ... 5-52
6.1 VennMaster ... 6-54
6.2 User IT organisation perspective ... 6-55
6.3 Integration cost perspective ... 6-56
6.4 Themes and mitigation strategies ... 6-57
6.4.1 Complexity ... 6-57
6.4.2 Integration ... 6-58
6.4.3 Compliancy ... 6-59
6.4.4 Security ... 6-60
6.4.5 Release planning ... 6-61
6.4.6 Change requests ... 6-62
6.4.7 Support ... 6-63
6.4.8 System performance ... 6-64
6.4.9 Data Confidentiality & integrity ... 6-65
6.4.10 Maintainability ... 6-66
6.4.11 Development costs ... 6-67
6.4.12 User adoption ... 6-68
6.5 mitigation strategies ... 6-69
6.6 Integration factor framework risk mapping ... 6-71
6.7 Overview and validation ... 6-72
7 Conclusion ... 7-74
7.1 Discussion, implications and limitations ... 7-76
7.2 Recommendations ... 7-78
8 Future research ... 8-80
9 References ... 9-81
Appendix A. Overview of Research Approach ... 86
Appendix B. Mitigation strategies and risks ... 87
LIST OF FIGURES
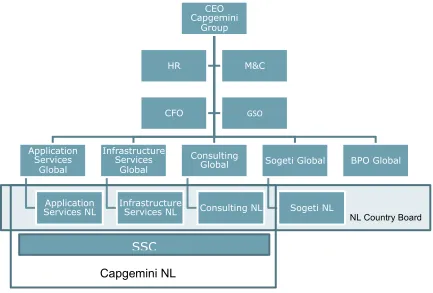
Figure 1: Overview Capgemini Group (“Capgemini,” 2014) ... 1-11
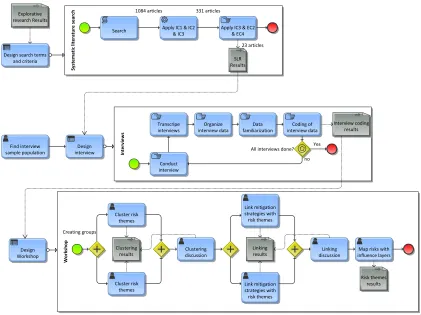
Figure 2: Visual representation of overview of research approach ... 2-14
Figure 3: Visual representation of the systematic literature research process ... 2-15
Figure 4: Search terms ... 2-17
Figure 5: Visual representation of the interview process ... 2-20
Figure 6: Screenshot of coding done in QDA miner lite ... 2-20
Figure 7: Visual representation of the workshop process ... 2-23
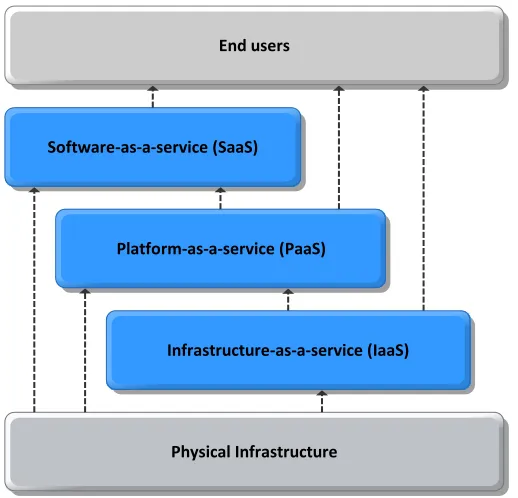
Figure 8: Cloud computing service model categories (Pearson, 2012) ... 3-25
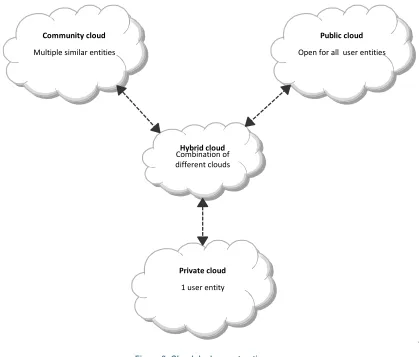
Figure 9: Cloud deployment options ... 3-26
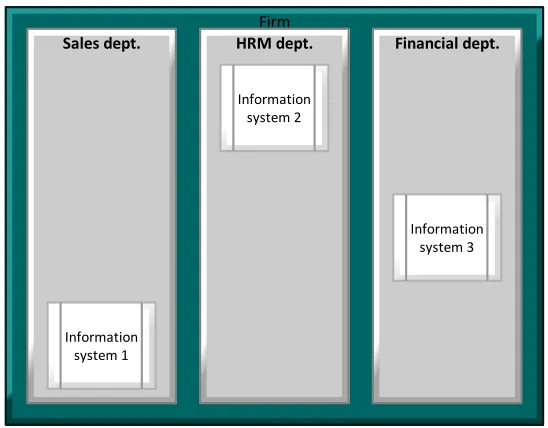
Figure 10: Fictional company without integration ... 4-33
Figure 11: Fictional company with integrated information systems ... 4-34
Figure 12: Fictional company with a hosted ERP system ... 4-34
Figure 13: Fictional company with an ERP-as-a-service module ... 4-35
Figure 14: Multi-tenancy of the ERP-as-a-service component ... 4-35
Figure 15: Five different integration levels ... 4-37
Figure 16: Integration factors framework ... 4-40
Figure 17: Integration factors framework 2.0 ... 4-43
Figure 18: Systematic literature research topic matrix ... 5-45
Figure 19: Visual representation of the risks clustering of the user IT organization perspective ... 6-56
Figure 20: Visual representation of the risks clustering of the integration cost perspective ... 6-57
Figure 21: Perspective comparison from the complexity viewpoint ... 6-58
Figure 22: Perspective comparison from the integration viewpoint ... 6-59
Figure 23: Perspective comparison from the compliancy viewpoint ... 6-60
Figure 24: Perspective comparison from the security viewpoint ... 6-61
Figure 25: Perspective comparison from the release planning viewpoint ... 6-62
Figure 26: Perspective comparison from the change requests viewpoint ... 6-63
Figure 27: Perspective comparison from the support viewpoint ... 6-64
Figure 28: Perspective comparison from the system performance viewpoint ... 6-65
Figure 30: Perspective comparison from the maintainability viewpoint ... 6-67
Figure 31: Perspective comparison from the development costs viewpoint ... 6-68
Figure 32: Perspective comparison from the user adoption viewpoint ... 6-69
Figure 33: Risk factor framework with categorization of risks ... 6-71
Figure 34: Overview of the comparison of risks perspectives ... 6-72
LIST OF TABLES
Table 1: Inclusion criteria ... 2-16
Table 2: Exclusion criteria ... 2-16
Table 3: Interview sample ... 2-18
Table 4: Interview timetable ... 2-19
Table 5: Interviews facts ... 2-19
Table 6: Transcription and coding facts ... 2-20
Table 7: Workshop sample ... 2-22
Table 8: Workshop timetable ... 2-22
Table 9: User opportunities and challenges (Juell-skielse & Enquist, 2012) ... 3-28
Table 10: Supplier opportunities and challenges (Juell-skielse & Enquist, 2012) ... 3-29
Table 11: On-premise ERP advantages (Duan et al., 2012) ... 4-31
Table 12: Hosted ERP advantages (Duan et al., 2012) ... 4-31
Table 13: ERP-as-a-service advantages (Duan et al., 2012) ... 4-32
Table 14: Application types ... 4-39
Table 15: Overview of resulting papers ... 5-44
Table 16: Integration risks found in literature ... 5-45
Table 17: Integration risk mitigation strategies from literature ... 5-46
Table 18: Risks found during the interviews ... 5-47
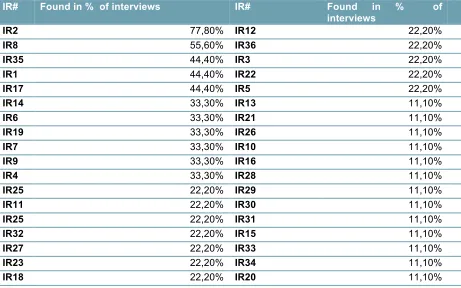
Table 19: Frequency of risks found during interviews ... 5-49
Table 20: Mitigations strategies found during the interviews ... 5-50
Table 21: Frequency of mitigation strategies found during interviews ... 5-51
Table 22: Risk themes from the user organization perspective ... 6-55
Table 23: Risk themes from integration cost perspective ... 6-56
Table 24: Perspective comparison from the complexity viewpoint ... 6-58
Table 25: Perspective comparison from the integration viewpoint ... 6-58
Table 26: Perspective comparison from the compliancy viewpoint ... 6-59
Table 27: Perspective comparison from the security viewpoint ... 6-60
Table 28: Perspective comparison from the release planning viewpoint ... 6-61
Table 30: Perspective comparison from the support viewpoint ... 6-63
Table 31: Comparison Perspective comparison from the system performance viewpoint ... 6-64
Table 32: Perspective comparison from the data confidentiality & integrity viewpoint ... 6-65
Table 33: Perspective comparison from the maintainability viewpoint ... 6-66
Table 34: Perspective comparison from the development costs viewpoint ... 6-67
Table 35: Perspective comparison from the user adoption viewpoint ... 6-68
Table 36: Analysis of mitigation strategies and risks themes ... 6-69
Table 37: Number of mitigation strategies applications according to experts ... 6-70
Table 38: Integration factor framework risks categorization ... 6-71
Table 39: Categorization of risks ... 6-72
Table 40: Key drivers and barriers for ERP-as-a-service adoption form the user perspective ... 7-74
1-10
1 INTRODUCTION
Complex software systems such as an Enterprise Resource Planning (ERP) system are a firm’s facilitators for competitive advantages. Successfully implementing a fully integrated ERP system is like having a solid foundation for distinguishing yourself from the competition. However large IT systems are rather unsung heroes these days. The news is filled with failed implementations and ICT consultancy firms are getting increasing amounts of bad publicity, especially when a project in the public sector is abandoned. A couple of months before the start of this project, “de Volkskrant” states that the Dutch government alone waste 4 to 5 billion euro on failing IT projects every year (ANP,
2014), which is estimated to cost the Dutch taxpayer an amount of €300 per capita per year.
In the third week of my research, the SVB (Sociale VerzekeringsBank) “kicked out” Capgemini according to the Dutch newspaper “de Telegraaf”, after an unsuccessful Oracle implementation
seemingly costing the Dutch tax payer roughly €50 million (van Bergen & Mos, 2014). Even
considering the fact that “De Telegraaf” is not known for their tact, and responsibility for failure of such a grand project can hardly be placed at only one stakeholder, it still does not look good on Capgemini’s rap sheet. This research sets out to reduce the failure rate of ERP software implementation projects by looking into a small and new part of the puzzle: cloud integration.
This chapter introduces the research by providing a short description of the company facilitating the project in Chapter 1.1, followed by the motivation behind the research in Chapter 1.2. Chapter 1.3 introduces the industry-relevant problem that this research deals with. Chapter 1.4 states the boundaries of this research. Chapter 1.5 presents the research goal. Finally the research questions are presented in Chapter 1.6.
1.1 CAPGEMINI
This chapter describes the company facilitating the present research. We will start by introducing the Capgemini Group and move towards the division that was the host of this research project.
The history of Capgemini is characterized by takeovers, separations and mergers, all of which makes it rather complex, therefore in this thesis we have chosen for the ‘simple’ version. To provide insight into the history of the Group we start our historic journey in 1967. The predecessor of Capgemini was founded in 1967 (SOGETTI, Grenoble) by Serge Kampf. In 1975, after acquiring both CAP and Gemini computer systems, the name changed to Cap Gemini Sogetti. Finally in 2004 the name of the firm was officially changed to what it is today: Capgemini.
“Capgemini is one of the world's foremost providers of consulting, technology, outsourcing services
and local professional services with reported revenues above 10 billion euro’s. Present in over 40 countries with almost 140,000 employees, the Capgemini Group helps its clients transform in order to
improve their performance and competitive positioning” (“Capgemini,” 2014).
1-11
Figure 1: Overview Capgemini Group (“Capgemini,” 2014)
The part of the Oracle division the main researcher was an intern of was named J41 Oracle Solutions and is occupied with both providing Oracle technology solutions and Oracle application solutions. In total these two clusters account for about 160 consultants backed up by a number of staff people.
At the home base of J41 at Reykjavikplein 1 in Utrecht there were an average of 15 colleagues present at any given time during my stay. The less the number of people around, the better for the business, as those colleagues who were not at the office, were most likely working at the clients’ sites. The consultants on the so-called ‘bench’ were utilizing their networks in order to find new assignments, or improving and broadening their skills set by taking courses from one of the Capgemini learning environments.
1.2 MOTIVATION
ERP systems are among the largest, most complex, and most demanding information systems implemented by firms (Grabski, Leech, & Schmidt, 2011). ERP systems are considered companywide information systems that integrate all aspects of business. This means that an ERP system can cover everything from human resources, manufacturing, accounting, sales, distribution, management support and anything in between. The advantages of such an integrated system for firms are many fold, i.e. quicker reactions to competitive pressures and marketing opportunities, reduced inventories, ability to comply with regulations, and achieving a more efficient workforce (Bingi, Sharma, & Godla, 1999). The first ERP systems were introduced in the 80s and from that point ERP has been a focal point for both the scientific world and the workplace. Although the advantages these systems are renown, the process of actually achieving them could be called notorious. The scientific community has undertaken numerous studies into ERP systems that can be roughly placed into three categories: critical success factors, organizational impact, and economic impact (Anwar, 2011; Grabski et al., 2011). Due to the attention received, the research towards ERP quickly matured, but the results in the
CEO Capgemini
Group
Application Services
Global
Application Services NL
Infrastructure Services
Global
Infrastructure Services NL
Consulting Global
Consulting NL
Sogeti Global
Sogeti NL
BPO Global
HR M&C
CFO GSO
NL Country Board
Capgemini NL
1-12
field could be called under par (Aloini, Dulmin, & Mininno, 2007). When one looks into an everyday newspaper there is bound to be an article about some ERP project that went over budget, took longer than expected, or was abandoned entirely. From this perspective, the basis of my motivations stems to improve the success rate of ERP projects.
1.3 PROBLEM DESCRIPTION
Improving the success rate of large IT projects such as ERP projects is an ambitious goal to strive for, but taking on 35 years of research and experience in practice during a 6 month project could be called lunacy. However the field of ERP is changing due to new technologies and new business models. These changes present new opportunities for further research into the field of ERP, or large implementation projects in general, that for now remain under-researched. One of the changes that is particularly visible within Capgemini is cloud computing. Where once ERP systems were heavy on-premise systems that required high initial investments in both hardware and software, ERP systems are gradually becoming lighter and are offered as SaaS (Software As A Service) solutions. These lightweight ERP implementations, operating from the cloud are called ERP-as-a-service. This change opens up a variety of possibilities for SMEs (Small Medium Enterprises) and for LEs (Large Enterprises) alike. Research on this topic is limited and researches have called for research towards the implementation, use, and risks in this new environment (Grabski et al., 2011).
When firms buy an ERP-as-a-service module, i.e. Oracle CRM on demand, many challenges are to be overcome in order to achieve the full advantages of the SaaS solution. Studies have been done towards these challenges of ERP-as-a-service (Juell-skielse & Enquist, 2012; Lechesa, Seymour, & Schuler, 2012; Lewandowski, Salako, & Garcia-Perez, 2013), but in-depth research towards specific challenges found by them is close to non-existent.
Integration challenges in particular are said to be one of the major barriers of ERP-as-a-service adoption (Addo-Tenkorank & Helo, 2011; Araujo, Vázquez, & Cota, 2014; Benlian & Hess, 2011; Dubey & Wagle, 2007; Juell-skielse & Enquist, 2012; Kolluru & Mantja, 2013; Lechesa et al., 2012; Lewandowski et al., 2013; F. Liu, Guo, Zhao, & Chou, 2010; Schubert & Adisa, 2011; Themistocleous, Irani, O’Keefe, & Paul, 2001; Vassiliadis, Stefani, Tsaknakis, & Tsakalidis, 2006).
While integration on a technical and architectural level is an important key to the puzzle, integration is also an important factor on management level as it is said to be responsible for 30%-45% of the costs of an ERP-as-a-service implementation (Bernstein & Haas, 2008; Hai & Sakoda, 2009).
From an explorative study the following conclusions can be made about the research field:
• There is no clear overview of cloud integration risks;
• It is unclear how to mitigate cloud integration risks;
• Some technical solutions are proposed for specific integration problems (i.e. Liu et al., 2010;
Liu, Wang, Chou, Fazal, & Li, 2006);
• Studies towards SaaS integration “best practices” exist, but research has not gone further
than high level guidelines (Hai & Sakoda, 2009; Kolluru & Mantja, 2013);
Resulting from these conclusions we define the following problem statement:
1-13
1.4 RESEARCH SCOPE
In order to arrive at a manageable research within the time span given for this project the following scoping decisions have been made:
• The research is positioned within the Oracle division at Capgemini in the Netherlands. The
experience gathered from practice will originate from the Capgemini group and mainly from the Oracle community at Capgemini.
• The research will focus solely on integrating SaaS with on-premise systems. The reason for
this decision is based on two arguments. Compared to cloud-to-cloud integration this type has the potential to be more challenging. Secondly, it is also more common in practice as many clients from IT consultancy firms are still using on-premise ERP systems and buy cloud solutions as add-ons.
1.5 RESEARCH GOAL
In Chapter 1.3 we have described the challenges in the current field of ERP research, specifically towards SaaS integration challenges. In order to provide more clarity in this emerging field we have defined the following research goal:
Develop a framework in order to gain insight in the risks, and recommend mitigation strategies, specific to integrating on-premise to SaaS systems.
1.6 RESEARCH QUESTIONS
In Chapter 1.5 we have stated a research goal that stems from the research problem discussed in Chapter 1.3. The following research question is a result of that goal.
What are the risks specific to on-premise to SaaS integration and mitigation strategies to reduce these risks?
In order to divide this main research question into manageable pieces we defined five sub-questions.
I. What are the drivers and barriers of ERP-as-a-service adoption in Small and Medium-sized
enterprises (SMEs) and Large Enterprises (LEs)?
II. What factors influence information system integration risks?
III. What on-premise to SaaS integration risks and mitigation strategies have been identified by
the scientific community?
IV. What on-premise to SaaS integration risks and mitigation strategies have been identified by
experience experts working in the field of ERP and SaaS?
V. Are the proposed risks and mitigation strategies useful in order to improve the
ERP-as-a-service implementation success rate in practice?
2-14
2 RESEARCH APPROACH
To answer the questions presented in Chapter 1.6 we use a number of different research techniques. In this chapter we describe how we approached the research and what methods we have used in order to collect data required to answer the research questions. We will also discuss how we analyzed the data and argue on the validity of the different research methods.
[image:18.595.89.510.286.601.2]During the design of our research we have specifically looked into combining multiple research methods to triangulate our data sources. According to Creswell (2003), this strategy probably originates from 1959 when the first multi-method research took place. Because all research methods have their limitations, scientists used multiple methods to counteract biases that are present in any single method. For this reason we have decided to use an explorative literature search, a systematic literature search, interviews and a workshop to gather our data in the most unbiased fashion. A visual representation of the complete research design is presented in the figure below, the full-scale version can be found in Appendix A.
Figure 2: Visual representation of overview of research approach
In Chapter 2.1 we elaborate on the explorative literature research into the field of ERP and SaaS integrations that is used to answer research questions I and II. Chapter 2.2 explains the approach on the systematic literature research used to answer research question III, followed by the plan used to conduct interviews in order to provide the beginning of the answer of to research question IV. To complete the answer on research question IV we conducted a workshop. The workshop also provides an answer to research question V and its approach can be found in Chapter 2.4.
Sy st em at ic lit er at ur
e s
ea
rch
Search Apply IC1 & IC2& IC3 Apply IC3 & EC2& EC4
SLR Results 1084 articles 331 articles
23 articles Design search terms
and criteria Explorative research Results
Find interview
sample population interviewDesign Inte
rvie w s Conduct interview Transcripe
interviews interview dataOrganize familiarizationData interview dataCoding of
Interview coding results
no All interviews done? Yes
Wo rk sh op Design Workshop
Cluster risk themes
Link mitigation strategies with risk themes
Clustering
results Linkingresults
Risk themes results Creating groups
Cluster risk
themes Link mitigationstrategies with risk themes
Map risks with influence layers Clustering
2-15
2.1 EXPLORATIVE LITERATURE RESEARCH
The explorative literature research has been conducted using Scopus, Google Scholar, and papers shared by supervisors and other researchers. We used the research to explore the scientific field of ERP, ERP-as-a-service, cloud computing, Enterprise Application Integrations (EAI) and software integrations general. Besides exploring the fields mentioned above we have also used the knowledge gained as a starting point for our in-depth research. The two research questions we answered during this phase can be considered a preliminary part of the research, the so-called foundation from which we dived deeper into the field of on-premise to SaaS integration.
2.2 SYSTEMATIC LITERATURE RESEARCH
In order to provide a complete unbiased overview of the on-premise to SaaS integration risks and mitigation strategies known in the scientific community, we conducted a systematic literature research. We have explicitly chosen to use a systematic literature research to capture all that is known on the subject.
“A systematic literature research is a means of identifying, evaluating and interpreting all available
research relevant to a particular research question, or topic area, or phenomenon of interest”
(Kitchenham, 2004). By using a structured protocol, as identified by Barbara Kitchenham, we can provide a literature search that is thoroughly and unbiased. It provides insight in the decisions made by the researcher, so that other researchers can approach the same challenge differently or reproduce the results in order to validate.
This chapter will be divided into different parts, representing the literature review protocol. The protocol consists of search terms, search tools used, and inclusion and exclusion criteria.
Figure 3: Visual representation of the systematic literature research process
2.2.1
SEARCH TERMS
In order to find useful results the following search term has been used: cloud OR saas OR “cloud ERP”
OR “ERP-as-a-service” OR “ERP as a service”) AND integration AND (risk* OR barrier* OR disadvantage* OR
challenge* OR problem*). We have explicitly decided not to search for on-premise to SaaS integration as
the combination SaaS and on-premise has not been widely used and considering the maturity of this research niche chances are we miss interesting studies. Another explicit decision that was made regarding the search terms was to withhold the sought after mitigation strategies from the actual search query as we argue that the field is in such a immature state this would lead a very small results pool. We will have a greater chance extracting the mitigation strategies from the studies in which risks have been identified.
Sy
st
em
at
ic l
iter
at
ur
e sea
rch
Search Apply IC1 & IC2 &IC3 Apply IC3 & EC2& EC4
SLR Results 1084 articles 331 articles
23 articles
Design search terms and criteria
2-16
2.2.2
SEARCH TOOLS
To find the best sources for the literature review we will use the Scopus search engine. Scopus distinguishes itself from the likes of Google scholar by providing strong tools for a thorough literature search. Although Google Scholar covers a wider variety of publications, it lacks important sources and has a high amount of search “noise” (Mikki, 2009). However, we are limited to the university of Twente library and Google Scholar is known to provide a greater possibility to find full texts (Mikki, 2009). We therefore use scholar to help us find full text of studies that we cannot access through Scopus.
2.2.3
INCLUSION AND EXCLUSION CRITERIA
In order to acquire a very specific and high quality subset of all papers resulting from the search query, inclusion and exclusion criteria have been deployed. The inclusion criteria govern the quality of a paper and whether or not it is relevant.
Table 1: Inclusion criteria
# Inclusion criteria Reasoning
IC1 Results must be a reviewed scientific article or a conference paper
Quality constraint for the input (handled by Scopus)
IC2 The subject area of the research is “computer science, social sciences and business & management”
Filtering out unwanted subject areas that cannot be applied within this research (handled by Scopus)
IC3 Results must have cloud-to-on-premise integration risks or mitigation strategy as a topic
Filtering out studies that do not discuss cloud-to-on-premise integration (handled manually)
The exclusion criteria provide boundaries, limiting the result pool on time of publishing, presence in the Twente University library and generally making sure no unnecessary work is done. An overview of the criteria can be found in Table 1 and Table 2.
Table 2: Exclusion criteria
Exclusion criteria Reasoning
EC1 Results must be from 2009 or more recent
The field of computer science and especially cloud computing is rapidly evolving. This constraint filters out old research that is no longer applicable (handled by Scopus)
EC2 The result is not available through the University of Twente library or via Google Scholar
This research will be conducted as part of a graduation thesis, therefore no funding is present to acquire papers that are not obtainable via the given sources (handled manually)
EC3 The older or longer case of multiple results on the same topic by the same author
To prevent doubling the work effort while the gains are minimal (handled manually)
EC4 The paper is not available in English
We are only able to interpret English studies (handled manually)
2-17
Figure 4: Search terms
2.2.4
VALIDITY
In order to provide an unbiased and validated literature research we take validity measures into account. The first remark we want to make is that neither the main researcher nor his supervisors have conducted any significant research into the cloud integration field. This provides a clean sheet and unbiased view on the research field. Secondly, the inclusion and exclusion criteria that are not automatically supported by the used search tool will be checked by the main researcher. An internal validity check will be provided by a supervisor by applying the same manual criteria as the main researcher did on a subset of the raw results.
2.2.5
SEARCH PROCESS
When the search query was entered raw into Scopus on 7-10-2014, before any automated inclusion or exclusion criteria were taken into account, 1084 results were returned. After including the automated criteria as described in Chapter 2.2.3, 753 papers were excluded. The remaining 331 papers passed through our manual criteria based on abstracts, resulting in another 308 papers being excluded. The remaining 23 papers were analyzed in-depth and results are presented in Chapter 4. During the search process we have applied a snowballing technique to find more relevant papers by looking at the references of the resulting papers.
2.3 SEMI-STRUCTERED INTERVIEWS
Due to the perceived immaturity of the research towards cloud integration risks we have decided to use experts from practice to provide us with participatory knowledge claims. In this case, the experts will be senior implementation consultants (ranging from technical to more business-like roles) working at Capgemini. According to Creswell (2003), using open-ended questions fits with the quest for participatory knowledge claims, due to the explorative nature of the research. This fit is supported by Esterberg (2002) as she argues that semi-structured interviews allow the researcher to gather data about topics or phenomena we did not know interested us. Although we have some idea of what the risks of cloud integration will be, the field is in such an immature state that it is not wise to structure the interviews too rigidly and miss new perspectives. Results of the semi-structured interviews can be found in Chapter 5.2.
2-18
2.3.1
INTERVIEW PLAN
The first step towards data gathering through semi-structured interviews is to find a sample of people that can give the data that is needed for the research. The population we were interested in are senior implementation consultants that are experts on the topics of integration in general and SaaS solutions or a leading expert on one of the two topics. To arrive at a sample frame we have used expert sampling. This is a technique where respondents are chosen in a non-random manner based on their expertise that is necessary for the specific research subject (Bhattacherjee, 2012). The sampling frame was selected with the aid of the internal supervisor at Capgemini. Table 3 summarizes the data about our sample.
Table 3: Interview sample
Interviewee #
Project scenario Project role
I1 Using Salesforce to try out a new project Solution architect
I2 Salesforce integration with multiple
on-premise systems
Data architect
I3 Migrating from an on-premise application
to a SaaS component
Lead architect
I4 Migrating and standardizing multiple
applications into a SaaS component
Lead governance
I5 Integrating legacy systems through a bus
with a SaaS
Integrator
I6 Integrating multiple application using the
Oracle Fusion middleware stack
Solution architect
I7 Integrating a Salary SaaS component with
PeopleSoft ERP
Solution architect
I8 Integrating a HR SaaS component with
on-premise ERP
Integration specialist on the application level
I9 Salesforce integration with on-premise
ERP
Solution architect / Lead developer
When deciding how to design the interview-based research, we used our systematic literature research as a guide for creating the interview script. We knew beforehand that the scientific niche on integration risks and mitigation strategies of this particular type of integration was not a very mature field but after the literature research we made the following conclusions: First, we argue that the results of the literature study can be called only partially complete and therefore we need to find more risks instead of just trying to get them verified in the interviews. Secondly, we noticed that the scope of the sought after risks and mitigation strategies had to be made very clear in order to prevent discussing more general integration risks during the interviews. Table 4 shows the timetable for the interviews.
2-19
relatively unstructured part in which the interviewee was encourage to come up with as much risks and mitigation strategies as possible. The researchers aim was to keep the information flow going, and diving into mentioned risks or strategies if the interviewee remained too abstract.
Table 4: Interview timetable
2.3.2
DATA COLLECTION & ANALYSIS
In order to guide us through the large amount of work and avoid potential pitfalls we have used available guides on qualitative analysis (Dierckx de Casterlé, Gastmans, Bryon, & Denier, 2011; Lacey & Luff, 2009). According to these works, collecting and coding qualitative data revolves around 5 major steps; transcription, organizing data, familiarization, coding, and themes. This chapter covers these steps in order to give full insight in the data collection and analysis process.
The recordings made during the interviews were used for transcription. We have decided to start with transcribing from the start of the ‘interactive’ part of the interview, referred to in the timetable as ‘finding a suitable project and role’ and stop transcribing at the concluding remarks in order to safe valuable time. However Dierckx de Casterlé et al., (2012) argue that this can create biases in the collected data, therefore we have strayed from this norm if we encountered feedback or other interactions from the interviewee during the ‘non-interactive’ parts of the interviews. We have transcribed all words of the interviews but not the non-verbal cues. We acknowledge that these cues can provide valuable insights but we have ignored them due to time constraints. The audio files of the interviews have been transcribed on the same day or on the day after the interviews to avoid the possibilities for misunderstandings in case of background noises or heated discussion. Although almost all interviews were conducted in private rooms, this tactic proved useful as it was rather remarkable to notice how conversations are sometimes incomplete or unclear when listening to recordings of these conversations afterwards. The organization of data was mainly done by the coding software used and digital storage facilities. We argue that more rigorous methods of organization, i.e. making the transcribed interviews anonymous, were not necessary due to the small scale project and the lack of negative consequences for the interviewees. As all of the work was done by a single researcher data familiarization has occurred rather easily by listening to the audio files once before transcribing and during the transcribing process. Facts on the interviews and transcribing can be found in Table 5.
Table 5: Interviews facts
Time period used for interviewing From 27-10-14 until 20-11-14
Number of interviews 9
Total interview time (in minutes) 474
Amount of words transcribed (including headers)
54092
Average interview time (in minutes) 53
Average amount of words transcribed per interview
6010
Subject Time
Introduction 2-3 minutes
Explanation of the integration framework 5 – 10 minutes
Finding a suitable project and role 5 - 10 minutes
Finding risks and mitigation strategies 20-30 minutes
Concluding remarks 2-3 minutes
2-20
In order to retrieve valuable information from the data, we have extensively coded the transcriptions. We have used an open coding strategy to code all risks and mitigation strategies that we collected. A logical next step would have been to look for categories of the codes and work towards higher level themes but due to the research set-up of having interviews combined with a workshop we have excluded this step. The clustering of risks will be done by the experts, in group work, in order to avoid any biases.
Table 6: Transcription and coding facts
Amount of words transcribed (including headers) 54092
Amount of different codes 127
Amount of coded text fragments 291
Amount of words coded 18980
Percentage of words coded 34,80%
In order to extract all the data from the interview transcription, we have coded the files. In Table 6 we have presented some interesting coding facts. The coding has been done using a freeware coding application called QDA Miner Lite (www.provalisresearch.com). An overview of the entire interview process is depicted in Figure 5.
Figure 5: Visual representation of the interview process
A screenshot of how the program looks like can be seen in Figure 6. The application contains different sections, including a document manager, a code manager and a part in which the actual coding is done. The same software also allows for analyzing the codes created within the application in order to draw conclusions. I.e. all found risks can be presented in a table or diagram allowing the researcher to quickly find the segments of text that represent the found risks, the found risk can be checked on frequency of occurrence either in one transcription or in the set of all transcriptions. The coding is done by highlighting parts of the transcription and giving it a pre-defined code or creating an entirely new code for it. These codes can be grouped in order to provide a quick overview and can be used to manage all the highlighted pieces of the transcription.
Figure 6: Screenshot of coding done in QDA miner lite
Find interview sample
population Design interview
SLR results
In
ter
vi
ew
s
Conduct interview Transcripe
interviews interview dataOrganize familiarizationData interview dataCoding of
Interview coding results
no
2-21
2.3.3
VALIDITY
To successfully argue that our findings from the interviews reflect reality, a number of validity measures have been taken into account. First, we have followed methodological literature on qualitative research (Dierckx de Casterlé et al., 2011; Lacey & Luff, 2009) in order to provide for a solid research approach and design for analysis. Secondly, we have used the different interviewees to check for deviant cases in order to test our interpretations. This process can be seen as part of respondent validation which is widely acknowledged as an improvement to the rigorousness of research (Lacey & Luff, 2009). Thirdly, we have guarded heavily for allowing too much interpretation during the coding process and tried to approach the data in an ‘as-is’ fashion as much as possible. Fourthly, we argue that the group of interviewees, while working at the same company, can be seen as diverse. Capgemini is a large company and just a small portion of the interviewees knew each other by name or had worked together in the past. At the time of the interviews all interviewees were operating on different projects. This was conductive to ensure triangulation in order to allow a more complete perspective on the research subject (Lacey & Luff, 2009).
Besides mentioning the validity measures we took in order to obtain valid results, we argue that it is fair to state the inherent weaknesses of our qualitative research approach. The first and foremost weakness is the fact that the qualitative data analysis of the interviews has been undertaken by only one researcher. Without having multiple researchers analyzing the data individually it is impossible to state if the findings are consistent, this often is referred to as inter-rater reliability (Lacey & Luff, 2009). The second inherent weakness lies in the respondent validation earlier stated to have a positive effect on the validity of the analysis of the interviews. Checking for deviations increases the validity but also the risk of influencing the interviewee and thus steering the interview in a certain direction.
2.4 WORKSHOP
We decided to organize a workshop to further enhance our findings from the interviews and to avoid potential biases in the process. This enhancements comes from identifying overarching risk themes (Lacey & Luff, 2009). This identification process can be done by the researcher but in order to get a broader support for the identified themes and by doing so avoid potential biases we let the workshop attendees do the clustering for us. In this chapter we elaborate on our workshop plan and the collection and analysis of data.
2.4.1
WORKSHOP PLAN
2-22
Table 7: Workshop sample
Interviewee # Project role
I2 Data architect
I6 Solution architect
I7 Solution architect
I9 Solution architect / Lead developer
We had four goals to achieve during our workshop:
1. Find higher level risk themes
2. Link the found mitigation strategies with these themes 3. Map risks against integration framework layers 4. Validate findings
The first goal directly stems from the need to identify the risk themes. The second goal maps the found mitigation strategies against the risk themes. Such a mapping is interesting because it provides insight into which strategies can be applied to aid in mitigating what risks, but also provides information on the found set of mitigation strategies. The third goal requires the use of the integration factor model in order to find at which layer the risks are situated. This is interesting as it provides insight into the distribution of the risks amongst the different layers. Because every attendee is only responsible for a small portion of the result set, it is possible for the attendees to validate the findings from the interviews during the workshop. This will be done by addressing doubt on certain risks and mitigation strategies or adding new risks and mitigation strategies during the workshop. The timetable for the workshop is shown in the Table 8.
Table 8: Workshop timetable
Subject Time
Introduction 10 min.
Clustering of risks (2 groups) 20 min.
Discussion of clustering 15 min.
Linking mitigation strategies to risks themes (2 groups) 20 min.
Discussion of linking 15 min.
Introducing framework 2.0 10 min.
Mapping risks towards framework 20 min.
Evaluation 10 min.
Approximate total time 120 min.
2-23
phase, mapping risk towards the integration factor framework. This was done in a single group, allowing open discussion on every risk that was placed into the factor framework. Results of the workshop can be found in Chapter 6. In Appendix C the presentation used during the workshop, pictures of results and pictures of the group work can be found. An overview of the entire workshop process can be found in Figure 7.
Figure 7: Visual representation of the workshop process
2.4.2
DATA COLLECTION AND ANALYSIS
The workshop attendees have received assignment envelopes prepared for every separate workshop activity. The envelopes contained activity-specific reference material and label sheets for the final result. The workshop attendees started working on their assignment and use basic workshop tools such as post-its, block notes and markers. When the groups reached a final answer they used the labels and flip-over sheets to present their results in a unified way. These sheets were collected as data from the activities. We used photos and notes to capture and describe all other notable happenings during the workshop. The two discussions and the final categorization of risks were recorded in order to recall these parts better when conclusion were made. The sheets with raw results have been photographed and can be seen in Appendix C in combination with workshop related material.
2.4.3
VALIDATION
The most important reason for organizing the workshop was to prevent potential biases because all data analysis was otherwise done by one person. The workshop was organized and facilitated by the researcher but any interference with the activities of attendees was carefully avoided. During the starting phase of every workshop activity envelopes were handed out with all the necessary tools and background information. I.e. the envelope for workshop activity one consisted of a label sheet with all the risks and documentation on every risk. This documentation of the risks exactly matches the descriptions of the risks in this document. Because all the information needed to complete the workshop activities was handed out beforehand the researcher could remain on the background and observe without interfering.
Wo
rk
sh
op
Interview coding results
Design Workshop
Cluster risk themes
Link mitigation strategies with risk
themes
Clustering
results Linkingresults
Risk themes results Creating groups
Cluster risk themes
Link mitigation strategies with risk
themes
Map risks with influence layers Clustering
3-24
3 DRIVERS AND BARRIERS OF ERP-AS-A-SERICE ADOPTION
In this chapter we answer our first research question: what are the drivers and barriers of
ERP-as-a-service adoption? This question gives us insight in the reason behind the usage of SaaS solutions in the ERP landscape and provides an adequate starting point for this research. In order to provide a sufficient answer we first give a definition of cloud computing in general in Chapter 2.1, followed by an overview of ERP in general in Chapter 2.2. In Chapter 2.3 we combine the two definitions into ERP-as-a-service and we conclude with an overview of the drivers and barriers for ERP-as-ERP-as-a-service adoption.
3.1 CLOUD COMPUTING
The cloud in its essence a collection of IT service models, which in general can be placed into three categories: SaaS, Paas, and Iaas. In scientific literature there are other models mentioned that come forth out of the three categories i.e. CaaS, BPaas, XaaS, IaaS (Yong, Liang, & Kai, 2011) but for the purpose of this chapter we do not go into detail in all the different possibilities. Defining cloud is not an easy task because it is considered to be a strong IT hype, which results in a lot of marketing, opinions and thus different definitions. To make the situation more complex is that cloud is not a completely new thing. During interviews with experts the following was said about the situation:
“(…) there is a difference between the marketing story and what is actually happening. Cloud
computing is nothing more than hosting version 5.0. We take small steps forward all the time, but if you act like nothing happened in between it looks like an enormous change.”
The quote makes it perfectly clear that we can speak of a spectrum from classic hosted solutions to cloud solutions. Because of this large gray area within the cloud and hosted spectrum, many different definitions of what cloud computing actually is have been formed. Another reason for the wide variety of definition stems from the orientation of research. To understand the range of these definitions we have presented a subset of the definitions of cloud computing that have been found in literature below.
Yang, Wang, Liu, & Yu (2013) state that “Cloud computing is the delivery of computing as a service
rather than a product, whereby shared resources, software, and information are provided to computers
and other devices as a metered service over a network”. When looking at a research in the field of
Building Information Management (BIM), “Cloud computing is a centralized heterogeneous platform
that enables different applications to be connected to each other through using remote data servers”
(Redmond, 2012). This definition does not even seem to describe the same concept as the definition
we presented earlier. The existence of wide spread definitions of cloud computing is supported by research of Hmood & Al-Madi (2013) who found over 70 definitions of cloud computing in research.
To create clarity in this spectrum of cloud computing definitions, we have decided to adopt the essential cloud characteristics from the National Institute of Standards and Technology (NIST)
together with its definition (Mell & Grance, 2011). The NIST definition is as follows; “Cloud computing
is a model for enabling ubiquitous, convenient, on-demand network access to a shared pool of configurable computing resources (e.g., networks, servers, storage, applications, and services) that can be rapidly provisioned and released with minimal management effort or service provider
interaction”. The NIST definition has been found in the majority of literature on cloud computing and is
3-25
• On-demand self-service
“A consumer can unilaterally provision computing capabilities, such as server time and network storage, as needed automatically without requiring human interaction with each service provider”
• Broad network access
“Capabilities are available over the network and accessed through standard mechanisms that promote use by heterogeneous thin or thick client platforms (e.g., mobile phones, tablets, laptops, and workstations)”
• Resource pooling
“The provider’s computing resources are pooled to serve multiple consumers using a multi-tenant model, with different physical and virtual resources dynamically assigned and reassigned according to consumer demand. There is a sense of location independence in that the customer generally has no control or knowledge over the exact location of the provided resources but may be able to specify location at a higher level of abstraction (e.g., country, state, or datacenter).Examples of resources include storage, processing, memory, and network bandwidth”
• Rapid elasticity
“Capabilities can be elastically provisioned and released, in some cases
automatically, to scale rapidly outward and inward commensurate with demand. To the consumer, the capabilities available for provisioning often appear to be unlimited and can be appropriated in any quantity at any time”
• Measured service
“Cloud systems automatically control and optimize resource use by leveraging a metering capability at some level of abstraction appropriate to the type of service (e.g., storage, processing, bandwidth, and active user accounts). Resource usage can be monitored, controlled, and reported, providing transparency for both the provider and consumer of the utilized service”
[image:29.595.171.430.467.716.2]An overview of the cloud computing service model categories can be found in Figure 8.
Figure 8: Cloud computing service model categories (Pearson, 2012)
End users
Software-‐as-‐a-‐service (SaaS)
Platform-‐as-‐a-‐service (PaaS)
Infrastructure-‐as-‐a-‐service (IaaS)
3-26
Every service model takes the cloud principles and applies them their level in the stack. Infrastructure-as-a-service (IaaS) provides the Cloud user with hardware and infrastructure. Platform-Infrastructure-as-a-service (PaaS) is one step higher in the stack and provides a platform, such as an operating system, which offers an environment for the user to use as they wish. Software-as-a-service (SaaS) only facilitates a specific application, which can be used instantly (Buyya, Broberg, & Goscinski, 2011; Raihana, 2012; Yang et al., 2013).
[image:30.595.95.514.264.621.2]There are essentially four ways to organize your cloud; public, private, community or a hybrid form. When using a public cloud, everybody has access to the same cloud. Private means that the specific cloud has only one user. A community cloud is available for a group of users that have the same requirements. When you are using multiple forms of organizing your cloud you fit the hybrid form (Mell & Grance, 2011; Raihana, 2012). These ways of organizing is depicted in Figure 9. Other ways of organizing have been found but have been left out of this definition due to similar reasons as mentioned around the service models of cloud computing.
Figure 9: Cloud deployment options
3.2 ENTERPRISE RECOURSE PLANNING (ERP)
ERP systems are packaged business software systems that facilitate managing the efficient and effective use of resources (Aloini et al., 2007). Examples of ERP business software systems are finance, inventory control, customer relation management (CRM), and human resources. In our definition, an ERP system can be a combination of many software systems throughout the company or just a few, but it has to consist of at least two modules that are integrated.
1 user entity
Private cloud
Multiple similar entities
Community cloud
Open for all user entities
Public cloud
Combination of different clouds
3-27
The total made revenue within the ERP market was well over 25 billion U.S. dollars in 2013. During that year the market showed a slow growth through the economic crisis with a percentage of 3.8%. However, the total licensing revenue made declined slightly, showing the rise of the SaaS business model within the ERP market (Pang, 2014).
The conventional business model of the ERP system involved three actors: the using organization, the ERP vendor, and the consultant. When the using organization decides they want to invest in an ERP system they will select and implement an on-premise software package from an ERP vendor. The ERP vendor has designed the software and will maintain it. In order to help the using organizations with implementing (and sometimes selecting the right ERP vendor) ERP vendors partner up with consultants. These partnerships usually work on a certification basis, i.e. Capgemini is a diamond level partner with Oracle. To make money, the ERP vendors sell licenses that are needed by the using organization to operate the ERP system (Juell-skielse & Enquist, 2012).
3.3 ERP-AS-A-SERVICE
ERP-as-a-service is the SaaS variant of an ERP system. When we talk about ERP-as-a-service we are talking about ERP modules build from SaaS packages (Juell-skielse & Enquist, 2012). An ERP-as-a-service implementation in this sense can be seen as the process of integrating Oracle CRM on demand (SaaS CRM) with an existing on-premise ERP system. The SaaS packages are considered true cloud applications. This means that it uses a multi-tenant structure and all tenants use the same codebase and database, as well as the other cloud characteristics mentioned in the definition stated in Chapter 0.
This also implies that the ownership of the software is separate from its use, meaning that the initial investment for the software is placed at the ERP vendor instead of at the user organization. This way of delivering ERP systems is a game changer in many ways, i.e. SMEs are much more eligible as user organizations due to the lower initial investments, but it also reduces the possibilities to configure and integrate the software to specific needs (Juell-skielse & Enquist, 2012; Lechesa et al., 2012). As said in the previous chapter, ERP-as-a-service already has a measurable impact on the licensing revenues of the ERP market, indicating this is not just a marketing term.
3.4 DRIVERS AND BARRIERS OF ERP-AS-A-SERVICE ADOPTION
In the previous chapters we have stated our definitions of cloud computing, ERP systems and ERP-as-a-service. We use this chapter to present the drivers and barriers of ERP-as-a-service adoption.
3-28
technologies used are becoming more and more proven (Dubey & Wagle, 2007). There are also indications that ERP-as-a-service opens up the ERP market for SMEs in particular due to the reduced upfront investments (Addo-Tenkorank & Helo, 2011; Lewandowski et al., 2013). In order to find out whether or not these arguments are supported by a wider group of experts we have undertaken an explorative research into the scientific literature written on the subject.
When looking at the drivers and barriers, or opportunities and challenges as they are often disguised, of ERP-as-a-service there are as many perspectives as there are actors. As mentioned the traditional actors are the user organization, the ERP vendor, and the consultant. The perspectives of the ERP vendor and the user differ the most, while the consultant assimilates perspectives of both parties (Juell-skielse & Enquist, 2012).
In the table below we have listed the drivers and barriers of ERP-as-a-service adoption from the user perspective found in scientific literature.
Table 9: User opportunities and challenges (Juell-skielse & Enquist, 2012)
User opportunities User challenges
Reduced up-front investments* An ERP project must be a business initiative
Decreased implementation costs and risks Lack of senior management involvement
Predictable and lower costs* Lack of detailed systems implementation plan
Productivity improvements Project escalation and lack of control
Stock reductions Lack of policies and laws*
More focus on IT-value Poor use of consultants
Customer responsiveness ERP-as-a-service requires local software
Complete service offerings from several vendors Less customization and integration
possibilities*
Increased bargaining power Large dependency on vendor*
Access to and flexibility to choose between state of the art technologies*
Less availability, reliability and performance*
Access to reliable, secure and scalable
infrastructure
Increased security risks*
Up-to-date software* More rigid organizations
Remote access from anywhere at any time* Structural changes*
Easier access to technical expertise* Redistribution of responsibility
Easier version management Lack of alignment
Improved processes* Lack of project team expertise
Order cycle improvements User resistance
Improved financial close cycle High demands on process orientation
Improved information and transparency Increased integration of information Increased standardization
More proactive purchasing behavior Simplified phasing of implementation Single point of contact
Increased focus on core competencies