Preface
In front of you lies my bachelor thesis called Assignment of cyclists in the Netherlands which I wrote as part of finishing the civil engineering programme at the University of Twente. At the end of 2017, I approached Goudappel Coffeng about possible assignments and one of them appealed to me: modelling cyclists. Models of other modes are elaborate and well studied, but cyclists are often forgotten. That sounded like a good assignment.
Consequently, I worked on this thesis about assigning cyclists from mid April 2018 to the start of July 2018 at Goudappel Coffeng in Deventer. I enjoyed working at the company and all colleagues were very welcoming. Employees from different teams were always prepared to assist with their knowledge and skills and I would like to thank them for that. In particular, I would like to thank Bastiaan Possel, my supervisor, and Rogier Koopal, who was the acting supervisor while Bastiaan was away. I would not have been able to finish this thesis without their help.
Furthermore, I thank Oskar Eikenbroek, my university supervisor, for his guidance and ideas about the research setup. He was always prepared to give useful feedback and it really helped me in improving the thesis. My peer-review partner, Michiel, helped me a lot with finding alternative ways to phrase explanations. Finally, I want to thank my family for supporting me in the process and my brother for help with creating the front page.
I hope you will enjoy reading this thesis.
Jesse Voorhorst, Zwolle, 5 July 2018
Table of contents
Abstract
6
1. Introduction
7
1.1 Context
7
1.2 Research aim and questions
8
1.3 Relevance
8
1.4 Methodology
9
1.5 Reading Guide
10
2. Route choice of cyclists
11
2.1 Comparison of factors in literature
11
2.2 Expert opinion
14
2.3 Available data
16
2.4 Factors in algorithm
20
3. Algorithm
23
3.1 Current method
23
3.2 Route assignment
23
3.3 Requirements and criteria
25
3.4 Scores of algorithms
26
3.5 Generation algorithms
28
3.6 Selection generation algorithm
29
4. Calibration route generation
31
4.1 Implementation and parameters
31
4.2 Methodology
32
4.3 Calibration of ’s-Hertogenbosch network
33
4.4 Calibration of Tilburg network
37
5. Calibration of assignment algorithm
41
5.1 Implementation and parameters
41
5.3 Calibration results
45
5.4 Analysis of assignment results
51
5.5 Comparison with other model
55
6. Validation
57
6.1 Network and methodology
57
6.2 Route generation
57
6.3 Assignment
61
7. Discussion
67
8. Conclusion
70
9. Recommendations
72
References
74
Appendix A: Route generation details
76
Abstract
1. Introduction
1.1 Context
The Netherlands are a country famous for its bike use. In 2016, 27% of the trips in the Netherlands were made by bicycle and on average, each inhabitant cycles 2,5 kilometres per day (Centraal Bureau voor de Statistiek, 2017a). The use of cycles has increased since the start of the 21st century. Between 2005 and 2016, bicycle use has increased with up to 3,5% in Dutch cities and bicycles have become the most used transport mode in
Amsterdam and Utrecht (Kennisinstituut voor Mobiliteitsbeleid, 2017b). The total distance travelled by bike went up from 14 billion kilometres in 2005 to 15,5 billion kilometres in 2016 (Kennisinstituut voor Mobiliteitsbeleid, 2017c). This increase can be explained by the
change of the characteristics of the inhabitants: more students and younger people live in cities like Amsterdam and Nijmegen. E-bikes make it possible to cover larger distances and to stay more mobile when becoming older (Kennisinstituut voor Mobiliteitsbeleid, 2017a).
This increase will probably continue during the following years as the Dutch government is trying to increase the cycle use for short trips to reduce health problems like obesity, to improve the air quality and to reduce congestion on the roads. It tries to achieve this by investing in high-speed cycle paths and creating more parking facilities and cycle paths (Rijksoverheid, 2017). The increased use of the bicycle in the cities can cause problems. For example, on some roads in Nijmegen, traffic jams of cyclists occur ("Nijmegen wil af van fietsfiles," 2016). For these reasons, it becomes more important to have a good method that can predict the number of cyclists on new routes and can help when making policy.
To help in making these policies or design decisions, models can be used. A much-used model is the four-step model which uses four steps to determine the number of vehicles on each road in the network. Advanced methods have been developed for assigning cars and motorised traffic to roads, but cyclists have not been included in them for many years. At this moment, in most cases cyclists are assumed to take the shortest route, but in reality, lots of other factors play a roll as well.
In recent years, multiple studies have been done trying to describe the route choice behaviour of people (see chapter 2) based on surveys or GPS traces, but they have not been translated into an assignment algorithm. Furthermore, most research is focussed on cities abroad, where cycling is not as popular as in the Netherlands. This means there are no cyclist assignments developed in order to describe cyclists’ route choice as good as possible. This research tries to find an assignment for cyclists based on the characteristics of how cyclists choose their route.
software package that they developed themselves. This is based on the standard four-stage model.
Overall, it becomes clear that the routes of cyclists have to be modelled in more detail in order to predict where problems arise and what the usage of new cycle routes will be. This research will therefore focus on better determining the routes of cyclists in order to improve the four-stage model of Goudappel Coffeng for their clients in the Netherlands.
1.2 Research aim and questions
As explained in the previous section, because of an increasing number of cyclists and an increasing interest in cycling from governments, a better assignment of cyclists is needed in four-stage models like OmniTRANS uses. The aim of this research can be summarised as follows:
The aim of this research is to improve the accuracy of the route assignment of cyclists in four-stage models for use in the Netherlands.
From the literature discussed in chapter 2 it becomes apparent that there is no real agreement on what the most important factors are for cyclists when they choose their route. Furthermore, no assignment and little research has been performed about situations in the Netherlands. Based on these results, the following main research question has been formulated:
How can the assignment of cyclists in a four-stage model realistically be modelled for use in the Netherlands?
Realistic can be explained in many different ways. In this case it will be interpreted as closeness to reality. This was measured by comparing the modelled number of cyclists on a certain road with the observed number of cyclists on the same route. In chapters 4 and 5 about calibration, the method is explained in more detail.
This main question was answered by the following subquestions:
1. What are the most relevant factors in the route choice in the Netherlands? 2. What methods do exist for the assignment of cyclists in a four-stage model? 3. What is the most useful method for assignment in the Netherlands?
4. What combination of variables does describe the route choice in the Netherlands best? 5. How well does the all-or-nothing assignment perform in the Netherlands?
6. To which extent is the proposed algorithm an improvement?
1.3 Relevance
Different assignment algorithms have been developed and tried before, but these did not use real data to calibrate it and did not validate at all. Furthermore, multiple studies have been conducted about the route choice behaviour of cyclists, but these were only used for describing the choice of cyclists. These authors did not do an assignment at all. This research will combine these types of studies, which was not done before. The results from the route choice studies were used to determine the most relevant factors that influence the route choice behaviour. These were incorporated in a model and the model was calibrated and validated using real data. The next section describes in more detail the methodology of this study.
1.4 Methodology
In order to find the answer to these questions, a number of steps have been taken. This methodology greatly depended on the available data, so first the data will be explained shortly. For this research, three networks were available of ’s-Hertogenbosch, Tilburg and The Hague/Rotterdam. The Tilburg and The Hague/Rotterdam networks contained information about possible factors that influence the route choice of cyclists. Examples include the road type, surrounding land use and intersection type. Furthermore, these networks included cyclist counts on many roads within the network. In section 2.3 more information can be found about the available data and its quality.
First of all, the factors that influence the route choice of cyclists were determined by reviewing the available literature. This was expanded with interviews with cycling experts working at Goudappel Coffeng. To find which factors are applicable to the Netherlands the factors mentioned in the literature and by the experts were compared. Of each study, the most and least important factors were summarised while taking the quality and relevance in the Netherlands into account. The experts were asked to rank the factors and if possible, to mention some factors that they think are not relevant. Based on all results, the most
important factors that describe the cycling route choice in the Netherlands were selected in order to implement them in the algorithm. This selection also took into account about which factors data is available.
To answer the second subquestion about the available methods to assign cyclists, a
literature review was used as well. An overview of the different methods and their properties was created of previously used methods in peer-reviewed journals. These were analysed and their stronger and weak points were described.
Following the exploration of different algorithms, a suitable algorithm was selected. The found algorithms were scored on a number of criteria like speed of simulation, speed of implementation, expected accuracy and possibility to incorporate the relevant factors from the first subquestion. Each option received a score on those criteria and the most useful method was selected.
certain OD-pairs (a combination of an origin and a destination). Additionally, routes between the origins and destinations were planned using the Fietsersbond route planner
(Fietsersbond, 2018) and compared to the generated routes. The assignment itself was calibrated using the t-test and GEH-statistic to compare modelled cyclist numbers with cyclist counts. These are standard measures within Dutch and international traffic studies, respectively. The t-test and GEH-statistic treat a 10% deviation for example differently if the number of cyclists is 6 or 600, while other measures do not (e.g. MSE or percentage of deviation).
The algorithms were calibrated using the Tilburg network that has great detail in its road network and contains multiple cyclists counts from 2015. The route generation was
additionally tested on the network of neighbouring ’s-Hertogenbosch, because this network is smaller and was therefore quicker and more useful for testing purposes. The calibration used a OD-matrix (matrix with the number of cyclists between all origin and destination zones) of the morning peak hour.
The performance of the all-or-nothing assignment was tested using the Tilburg and The Hague networks. The closeness to reality was measured with the t-test and GEH-statistic, and with the same counts used for the new proposed algorithm. The results were compared against the standard quality requirements for model performance belonging to the used tests (see section 5.2).
Finally, the parameter values that resulted from the calibration were validated using the The Hague/Rotterdam network. The generated routes were again compared with a map and routes in the route planner. The results of the assignment were compared with the counts using the GEH-statistic and the t-test. The outcomes of the t-test and GEH-statistic were compared with the performance of an all-or-nothing assignment applied to the same network and to performances of other algorithms on other locations as found in literature.
1.5 Reading Guide
This thesis starts with an exploration of the factors that influence the route choice of cyclists in chapter 2. That chapter includes a literature review, opinions of experts and a comparison between all previous research in order to establish the most important factors. The third chapter focusses on the choice of algorithm. Again, literature has been studied, and the different options are scored. Chapter 4 describes the calibration of the first part of the algorithm, the route generation, while chapter 5 describes the calibration of the
2. Route choice of cyclists
Cycling from home to work, there are in most cases many different options to reach your destination. Some are quick, some are more comfortable, others have a different landscape or are perceived as safer. The choice of the best route in your situation depends on a great number of factors including the goal of your trip and the time. This chapter discusses which factors play a role in choosing a route and tries to establish the most important factors that can be used in the improved algorithm. The first section starts with a description of the most and least important factors according to the literature and assesses the quality of the research and applicability in the Netherlands. This is followed by expert opinion about what factors are most important in the Netherlands in the second section. The third section gives a description of the available data and its quality and limitations and in the final section of this chapter, the most useful factors were selected for implementation in the algorithm, based on the results of the literature review and the available data.2.1 Comparison of factors in literature
As mentioned in the introduction, there is an increasing interest in the route choice
behaviour of cyclists. Two main types of research are used to establish the most important factors: stated-preference (SP) and revealed-preference (RP) studies. The first type uses surveys to ask people what they think is most important when choosing a route, while the second method observes past behaviour. Most research is stated-preference, based on surveys in which people can choose between two or more hypothetical routes with different properties. During last years, more revealed-preference research based on GPS traces is conducted.
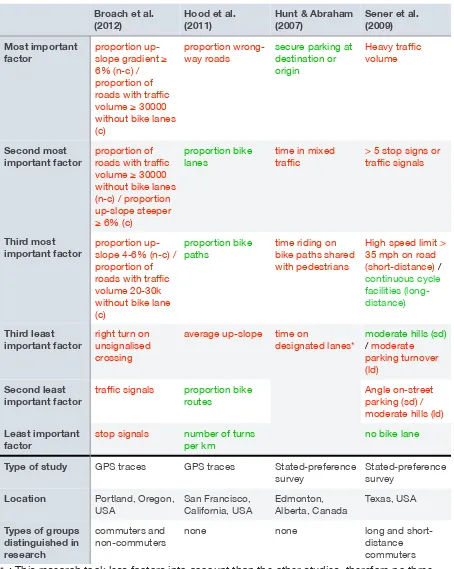
Much of this research is conducted abroad and consequently not always applicable to the Dutch situation, because of differences in cycling culture and infrastructure. Furthermore, stated-preference research is less useful for predicting the real choice of people and might only give an indication. This section compares the results of the studies and their quality. In table 2.1 the most and least important factors per study are shown together with some characteristics of that research, like the type of study and location. The least important factors are included as well to indicate which factors should not be implemented in an algorithm, because they do not seem to have any influence.
Some studies in table 2.1 distinguish between different groups of cyclists. In case the most important factor is different between the groups, both most important factors are
Table 2.1. Most and least important factors according to different studies. Red indicates a negative influence on the utility of a route, green indicates a positive influence on the utility of the route.
* : This research took less factors into account than the other studies, therefore no three least relevant factors could be found.
Broach et al.
(2012) Hood et al. (2011) Hunt & Abraham (2007) Sener et al. (2009) Most important
factor proportion up-slope gradient ≥ 6% (n-c) / proportion of roads with traffic volume ≥ 30000 without bike lanes (c)
proportion wrong-way roads
secure parking at destination or origin
Heavy traffic volume
Second most
important factor proportion of roads with traffic volume ≥ 30000 without bike lanes (n-c) / proportion up-slope steeper ≥ 6% (c)
proportion bike lanes
time in mixed traffic
> 5 stop signs or traffic signals
Third most
important factor proportion up-slope 4-6% (n-c) / proportion of roads with traffic volume 20-30k without bike lane (c)
proportion bike paths
time riding on bike paths shared with pedestrians
High speed limit > 35 mph on road (short-distance) /
continuous cycle facilities (long-distance)
Third least important factor
right turn on unsignalised crossing
average up-slope time on
designated lanes*
moderate hills (sd)
/moderate parking turnover (ld)
Second least important factor
traffic signals proportion bike routes
Angle on-street parking (sd) / moderate hills (ld)
Least important factor
stop signals number of turns per km
no bike lane
Type of study GPS traces GPS traces Stated-preference survey
Stated-preference survey
Location Portland, Oregon, USA San Francisco, California, USA Edmonton, Alberta, Canada Texas, USA
Types of groups distinguished in research
commuters and non-commuters
none none long and
Table 2.1 continued.
Table 2.1 continued.
Vedel et al.
(2017) Bernardi et al. (2017) Menghini et al. (2010) TfL (2012) Most important
factor
cycling track purpose leisure maximum rise journey time
Second most important factor
distance beautiful shortest route
bike paths mandatory cycle lane
Third most
important factor segregated cycle path
little traffic nuisance
average speed advisory cycle lane
Third least
important factor number of stops types of link (not significant)
number of traffic lights
bus lane
Second least
important factor large roads residential street Least important
factor
crowding on road major road
Type of study stated-preference survey
GPS traces GPS traces stated-preference survey Location Copenhagen, Denmark Netherlands Zürich, Switzerland London, UK
Types of groups distinguished in research
none different purposes of trip
none none
Claasen & Rienstra (2017)
Most important
factor fastest route Second most
important factor good surface quality Third most
important factor safety of cycle route Third least
important factor
no slopes
Second least important factor
low number of turns
Least important factor
no tunnels
The only peer-reviewed research that was conducted in the Netherlands is Bernardi et al. (2017), which makes it difficult to draw conclusions about the most important factors in the Netherlands. The areas that were studied in the other researches are probably not very applicable to the Netherlands, because cycle use and the quality of the networks in those cities is much lower. That could implicate that cycling is not as safe as in the Netherlands which might influence the route choice of cyclists. The only city that has similar cycle use and facilities is Copenhagen. The modal share of cyclists is for example comparable to the Dutch situation: 29% in Copenhagen (City of Copenhagen, 2017), while it is 27% for the whole of the Netherlands in 2016 (Centraal Bureau voor de Statistiek, 2017b).
The research seems to show in nearly all cases that people prefer to cycle on a dedicated cycle facility, like a cycle path or lane, but the only revealed-preference study in the Netherlands (Bernardi et al., 2017) did not find a significant influence. Some other studies suggest that traffic intensities influence the route choice, of which Bernardi et al. (2017) is one. However, the stated-preference study in Copenhagen (Vedel, Jacobsen, & Skov-Petersen, 2017) found that people state the opposite. In foreign studies (e.g. Broach, Dill, & Gliebe, 2012; Menghini, Carrasco, Schüssler, & Axhausen, 2010), slopes are important factors that cyclists avoid, but in Dutch studies these are not important. This is probably related to the fact that there are very little hills present in the Netherlands.
Traffic signals and stops give a more mixed view. Some studies found that they are one of the least important factors (e.g. Broach et al., 2012), but others find that the perceived journey time is very important and that cyclists tend to avoid traffic signals (e.g. Sener, Eluru, & Bhat, 2009). The number of stops was not studied in the Dutch context, so it is difficult to predict whether it is relevant for the assignment.
2.2 Expert opinion
The previous section showed that the literature could not provide a clear view on the most important factors in the Netherlands. Therefore, a number of experts working at Goudappel Coffeng were asked to give their view on the most important factors that influence the route choice in the Netherlands. These experts have different backgrounds, but all give advice about cycling infrastructure, policy or behaviour. They were asked to give different factors that they think are important and to rank them from the most important to less important. Their opinions can be summarised as in table 2.2.
Location Utrecht, The Netherlands
Types of groups distinguished in research
none
Table 2.2. Comparison of most important factors according to the experts.
The first expert mentioned a list including type of road surface, traffic volumes, safety, number of HGVs and the weather as important factors. People change their route for
example because it protects them from the worst influences of the weather, like a route with trees that provide shadow. The most important factor according to him still is the travel time. A problem however is that people can experience time differently, which means that a long road that is very quick, can be experienced as longer because of the lack of change of the environment. The second most important factor is the distance and finally, factors about the environment. This includes for example the type of road and road surface. Important notes he made were that cyclists can make a different choice for their return trip and that the purpose of the trip can have an influence on the experience of certain factors.
Another expert made a pyramid graph to illustrate his idea about the importance of factors. The most important factors according to him are time, distance and safety. These are the base factors. Only until there are two or more routes that have the same score on the base factors, people take factors from a higher level into account. The second level exists of comfort, slopes and waiting. If that is equivalent for multiple routes as well, the experience of the route will be decisive. In his opinion, the base factors are good enough in the
Netherlands in most places, so the factors on the second level describe the behaviour the most. An important aspect he mentioned as well, was that every cyclist experiences everything differently, so in most cases more than one route between an origin and a destination will be used. How a cyclist experiences a route can even vary per moment of the day (e.g. social safety). He thinks the travel time of cyclists is not depending on the number of other cyclists, but depends most on waiting times at intersections.
The last expert agrees with the other experts that the travel time is the most important for the cyclist. However, she thinks that the number of stops is very important too. She says the stops not just increase the travel time, but cyclists experience even more time.
Continuous routes are perceived as shorter routes even when that is not true. Other factors are not important when people are in a hurry, only the time is really important, but when the purpose is recreational, the environmental factors become important. The first two experts thought that the quality of the road is the most important factor after time and distance, but this expert thinks that the type and quality of the paving plays a small role. Only if the road quality is really bad, people will tend to avoid that road if possible. She thinks that the most important difference between findings of foreign authors and the situation in the
Netherlands is the preference for cycle paths. Dutch traffic users are more used to cyclists
Expert 1 Expert 2 Expert 3
Most important factor
time time, distance and
safety (equally important)
time
Second most important factor
distance comfort, slopes and waiting times (equally important)
number of stops
Third most important factor
environmental factors (eg type of surface)
and cyclists are more assertive, so the need to use a cycle lane or path is not that strong as abroad.
All in all, the experts agree on that time is the most important factor, but they all stress on the fact that people perceive time differently, so the factual shortest route is not necessarily the chosen route. Research showed similar results, but time is not included as factor in all studies, because time is sometimes taken as a measure to compare the other factors against.
There is less consensus about other factors. Two experts and nearly all foreign research seem to think that road types are important, while one expert and the revealed-preference study in the Netherlands (Bernardi et al., 2017) do not think it is significant. The number of stops is another example of a discrepancy between the different sources. The experts think it changes the route of people, while Vedel et al. (2017) found it has only a small influence. Congestion or crowding is not important according to the experts and Vedel et al. (2017), but Bernardi et al. (2017) did found a influence.
It is not immediately clear which factors will be describing the route choice behaviour in the Netherlands best. Furthermore, some factors are (nearly) impossible to implement in an algorithm due to lack of information or data. The next sections describe the available data and the choice of factors that are implemented in an algorithm.
2.3 Available data
The choice of factors that is included in the algorithm depends not only on the most important factors in literature, but there should also be data available about those factors. For this research, OmniTRANS networks of ’s-Hertogenbosch, Tilburg and The Hague/ Rotterdam were available. These networks include the main car road network
supplemented by the cycling network supplied by the Fietsersbond. The detail level in ’s-Hertogenbosch is lower than in the other two networks. It includes only major roads (8500 links in total) and less centroids (148) in a similar area. In the Tilburg and The Hague/ Rotterdam networks there is a centroid for each postcode-6 area, while in
’s-Hertogenbosch, there is a centroid for each postcode-4 area. That means that all
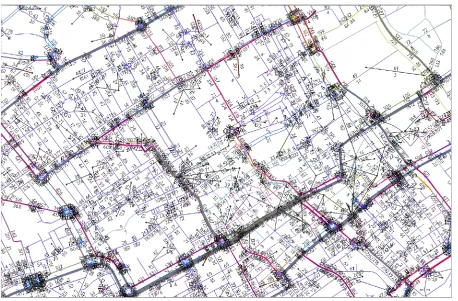
Figure 2.1. ’s-Hertogenbosch network.
!
!
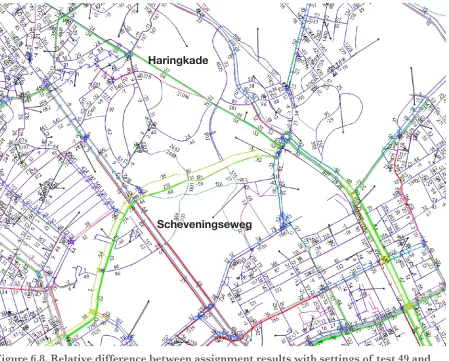
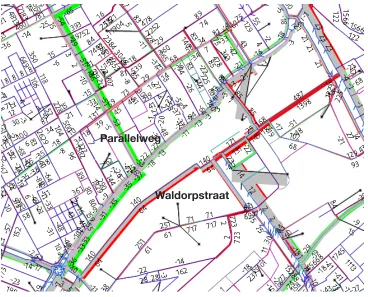
Figure 2.3. Part of the The Hague/Rotterdam network that was used in the validation of the algorithm (see chapter 6).
All networks contain not just the urban area, but also include parts of the countryside around it. The ’s-Hertogenbosch network also includes for example Oss and the area in between. The The Hague/Rotterdam network includes a large area around it. Roughly, it is the area between Leiden and the island of Goeree-Overflakkee and between the North Sea coastline and Gouda. After cutting the network it still included Delft, Zoetermeer and some other towns around The Hague (see figure 2.3). The Tilburg network includes towns in all directions around it.
Every road section on which cyclists are allowed, has additional attributes about
characteristics for cyclists. This data is provided by the Fietsersbond in the Tilburg and The Hague/Rotterdam networks. These attributes include the type of cycling infrastructure (e.g. cycle path, lane or normal road), type of road surface, type of intersection at the end and start of the road section and whether it is classified as a main cycle route. Furthermore, the Tilburg network has data about the quality of the road surface, lighting, the hinder of cars to cyclists and the type of surrounding land use (e.g. meadows or built environment).
The Fietsersbond’s volunteers entered this data in a GIS environment which was coupled to the OmniTRANS network. Information about the type of road and road surface seem to include little flaws and nearly every road in the network has the right attribute. The type of intersection at the end of the road section does not seem always correct and in some cases, many intersections are classified as unknown type. The network of The Hague and Rotterdam seems to have a greater number of unknown types of intersection compared to Tilburg. The land use seems to be correctly inputted in nearly all cases, but the other attributes, like road surface quality are very subjective and the categories might therefore be inconsistently applied. The personal opinion of the volunteer influences the
Furthermore, the average speed of cyclists is added as an attribute to all roads. The average speed is calculated using a formula earlier found by Hogenkamp (2014), which includes the type of road and the curvature of the road. Also, the length of a road is known from the geometry of the network. The length is an accurate measure, because the
geometry is based on maps. The average speed gives only an indication as the formula is a model itself which does not have to be correct in the considered locations.
Other input data for the assignment is the OD-matrix of the area. The OD-matrices were developed by Goudappel Coffeng for the governments in the areas of the network. The OD-matrices were estimated on the basis of the number of inhabitants and the number of jobs in the origin and destination zones with a gravity model. Before applying the gravity model, the resistance to travel for cyclists between areas was estimated based on an all-or-nothing assignment. The number of inhabitants was broken down in different socio-economic and age groups and the jobs in different types. An example of the job types is office jobs to correct for differences between the groups. The modal split and trip length distribution were fitted with data from the Onderzoek Verplaatsingen in Nederland (OViN, Research into movements in the Netherlands). This is an annual study by the Dutch statistics office (CBS) on the numbers of trips between areas, time of day and the mode choice. The OD-matrix was not calibrated using traffic counts.
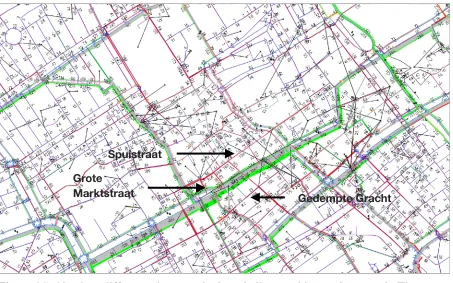
Finally, there are cyclist counts available in Tilburg and The Hague. In Tilburg, these are based on visual counts during one day in September or October 2015. These counts are conducted by a person next to the road noting the number of cyclists passing in a certain direction along that point. The counts were performed on different days in that period with different weather conditions, but all counts were on a Tuesday or Thursday and during one day. There seems to be one minor problem with the data on two parallel bidirectional service roads. All cyclists heading southwards seem to be added together without
Figure 2.4. Example of a problem in the data around the Goirleseweg in Tilburg. Both service roads only show a number of cyclists in one direction, while in reality they are bi-directional.
The counts in The Hague and surrounding areas were done in 2014, 2015 or 2016. Most counts in The Hague itself are visual counts, while counts in the neighbouring towns and cities are mostly done with pneumatic road tubes. These counts with tubes are mostly from 2016 and around 10% were done in 2015. Tube counts can have a bigger deviation from the real value, because two people cycling next to each other can sometimes be counted as one cyclist. Visual counts have sometimes problems with large groups that make it impossible for the counting person to see them all. Another limitation of the data is the different moments that counts took place, which might implicate that the values of different roads are not comparable. As this network is much larger than the Tilburg network, it includes many more counts, which is an advantage.
2.4 Factors in algorithm
Cyclists in the Netherlands seem to find the travel time the most important aspect of their journey, but the duration of a route can be experienced differently by different cyclists. The stated-preference studies in Utrecht (Claasen & Rienstra, 2017) and London (Transport for London, 2012) confirm this. Other studies focussed more on distance instead of time and distance is in studies in the Netherlands and Denmark one of the most important factors (e.g. Bernardi et al., 2017; Vedel et al., 2017). The distance can be used easily in models as this attribute is always present in networks. The time can in most cases be derived from the distance using an average speed and penalties for intersections. Another option to
calculate the time is the use of the results of Hogenkamp (2014), who described the
average speed based on characteristics of the roads. Time and distance seem relevant and information is available and these were therefore factors that were included in the
The number of stops does not seem to have a great influence in studies with GPS (e.g. Broach et al., 2012), but two of the experts mentioned them as important factors in the Netherlands, because people seem to experience a minute waiting longer than a minute cycling. This factor has some overlap with time, because people do not like to wait, as their travel time increases as a result of that. Therefore, the waiting time at intersections will be used in the algorithm with its own parameters, because the experience of this time is
different from the time spent cycling. Data is available about the type of intersections, which makes it possible to include it in the assignment.
Furthermore, in nearly all studies, in cycling and non-cycling countries, the type of road seems to be a very important factor. Cyclists prefer to cycle on separated cycle paths and cycle lanes instead of on a main road, especially in countries without a cycling culture like the Netherlands and Denmark have. Claasen & Rienstra’s (2017) survey in Utrecht suggests that cyclists in the Netherlands prefer those routes as well. Two of the experts agreed that people do have a preference for dedicated paths and lanes. However, Bernardi et al. (2017) could not find a significant result and the other expert mentioned that the safety is that high that cyclists do not care on what type of road they cycle. The insignificant results could also be explained by the large number of cycle paths and lanes in the Netherlands which makes that people do not have to take a detour in order to cycle on such a road. Information about the type of cycle facility on a road is available in detail. For example, cycle and combined moped and cycle paths are separated in the data and bicycle boulevards, service roads and lanes are distinguished. Because the type of facility may have an influence and
because there is enough data available, this factor was used in the assignment algorithm.
Another factor that has been mentioned in literature is high motorised traffic volumes on a road. This was found to be important in areas without a good bike infrastructure like Portland and Texas, but also in the Netherlands (Bernardi et al., 2017). In Copenhagen however, Vedel et al. (2017) did not find that cyclists see it themselves as important in their choice of route. No expert did mention this factor as particularly important and this factor is not directly available in the traffic model. It would mean that first a car assignment is
needed before the bicycle assignment can start. Because of the unclear influence and the fact that the use of the bicycle assignment would become more difficult and
time-consuming, this factor will not be included directly. It was however indirectly included in the road type, because normal roads and roads with cycle lanes are distinguished from roads with separate cycle facilities.
Slopes seemed very important in areas with many hills or mountains, like Portland (Broach et al., 2012) and Zürich (Menghini et al., 2010). In the survey in Utrecht it did not seem important and Claasen & Rienstra (2017) explained that with the lack of hills in Utrecht. However, one of the experts (number 2) thought that cyclists in the Netherlands do find them important, for example on bridges and in tunnels. It was not clear whether cyclists in the Netherlands take it into account. Because of that and due to the low number of slopes in the Netherlands, this factor was not taken into account.
et al. (2011) could not find an influence as well in the revealed routes of cyclists. Therefore, the number of curves will probably not be an important factor in the route choice. However, it influences the travel time indirectly, which is an important factor. The speed formula of Hogenkamp (2014) was for that reason used to calculate the travel time.
Finally, the quality of the road surface is important according to some experts, but the last expert did think that most roads are good enough and only a few bad ones will be avoided. The quality has not been mentioned in any literature in any region, so it is unclear whether it has an influence and if so, what influence. Therefore, the quality was not taken into account in spite of the availability of the data.
3. Algorithm
The factors that have been chosen in the previous chapter needed to be implemented in an algorithm in order to calculate the distribution of cyclists on the roads in an area. Various types of algortihms exist to assign vehicles to a route. Some might be used for cyclists as well, whereas others may be too time consuming or incompatible with cyclists. Therefore this chapter describes the choice for an algorithm.
This chapter starts with a description of the currently most used algorithms to assign cyclists. The second section includes the different possible algorithms to assign cyclists, while the third discusses the requirements and criteria to select an algorithm. Subsequently, the best algorithm was chosen in section 4 and finally, the route generation algorithm was selected in the last section, because in the fourth section the need arises to have such an algorithm.
3.1 Current method
At the moment, most assignments of cyclists are done with an all-or-nothing assignment which is a basic traffic assignment technique. This algorithm assigns all traffic between an origin and a destination to the route with the least costs between that origin and
destination. The costs are only based on distance, time or a combination of those. In most cases it is based on distance, which implicates that all cyclists would use the shortest route. In reality, people choose different routes between the same points as is described in sections 2.1 and 2.2. Furthermore, they do not always choose the shortest or fastest route.
As mentioned before, in some assignments the costs are based on time or a combination of time and distance. This only gives a different result from using the distance as cost
indicator if the speed is different for each road instead of an average speed applied to all roads. The results of these assignments are not satisfactory as well, because all cyclists are assigned to one route between an origin and a destination, while in reality different cyclists on the same journey can choose two different routes.
Sometimes, a small variation is applied to overcome the problem of just assigning to the route with the lowest costs. In those cases routes are generated and the cyclists are distributed over those routes with a logit model. In the cost function only time is included. This method is an improvement of the basic all-or-nothing assignment, but does not take preferences for routes into account and assumes that cyclists only have a preference for fast routes.
3.2 Route assignment
Gumbel distribution, while a probit model uses a normal distribution (Han, 2000). The probability that a route is chosen according to the logit model is expressed in formula 3.1.
(3.1)
where:
Pni is the probability that decision maker n chooses alternative i; Vni the utility of that alternative according to decision maker n; and j represents the other alternatives.
Probit models are based on a normal distribution, which does not have a closed form. Therefore, Monte Carlo simulation is needed to find the probability that a route will be chosen (Han, 2000).
The utility function in both types of model consists in most cases of multiple factors added up together with scaling factors for each factor. An example is given in formula 3.2. In this example, it is assumed that only the road type and gender determine the utility of an alternative. Because the influence of both factors is different, scaling factors β are used to correct for that.
(3.2)
where:
Vni is the utility of alternative i to decision maker n; βRT the scaling factor belonging to road type;
RTni the perceived road type of alternative i to decision maker n; βgender the gender scaling factor;
genderni the gender of decision maker i in alternative n.
A drawback to logit models is the need for the independence of the alternatives. Routes between two points share in many cases some links, which implies that the alternatives are not independent anymore. Probit models do not have this problem, but they need Monte Carlo simulation and that takes much computational time (Han, 2000).
Most authors prefer to use the logit model (e.g. Vedel et al., 2017), but according to Broach et al. (2012) and Hood et al. (2011), there is a lot of overlap between generated routes in their logit models which implies that the logit model cannot be used as the alternatives are not independent. Because the probit models become too complicated, they opted for a slightly changed logit model: the size logit model. To correct for the overlaps, a path-size factor is calculated to distribute the length of those links over the different paths. The path-size factor is added to the utility function just like the functions that were described in the previous section and the utility function is implemented in the Gumbel distribution to obtain the chance that someone chooses that route.
Ryu et al. (2018) used two criteria for selecting the route instead of one cost function. In order to assign routes to vehicles or cyclists, a balance between the two criteria needs to
P
ni=
e
Vni∑
je
Vnjbe found. The best scoring routes on both criteria are not chosen, only methods in
between. They present five different methods to distribute these routes over the cyclists of which the path-size logit assignment is one. To apply this model, they combine the two criteria, which is not needed for the other methods. Furthermore, they applied their model on Winnipeg (Canada) using all different methods. They found that the logit model worked nearly as good as the less used methods, but they did not compare the results with observations to validate the chosen routes.
Another approach is taken by Christou (2017) for use in Chelmsford, UK. He used a deterministic user equilibrium assignment with the perceived time as costs. The perceived time depends in this assignment on the speed that can be reached on a road section due to congestion and the type of road. The intensities of both car and cycle traffic are included in determining the speed. The free-flow speed is different for each type of road, so separate cycle paths have a higher maximum speed. This model was calibrated on 76% of the counts and validated on the rest of the counts in the same area. This type of assignment has the advantage that no route generation is needed because the costs are attributed to links instead to the routes. However, there are no grounds presented for taking congestion and capacity into account in a cyclists’ assignment. No other literature used this method or found that capacity constrains the speed of cyclists.
The logit and probit choice models are used to make a choice between routes, while the user equilibrium and all-or-nothing assignment can assign directly based on costs that are related to links. This means that logit and probit models first need another algorithm to generate possible routes in contrast with the all-or-nothing and user equilibrium
assignments. The algorithms needing route generation are therefore called two-stage models, because of the two different steps in assigning the cyclists (Bekhor, Ben-Akiva, & Ramming, 2006; Ryu et al., 2018). A disadvantage of these models is the increased computational time, because more steps are needed.
Assignment of cyclists is fastest with a logit model, but as stated before, this does not take overlapping routes into account. Probit models can be used too, but take much time. A useful compromise is the path-size logit model that does take the overlapping into account. The user equilibrium assignment takes factors only indirectly into account and therefore seems to be less suitable. A downside to this method is the lack of a comparison between the modelled and real situation in the study. It is unknown at this stage whether these models provide realistic results. The next section describes the requirements of the algorithm and the criteria on which the different methods are assessed.
3.3 Requirements and criteria
In the previous chapter the most suitable factors have been determined for application in an algorithm. To find the most useful algorithm, this section discusses the requirements of the algorithm.
The algorithm therefore had to result in multiple routes from an origin to a destination. Furthermore, it was needed to have a better division over the routes with more detail than just for example a 50/50 division. To have a useful algorithm, speed of the assignment algorithm is important. A consequence of that is the need for an effective method without unnecessary calculations. The speed was qualitatively measured by reviewing the literature which used those methods and made comparisons between methods (e.g. Broach et al., 2012).
Furthermore, the algorithm should be able to include the factors that describe the Dutch situation best as were described in the chapter 2. It had to be implemented in OmniTRANS, so the programming language in which it has to be written is Ruby. Finally, a method should be well-substantiated.
These requirements were tested with the following criteria:
-
ability to assign cyclists on same O-D pair on different routes-
ability to include the factors from chapter 2-
ability to use the factors to influence the division of cyclists over the different options-
running speed-
ability to implement the algorithm in Ruby and OmniTRANS-
theoretical basis3.4 Scores of algorithms
The different types of algorithms described in section 3.2 are rated in this section on the criteria of the previous section. Only methods that have been used previously have been compared, because it is not certain whether they work at all. Furthermore, various methods that Ryu et al. (2018) described, were not found in other sources and therefore were not considered as an option.
The requirements were assessed by analysing the literature in section 3.2. Running speed was not measured quantitatively, but it was compared using the comparisons of algorithms in literature (e.g. Broach et al., 2012). The theoretical basis was described by comparing which authors did use it before and in what way they used it. Table 3.1 shows the results of the comparison.
Table 3.1. Scores of different assignment techniques on the criteria set in section 3.2.
Criterion All-or-nothing
assignment Logit assignment Probit assignment User equilibrium assignment ability to assign
cyclists on same O-D pair on different routes
only by applying algorithm more than once
yes yes yes
Based on the scores presented in table 3.1, a logit model seemed to be the most useful algorithm to implement. It has an acceptable calculation time, it is able to assign cyclists to more than one route and it has been tested in literature many times before. Furthermore, it is capable of including the different opinions of different people and the characteristics of the alternative routes. A logit model treats the different routes as independent options. That is not the case because it is possible to have overlaps between routes. Therefore, a path-size logit model was applied because that corrects for overlaps.
The probit model is the second best option, but because Monte Carlo simulation is needed, logit is preferred over probit. Simulation takes much more time because of the vast number of iterations and it is not provided as a standard function in OmniTRANS. An all-or-nothing assignment is not useful, because it is not able to create different routes. A variant of this can create multiple best scoring routes, but how many cyclists take which option cannot be established.
ability to include the factors from chapter 4
yes, by
including them in the cost function
yes, by including them in the cost function
yes, by including them in the cost function
indirectly, Christou (2017) incorporates factors by
changing the free-flow speed
ability to use the factors to influence the division of cyclists over the different options
no yes, by including them in the cost function
yes, by including them in the cost function
partly, speed influences the choice of route
running speed very quick (no iterations)
quite quick slow (need for simulation) quite quick ability to implement the algorithm in Ruby and OmniTRANS Standard function in OmniTRANS
Formulae can be implemented in Ruby
Formulae can be implemented in Ruby, more difficult than logit due to need for simulation
Standard function in OmniTRANS
theoretical basis Good basis, but cyclists do not choose the same routes, so not in the case of cyclists.
Good, e.g. Hood et al. (2011); Broach et al (2012); Vedel et al. (2017); Ryu et al. (2018). Most authors did not use it for assigning however. Standard logit considers alternative routes as independent, path-size logit can correct for overlaps.
Good, most authors did not use it because of the difficulty in applying it, but they agree on the accuracy of the method.
Good for cars, only Christou (2017) applied it to cyclists. No other examples of application for cyclists in literature.
All-or-nothing
Finally, the user equilibrium was considered. This method has only been applied once with cyclists and it is most used in situations with congestion. It assumes that people know what the costs of each route are and take the route with the least costs. As everyone does that, an equilibrium will arise. Christou (2017) used perceived time as cost and the perceived time depended on the speed which on its turn depended on the traffic intensity on the route and the free-flow speed. Normally, congestion is not a problem in assignments of cyclists and no literature describes capacity problems for cyclists. The chosen factors in chapter 2 do not include congestion and capacity. Without including those, this assignment would be equal to the all-or-nothing assignment in which everyone will all take the same route with the least costs. The only way this method would work is modifying it to a great extent. It is not deemed practical because of these reasons and will not be used.
3.5 Generation algorithms
A consequence of the choice of the logit assignment is the need for generating routes, while all-or-nothing and user equilibrium assignments do not need a route set. Therefore, an algorithm needs to be found for this. Multiple algorithms exist to generate routes. The most simple and quick way is to use Dijkstra’s (1959) algorithm for the shortest route.
This algorithm generates just one route based on just the criterion of distance. It can be expanded to include a number of shortest routes by randomly changing the lengths of the links in the network (e.g. Yen, 1971), but that is still just based on the criterion of distance. A disadvantage of these algorithms is that a lot of similar routes will be made with for
example only a slight variation in the end (Bekhor et al., 2006). Broach et al. (2012) used therefore a method that maximised or minimised multiple variables (see description in section 2.1) within a reasonable detour from the shortest route. With this method the best route based on each variable is found. They calibrated the limit of ‘reasonable’ with their data of cyclists in Portland.
This a slightly changed version of the labelling technique that Bekhor et al. (2006) describe. Labelling works the same way without the limitation of the reasonable detour. Hood et al. (2011) used a stochastic method based on the utility of routes. In the algorithm, each factor that influences the route choice is calculated using a parameter that is drawn from an interval. Based on the drawn values the shortest route is determined and this process is repeated during a couple of times.
Ryu et al. (2018) propose a similar type of method, but this method is especially made to assign routes to cyclists. They use the distance and the bicycle level of service (BLOS) as the two criteria. The first criterion includes a penalty for turning movements and
intersections as well. The second criterion is a score on the perceived safety of the route. It consists out of three measures that have to be calculated themselves too: average bicycle segment score, average bicycle intersection score and the average number of unsignalised conflicts per mile. The first two measures are being calculated on the basis of factors like the vehicle volume and width of lanes. The method first generates routes based on the distance criterion and calculates the BLOS of those routes after that. The routes with a good balance between BLOS and distance are selected as choice set.
Generating routes based on just one objective can be performed not only using Dijkstra’s algorithm and Monte Carlo simulation for variation of costs, but also using the slightly different doubly stochastic generation. Instead of only varying the costs of the links using the Monte Carlo simulation, the preference for certain attributes is drawn from another probability distribution as well. After each random draw, Dijkstra’s algorithm is applied again to find the route with the least costs (Halldórsdóttir, Rieser-Schüssler, Axhausen, Nielsen, & Prato, 2014).
An alternative for Monte Carlo simulation is the breadth first search on link elimination. This algorithm determines the shortest route and continues with deleting each link in the route once and recalculating the shortest route if that link would not exist. After that, two links at the same time can be deleted and new shortest routes will be found (Halldórsdóttir et al., 2014).
Furthermore, the branch & bound method can be used as an alternative for Dijkstra’s algorithm. This method constructs a tree by adding all branches of the route until a certain point. The number of routes can be reduced by adding restrictions, but it still requires much computation time in high-resolution network (Halldórsdóttir et al., 2014).
3.6 Selection generation algorithm
The generation algorithm that was selected had to fulfil a number of requirements. First of all, it had to be possible to implement it in the OmniTRANS software. Furthermore, the computational time should be as short as possible, while retaining enough generated routes. This section describes the reasoning behind the selection of an algorithm out of the options from the previous section.
In OmniTRANS certain standard functions are provided. It has a preprogrammed function to generate the shortest routes using Dijkstra’s (1959) algorithm. Furthermore, it can find alternative routes using a Monte Carlo simulation of which the variance can be set. The alternative routes can be filtered to exclude too overlapping routes and too long detours. However, the use of Monte Carlo simulation takes long and it is because of that not the preferred option.
be assigned to that route. If a route has not been generated however, the route cannot be assigned at all. Therefore, it is better to generate a few more routes than necessary instead of not generating good options. A disadvantage of generation of more than needed routes is the increasing computational time of the model, especially when using Monte Carlo simulation for generating alternative routes.
According to Halldórsdóttir et al. (2014), the breadth first search on link elimination uses the least computational time compared to alternative methods as doubly stochastic generation method and branch & bound. Furthermore, it provided similar results to the doubly
stochastic generation. A downside compared to the Monte Carlo simulation is the that breadth first search on link elimination only determines the route set per OD-pair (Rieser-Schüssler, Balmer, & Axhausen, 2013), while the Monte Carlo simulation in OmniTRANS is capable of determining alternative routes of all pairs from one origin at the same time.
To obtain all possible routes within a reasonable time the shortest route it was decided to generate routes using Dijkstra’s algorithm. Other possible routes were generated with a Monte Carlo simulation in which the costs of the links vary. The costs are equal to the length of the link. Unfortunately, there is not another algorithm available that can reduce the computational time. To obtain all relevant routes there can be two main methods
distinguished: generating a high number of routes with the Monte Carlo simulation based on distance or applying the shortest route algorithm to different cost functions, for instance based on suitability, complementary to some routes based on distance. Both options have their advantages and disadvantages.
The first option will only generate different routes, but a part of the route set will only be slight variations on other routes. A disadvantage is that time is used to generate and store routes that are not needed, because the route set will be too large for most pairs. However, if this would be reduced, on other pairs, too little routes are generated.
The other option is to change the cost function in order to only include a suitability score. An advantage of this method is the explicit generation of routes that are longer and could be more suitable. A disadvantage is, as some experts pointed out, that the cycle facilities in the Netherlands are good and present on many roads. This implies that many of the
generated routes are identical to the generated routes based on distance as costs which means a lot of computational time is taken without a useful result. Furthermore, the influence of the route choice factors will be included twice in the whole process of generating routes and assigning a route, which means that calibration becomes more difficult. When using more Monte Carlo draws based on distance, there is only one factor that should be calibrated in order to generate enough routes: distance.
Considering all options the Dijkstra algorithm was expanded with a Monte Carlo simulation based on varying the costs. The costs are only based on distance, because that is the most important factor in the route choice of people as described in chapter 2 and it would not be efficient to implement other factors that probably have a marginal influence. As the experts mentioned, cyclists will only consider slightly longer routes if they are safer or more
4. Calibration route
generation
In the previous chapter the type of algorithm was selected that has been implemented with the factors described in chapter 2. In order to give a good prediction of the number of cyclists the algorithms need to be calibrated. This chapter discusses the process and results of the calibration of the first part of the algorithm, the route generation. This algorithm needs to generate all routes that cyclists consider so that the assignment algorithm can make the right distribution over the routes. However, it is not possible to generate all routes due to time and storage restrictions. Therefore a balance needs to be found between accuracy and efficiency. The first section of this chapter describes the implementation and the parameters that are involved in the calibration. This is followed by a section about the methodology of this calibration. The route generation algorithm was tested on two networks: ’s-Hertogenbosch and Tilburg. The third section presents the results of the calibration on the former network and the fourth section on the latter.
4.1 Implementation and parameters
In chapter 3 a comparison of the different methods for route generation was done which resulted in the choice for a Dijkstra’s algorithm with Monte Carlo simulation to vary the costs. OmniTRANS possesses a built-in feature to generate routes with these methods that is normally used for dynamic assignments of cars, based on the algorithm of Fiorenzo-Catalano (2007). Parameters of this route generator are the variance, the increment of the variance, maximum variance and the number of iterations. The variance is only increased in case no more new routes are found with the variance at the start and the maximum number of iterations has not been reached yet. The generator uses a normal distribution to draw new costs for each link.
The built-in route generator also has the ability to filter routes that have too much or little overlap with other routes. It was decided to not use this function, because it would mean that an alternative route using a parallel route would be generated, but deleted before it would be added to the route set. This route might be taken, so it is better to let the assignment algorithm judge about whether cyclists take that route.
4.2 Methodology
The routes that are included in a choice set differ from person to person and no data is available about which routes on each OD-pair are considered. To give a good indication of the quality of the route set, different OD-pairs were selected with different characteristics. Some OD-pairs are only on the countryside, some wholly within a city, while others are semi-rural (e.g. rural origin and destination in city). Furthermore, OD-pairs with different distances between origins and destinations were selected, so for example a pair with just one short reasonable route and a pair between two neighbourhoods with many parallel routes.
The quality of the generated route set can only be assessed indirectly. In this calibration the quality of the route set belonging to some selected OD-pairs was compared with a map of the area and it was visually assessed whether all ‘reasonable' routes are included.
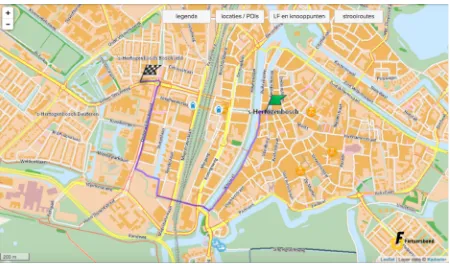
Reasonable means that the most direct route, shortest route and some slightly longer routes are included. The slightly longer route might be more suitable for cyclists which means that cyclists could prefer it over the shorter route. The line between reasonable and not reasonable is very subjective and not measurable. Therefore, the Fietsersbond
routeplanner (Fietsersbond, 2018) was used to help indicate whether all logical routes were included. This planner gives the option to choose from different types of routes, for example the shortest or the easiest (makkelijk doorfietsen in Dutch). It should be noted however that these routes do no have to be realistic routes, because they are model-based, but they seem in general to be more realistic than routes of other planners like Google Maps
(Google, 2018). Google Maps tends to plan routes with large detours which does not seem reasonable.
The Fietsersbond route planner contains 11 options for planning a route of which 4 are considered (quite) relevant: the shortest route, makkelijk doorfietsen (easy cycling), autoluw (low numbers of motorised traffic) and fietsbewust (routetype with less slopes and
preference for traffic lights instead of roundabouts). Routes of type makkelijk doorfietsen follow cycle paths along main roads and cycle routes as much as possible and avoid traffic signals if there is a good alternative. These routes are a bit longer than the shortest route, but might be the quickest because minor roads with many curves are avoided.
Furthermore, these are easy to remember because they are on main roads. Autoluw routes follow dedicated cycle paths as much as possible and in other cases, these routes are on quiet roads. Finally, the fietsbewust routes avoid slopes and roundabouts, but prefer traffic signals. These routes avoid small roads as well and take longer straight roads instead (Fietsersbond, 2018). The other types are not considered as these seem too unrealistic for regular cyclists, like the recreational route, race cycling route, nature route and route following fietsknooppunten (recreational cycling network junctions).
4.3 Calibration of ’s-Hertogenbosch network
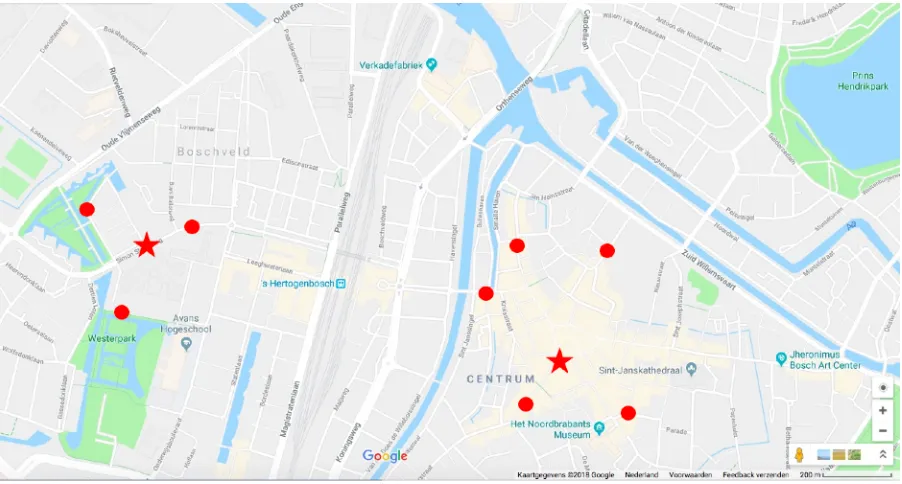
The ’s-Hertogenbosch network was tested with 5 OD-pairs of which the four selected route types of the Fietsersbond route planner (Fietsersbond, 2018) were compared with the generated routes using 4 combinations of parameters. The following OD-pairs were selected:
- Boschveld - city centre of ’s-Hertogenbosch - De Rompert - Hintham
- City centre of ’s-Hertogenbosch - De Meerendonk - Rosmalen - city centre of ’s-Hertogenbosch - Rosmalen - Nuland
The first pair is between a neighbourhood just outside the city centre and the city centre itself and it has been selected because there is only one logical route between these points. The railway station lies in between and forms a barrier which means the tunnel is the only option. The second pair is between two suburban neighbourhoods of ’s-Hertogenbosch and there are many different routes possible between the areas (see figure 4.1).
Figure 4.1. Locations of centroids of the considered OD-pairs (Google, 2018).
The third pair is between the city centre and a neighbourhood just outside it, but this pair has more than one obvious route (see figure 4.1). The fourth and fifth pair start in Rosmalen, a town just outside ’s-Hertogenbosch. The fourth pair results in various routes between a town and a neighbouring city, while the fifth pair focusses on rural routes between a town and a village.
The routes on these pairs were generated using the settings shown in table 4.1. Setting 1 was based on the standard settings that were used for car routes, but the variance and number of iterations were increased a bit because it was expected that they were not enough.
Boschveld
City centre De Meerendonk Hintham De Rompert
Table 4.1. Settings for route generation
The generated routes using these settings are shown in appendix A together with the Fietsersbond route planner results of the same OD-pairs. An example of the results is visible in figures 4.2 and 4.3. Figure 4.2 shows the generated routes using setting 1, while figure 4.3 shows the results of setting 2. Compared with figures 4.4 and 4.5, it seems that the easy cycling route was included in the generated routes of both settings, but that the fietsbewust route was not included when generating routes using setting 1.
Figure 4.2. Generated number of routes between the city centre and De Meerendonk with setting 1.
Parameter Setting 1 Setting 2 Setting 3 Setting 4
minimum number of iterations 10 15 20 20
maximum number of iterations 15 25 30 30
initial variance 0,09 0,15 0,15 0,2
variance grow value 0,05 0,05 0,05 0,05
maximum variance 0,3 0,3 0,4 0,4
!
Figure 4.3. Generated number of routes between the city centre and De Meerendonk using setting 2.
Figure 4.5. Route (2,1 km) between the city centre and De Meerendonk with setting
fietsbewust (Fietsersbond, 2018).
This example illustrates the use of the route planner to give an indication whether enough routes were available. In this case the fietsbewust route seems very reasonable as it is only slightly longer than the other type and could be safer for example. Furthermore, the second setting generates routes along both sides of the Zuid-Willemsvaart canal instead of just one. If one is perceived as being more comfortable, people might choose the other side, so it is necessary to include both sides.
Table 4.2. Number of OD-pairs in which the Fietsersbond routes were included using the different settings. Because in some cases a centroid is connected to the road network with more than one connection, multiple routes could be planned and only half of the routes were generated.
Table 4.2 presents the number of OD-pairs in which the routes of each types were included using the different settings. Each higher setting included more routes, but also took more computational time. The second setting seemed to have the best proportion between computational time and quality of the route set. Setting 3 does not result in more routes that the Fietsersbond route planner provides, while it does take much more time. The extra
Route type in Fietsersbond route planner
Setting 1 Setting 2 Setting 3 Setting 4
makkelijk doorfietsen route 3,5 4 4 4
shortest route 5 5 5 5