Daniel Nijhof (s1478591)
OPRA TURBINESData Acquisition and Control of the
Combustion Test Cell
Technical Report
Internship Report
Data Acquisition and Control of the Combustion Test Cell
Submitted by: Daniel Nijhof
S1478591
Performed at: OPRA Turbines Aerothermal Engineering Thijs Bouten & Nick Gralike
Hengelo, the Netherlands March 5 – June 4 2018
Submission to: University of Twente Faculty of Engineering Technology Department of Engineering Fluid Dynamics
H.W.M. Hoeijmakers
Technical Report
Summary
This technical report describes the LabVIEW data acquisition application for the combustion test cell at the HTSP facility. The application is split into two main parts: data acquisition/analysis and control of the test cell.
For the data acquisition system, the data of the newly integrated sensors are implemented into the application. In the report, the LabVIEW code for the data acquisition system is explained extensively in combination with the user interface. The graphical code in the block diagram of the LabVIEW application has been used to give a detailed illustration of the working of the application.
The control system for the supply panels of the control cabinet, which has been implemented from scratch, is explained for the different types of control systems in the test cell. Based on the report, it should be possible to add new systems in the future. The LabVIEW code is adapted to the software that has been installed to the Beckhoff CX-9020 PLC.
Technical Report
Table of Contents
1 Introduction ... 5
1.1 Scope of the work ... 5
1.2 Report organization ... 5
2 Background information ... 6
2.1 Combustion test cell ... 6
2.1.1 Fuel systems ... 7
2.1.2 Air supply ... 7
2.2 National Instruments LabVIEW ... 8
2.3 Data acquisition ... 9
2.3.1 I/O modules ... 9
2.3.2 Sensors ... 10
2.4 Automatization ... 12
2.4.1 Control panels ... 12
2.4.2 Gas mix panel... 15
3 Requirements ... 16
3.1 Data acquisition system ... 16
3.2 Control system ... 16
4 Approach ... 17
4.1 Data acquisition system ... 17
4.2 Control system ... 17
5 Data acquisition system ... 19
5.1 Setup of data acquisition system ... 19
5.2 Data acquisition ... 21
5.3 Calculations and User Interface ... 22
5.3.1 Liquid Fuel System ... 22
5.3.2 Gas-mixing Station ... 24
5.3.3 High-calorific Gas System... 27
5.3.4 Heat Inputs ... 30
5.3.5 Combustion Air System ... 31
5.3.6 Combustor Systems ... 32
5.3.7 Calibration Tab ... 32
5.3.8 Environment and Ventilation systems ... 32
5.3.9 Main Panel ... 34
5.4 Data Collection ... 35
6 Control system ... 37
Technical Report
6.1.1 Combustion air fan ... 38
6.1.2 Liquid fuel valve A ... 38
6.1.3 High-pressure diesel pump ... 38
6.1.4 LabVIEW code ... 39
6.2 Gas Mix Panel ... 41
7 Discussion ... 44
8 Conclusion ... 46
9 Recommendations ... 47
10 Bibliography ... 48
Appendix A: Schematic overview of combustion test cell ... 49
Appendix B: Fuel options in the combustion test cell ... 50
Appendix C: Overview of signals per subsystem ... 51
Appendix D: Meaning of tag names ... 52
Appendix E: Control system variables ... 53
Appendix F: Data binding for gas mix control ... 54
Appendix G: Control panels ... 55
Technical Report
1
Introduction
OPRA Turbines moved in June of 2017 from its old location at the Opaalstraat 60 in Hengelo to a newly built location on the High-Tech Systems Park in Hengelo. Because of the relocation, OPRA can upgrade several aspects of the company. One of these aspects is the atmospheric gas turbine combustion test cell that is used to test the combustion systems of the gas turbine for a wide range of fuels.
In this section a scope of the work will be given. The description will also treat the desired results. Furthermore, the motivation and report organization are given.
1.1
Scope of the work
The combustor is one of the key components of the gas turbine. OPRA has an atmospheric combustor test rig which is used for combustor development. One combustor can be tested for the whole load range at atmospheric conditions for a wide variety of gaseous and liquid fuels. The
combustor test rig will be relocated to OPRA’s new facility in Hengelo. As part of the relocation, various improvements to the test setup will be implemented. This includes the replacement of the outdated data acquisition hardware as well as the preparations for the automatization of the test setup.
The internship revolves around the atmospheric gas turbine combustion test rig and consists of two parts: developing a data acquisition system and a control system of the full setup in National Instruments LabVIEW. Tasks in the project are:
- Evaluate the current LabVIEW data acquisition system and combustor test program - Design the LabVIEW interface, data acquisition system and hardware controllers
- Implement solutions during the commissioning phase of the atmospheric combustor test rig
- Perform test runs with OPRA’s atmospheric combustor test rig.
1.2
Report organization
For the report, the following guideline has been followed. In chapter 2, Background information, the combustion test cell is introduced. In this section the combustion test cell setup is described. In chapter 3, the requirements for the LabVIEW application are given based on the new
Technical Report
2
Background information
In this section, background information on the combustion test cell and its related components is provided. The requirements for the LabVIEW application are based on what is described here.
2.1
Combustion test cell
There are several reasons for OPRA to have an atmospheric combustion test cell besides an engine test cell, that are already up and running in the new facility:
- In the combustion test cell, only one combustor is analyzed. Since the OP16 gas turbine that is used in the engine test cell contains four combustor cans, four times more fuel will be needed to analyze the combustor performance. The combustion test cell allows cost efficient analysis.
- In the engine test cell, pressurized air of 6.7 bar is required. In the combustion test cell, this is not required, which allows testing under atmospheric conditions. Because the air does not have to be pressurized, no power for this process is needed and less fuel can be used to achieve the same temperature in the combustor.
- The combustion test cell allows flexibility when testing a wide range of fuels in a relatively short time due to multiple fuel systems and a state of the art mixing station.
A global overview of the combustion test cell is shown in Figure 2.1. The relevant components for the control and data acquisition systems are shown. The components can be divided into several systems, which will be discussed in this paragraph. In Appendix A: Schematic overview of
combustion test cell, more pictures of the complete overview are given.
Figure 2.1: Schematic overview of the combustion test cell.
In Figure 2.1, there are numbers used to show subsystems present in the combustion test cell. 1. Main supply panel. In the control cabinet, test cell components controlled.
2. Combustion air system. Combustion air is brought to the right conditions. 3. Liquid fuel system. Liquid fuel storage tanks and valves are placed here.
4. Gas mixing station. Gaseous fuel mixtures are produced, composition can be chosen by the user of the combustion test cell. The panel is connected to external gas storage. 5. High-calorific fuel system. Natural gas and propane are used for the pilot and main of the
combustor.
6. Combustor system. Here, the combustion process is analyzed.
Technical Report
2.1.1
Fuel systems
Since the OP16 runs on a wide range of fuels, both high- and low-calorific fuels are tested in the combustion test cell. Appendix B: Fuel options in the combustion test cell is dedicated to showing the options regarding fuel testing. The combustion test cell contains three different fuel
mechanisms that can be used, dependent on the combustor type. These fuel systems are:
- High-calorific fuel system
This fuel system uses either propane or natural gas. Both gases are high-calorific. The system has two outputs: the main and the pilot, whereby the pilot fuel line can be used for low power gas supply (up to 70 kW) and the main supply for high power gas supply (up to 300 kW). Selection between propane and natural gas is done by a three-way valve. In the high-calorific fuel system, two orifices are integrated in the piping, so that the mass flow of the fuel can be determined by the pressure drop over these orifices.
- Liquid Fuel system
The liquid fuel station has four output pipes and three fuel types. These systems can be used separately or in combination with one of the other fuel systems or both. The system can be divided into two parts: the high-pressure diesel system, which can operate at a maximum of 20 bar and the liquid fuel system. The liquid fuel system has two different fuels and three outputs: A, B and C. The fuel can be changed by refilling the fuel storage tanks in the system manually. Any liquid fuel can be used, such as diesel, pyrolysis oil or ethanol. Liquid fuel system C is equipped with a heater, which can be used to lower the viscosity of viscous fuels as heavy fuel oil and pyrolysis oil.
- Gas Mixing system
The gas mixing station can supply gas mixtures consisting of up to five different components. Six different gases are supplied from gas cylinders: methane, propane, hydrogen, carbon monoxide, nitrogen and carbon dioxide. Natural gas is supplied from a high-pressure pipeline. Heating is applied on the propane bottles and in the carbon dioxide supply to ensure supply in the gaseous phase. A heater is used in the methane line to avoid extensive cooldown of the gas due to expansion. The other gases are supplied at ambient temperature. Two three-way valves are installed for the selection of the supplied hydrocarbon, so either propane, natural gas or methane is supplied. The gas mixing station consists of a variety of pressure regulators and safety relief valves to ensure a proper gas supply for the five mass flow controllers (Bronkhorst EL-FLOW F203AV). These mass flow controllers continuously measure and regulate the gas flow of the different components. The thermal input from the gas mixing station to the combustor can be varied from 0 to 300 kW for gas mixtures down to 5 MJ/kg. The control system of the gas mixing station sets the flow of each individual component based on the specified
composition [1].
2.1.2
Air supply
Another crucial system to the combustion process is the combustion air supply. A combustion air fan sucks ambient air into the air heater of the combustion test cell. The electrical heater heats the airflow to the same combustor inlet temperature as the combustor would experience in the OP16 gas turbine. The air mass flow from the ventilator is set such, that the velocity at the combustor inlet is the same in the atmospheric combustor test rig as it should be in the pressurized gas turbine. The air is led to the combustor to be used as oxidizer and for dilution, cooling and flame stabilization in the combustion process.
Technical Report
and gaseous or liquid fuel that is diffused into the combustor by a nozzle. To start the combustion process, an igniter is placed in the combustor. Part of the exhaust gas is directly discharged, while another part of the exhaust gas is led to an emission analyzer. The emission analyzer is not
incorporated into the LabVIEW application. In the process and instrumentation diagram (P&ID) [2], a more detailed overview of the flows in the combustion test cell is given.
Figure 2.2: Schematic overview of combustion process during an experiment.
2.2
National Instruments LabVIEW
LabVIEW (Laboratory Virtual Instrument Engineering Workbench) is a platform for the visual programming language from National Instruments. LabVIEW is commonly used for data acquisition, instrument control and industrial automation. Furthermore, it can be considered a graphical programming environment, because it makes use of visual coding blocks instead of textual code. The LabVIEW application for the combustion test cell runs on LabVIEW 2017 SP1.
There are two sides to a LabVIEW program, which is called a VI (Virtual Instrument). The front panel and the block diagram. The front panel serves as the user interface for the VI. This front panel is the screen that is used during operation of the combustion test cell. In the block diagram, objects as functions, constants, structures and wires which transfer data among these block diagram objects are present. After a front panel window, has been created, one can add code using the graphical representation of functions to control the front panel objects. The block diagram can thus be the graphical source code of the front panel.
Objects can be added to both the diagram and the panel using the controls palette that contains all possible functions and indicators in LabVIEW. Figure 2.3 shows how the front panel and the block diagram are related to each other in a VI. When running the VI (the code), the block diagram is executed and the results of the execution of the program are shown on the graphs or meters in the front panel.
Technical Report
2.3
Data acquisition
In the combustion test cell, data such as temperatures, pressures and flow rates are acquired during measurements. The data acquisition is done by sensors at specific locations of the
combustion test cell. The signals from the sensors are collected by a data acquisition chassis from National Instruments. Via an ethernet connection, the signals are transmitted to the control computer where the LabVIEW application is running. With the acquired data, the performance of the combustor can be determined.
The sensors of the data acquisition system are given tag names based on the ANSI 37.2 coding standard [3]. The tag names for the data acquisition can be divided into three main sections: the combustor system, the fuel system and the surrounding system [1]. The surrounding system is a collective name for all measurements related to the environment of the combustion test cell and its ventilation. The fuel system is focused on the three fuel systems in the combustion test cell, while the combustor system considers the systems inside or around the combustor.
2.3.1
I/O modules
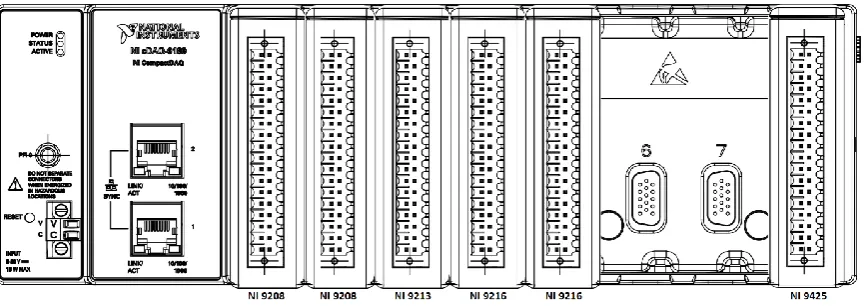
All sensor data are collected by the I/O modules of the cDAQ-9189 Ethernet Chassis from National Instruments. This ethernet chassis is wired to every sensor in the combustion test cell. Six out of eight input modules are used in the combustion test cell. The dock is in the main supply cabinet of the combustion test cell. Figure 2. shows the setup of input modules for the combustion test cell. Six input modules are installed. The two most left modules are of the type NI 9208. These are input modules specialized for current signals. They are used to transmit current signals from e.g. pressure sensors and flow meters to the computer that runs LabVIEW. The current signals range between 4 and 20 mA and must be scaled in to the right units in the LabVIEW application. The third input module, NI 9213, is wired to all thermocouples that are present in the combustion test cell. The fourth and fifth input modules, both type NI 9216, are wired to all Resistance
Temperature Detectors (RTD’s) throughout the test cell. LabVIEW automatically takes care of the
scaling to °C for all temperature input modules. In the right input module, NI 9245, only digital signals are collected and transmitted.
[image:10.595.83.516.605.758.2]In Appendix B: Fuel options in the combustion test cell, all sensors signals are given, including the related input modules and ports. Appendix D: Meaning of tag names shows the meaning of the tag names that are given per the ANSI 37.2 standard [3]. The output of each sensor must be read by the LabVIEW application. In LabVIEW, the DAQ assistant was set up to correspond to the right cards and ports. All signals that are mentioned in the tables of the appendix are read out by the LabVIEW application. These data are used to calculate heat inputs of the fuel systems and all data for the other systems in the combustion test cell.
Technical Report
2.3.2
Sensors
The settings and description of the sensors in the combustion test cell are given in this paragraph. The scaling for current signals to the desired unit is based on the findings presented below.
Thermocouples
For thermocouples, temperature is presented directly in °C in LabVIEW, after an automatic conversion from mV. For the exhaust gas temperature and the combustion temperature, N-type thermocouples are used. For the flame temperature sensors, S-type thermocouples are used. The reason for this difference is that S-type thermocouples can measure accurately in a higher
temperature domain. S-type thermocouples used in the combustion test cell can measure up to 1768 °C, while N-type thermocouples only can measure up to 1200 °C.
Resistance temperature detectors (RTD)
The RTD’s used in the combustion test cell are all 3-wire PT100 RTD’s. The resistance in Ohms that
is measured can be directly scaled to temperature in degrees Celsius using a standard scaling function for PT100 sensors [4]. PT100 is characterized by the fact that 100 Ω is equivalent to 0 °C.
The RTD sensor measure up to 550 °C.
Flow meters
The flow meters in the combustion test cell are used to measure flow rates that are present in the liquid fuel system and the gas mixing station. Flow rate measurements in the high-calorific fuel system are done by means of an orifice. Since this measurement requires pressure transmitters
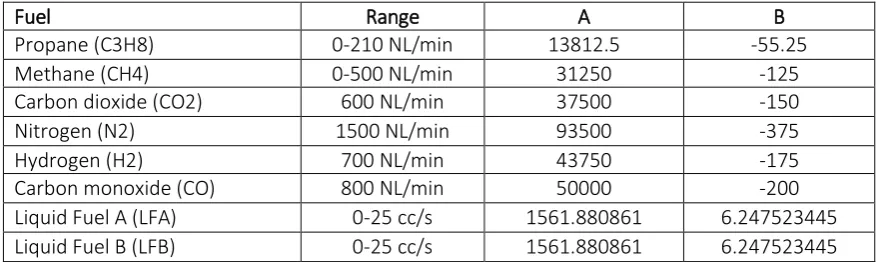
and temperatures, they are considered as pressure transmitters and RTD’s in this chapter. For the liquid fuel system, two turbine flow meters are used, while in the gas mixing station, the flow rates are measured by the mass flow controllers for each individual gas flow. For the turbine flow meters (Omega FTB-1311), fluid moving through the flow meter causes the rotor in the sensor to turn at a speed proportional to the flow rate and as the rotor blades cut through the magnetic field of the pickup, an electronic pulse in generated. The turbine flow meter gives a signal between 4 and 20 mA. For the turbine flow meters, the scaling equation is based on the output range, which is set from 0 to 25 cc/s. For the mass flow controllers (Bronkhorst EL-Flow F203AV) in the gas mixing station. Table 2.1 shows the parameters for each scaling function for the flow meters. The form of the scaling equation is given in equation 2.1:
𝑉̇ = 𝐴𝑥 + 𝐵 2.1
Where:
𝑉̇ is the flow rate in [𝑁𝐿/𝑚𝑖𝑛] (Normal liter (NL) is the volume at 𝑇 = 0 °C and 𝑃 = 1 atm) or
[𝑐𝑐/𝑠]
𝑥 is the input signal in [𝐴]
[image:11.595.78.526.653.784.2]𝐴 and 𝐵 are the parameters of the scaling function
Table 2.1: Scaling function parameters for flow meters.
Fuel Range A B
Propane (C3H8) 0-210 NL/min 13812.5 -55.25
Methane (CH4) 0-500 NL/min 31250 -125
Carbon dioxide (CO2) 600 NL/min 37500 -150
Nitrogen (N2) 1500 NL/min 93500 -375
Hydrogen (H2) 700 NL/min 43750 -175
Carbon monoxide (CO) 800 NL/min 50000 -200
Liquid Fuel A (LFA) 0-25 cc/s 1561.880861 6.247523445
Technical Report
Pressure transmitters
The pressure transmitters can be divided into two types: pressure transmitters and differential pressure transmitters. The difference is that differential pressure transmitters determine the difference between the measured pressure and a specific reference pressure, while the pressure transmitters measures the absolute or gauge pressure.
In the combustion test cell, there are four differential pressure transmitters present: three in the combustion air supply system and one for the filter of the room ventilation. The filter for the room ventilation is used to determine whether a replacement of the filter is needed. When the pressure exceeds the maximum pressure difference of 450 Pa, the filter needs to be replaced [5]. Table 2.2 shows the ranges and the scaling equation parameters for each of the differential pressure transmitters. The names given in the table are per the ANSI 37.2 coding standard [3]. The scaling equation for pressures is given in equation 2.2.
Δ𝑃 = 𝐴𝑥 + 𝐵 2.2
Where:
Δ𝑃 is differential pressure in [𝑃𝑎]
Table 2.2: Scaling function parameters for differential pressure transmitters.
Sensor Range A B
A63CAC 0-1000 Pa 625000 2500
A63CAH 0-10000 Pa 625000 2500
A63CAJC 0-5000 Pa 312500 -1250
For the pressure sensors in the fuel system, pressure transmitters are used. The 4 pressure
sensors in the High-calorific fuel system are part of the calculation of the fuel flow using the orifice pressure drop principle. The pressure transmitter in the gas mixing system is used to determine the fuel pressure. Furthermore, the room and ambient pressure are measured. The
measurements of the ambient pressure transmitter are also used in the calculation of the combustion air supply. Table 2.3 shows the ranges and the corresponding scaling equation parameters, for equation 2.3.
𝑃 = 𝐴𝑥 + 𝐵 2.3
Where:
𝑃 is the absolute pressure in [𝑏𝑎𝑟].
Table 2.3: Scaling function parameters for pressure transmitters.
Sensor Range A B
A63HGP1 0-10 bar(a) 625 -2.5
A63HGP2 0-10 bar(a) 625 -2.5
A63HGM1 0-10 bar(a) 625 -2.5
A63HGM2 0-10 bar(a) 625 -2.5
A63GM 0-10 bar(a) 625 -2.5
A63RE 0-1.6 bar 100 -0.4
Proximity Sensors
Technical Report
acquisition dock. In this way, the fuel for the high-calorific gas system can be determined automatically in the LabVIEW application.
Optical Flame Monitoring
Around the combustor, an optical flame monitoring system (BFI CFC 2000 UV1) is registering whether there is a flame or not for the 3B combustor. The system sends out signals for the flame intensity (percentage) and a digital signal to show whether there is a flame determined or not. The signal for intensity is a current signal between 4 and 20 mA, where 4 mA is equivalent to 0% and 20 mA to 100%. The linear scaling equation for the flame intensity is given in equation 2.4.
𝐼 = 6250𝑥 − 25 2.4
Where:
𝐼 is the flame intensity in [%].
Humidity Sensors
To determine ambient and room conditions, two humidity sensors are used in the LabVIEW application. Both are used to measure relative humidity, which is given between 0 and 100%. Therefore, the signal between 4 and 20 mA is scaled using the standard equation for percentages, see equation 2.5.
𝐻 = 6250𝑥 − 25 2.5
Where:
𝐻 is relative humidity in [%]
2.4
Automatization
In this section, the automatization of the combustion test cell components is treated. The
automatization is divided into two parts: controlling the supply panels and controlling the gas mix panel. The control system for the gas mix panel is partly in place: a touchscreen control panel was already in use at the Opaalstraat. This panel was used to control the fuel composition. The control system of the gas mix panel was extended to the LabVIEW application. The main and combustor supply panels are completely new, so the automatization of the combustion test cell components has been implemented in the LabVIEW application.
2.4.1
Control panels
To control all components of the combustion test cell via a LabVIEW application, the DSC module (Datalogging and Supervisory Control) is required. The module allows the LabVIEW user to communicate to the PLC that is in the control cabinet of the combustion test cell. During communication, the Modbus communication protocol is used. Modbus is a method used for transmitting information over serial lines between electronic devices. The device requesting the information is called the Modbus master and the devices supplying information are Modbus Slaves [6]. It has become the standard communication protocol for connecting a large range of industrial devices. In the combustion test cell, the Modbus TCP protocol is used, which means that
communication is done via an Ethernet connection.
Technical Report
There are 65.536 (216) addresses for each type. Via these addresses, LabVIEW can read or write the status of a component of the combustion test cell.
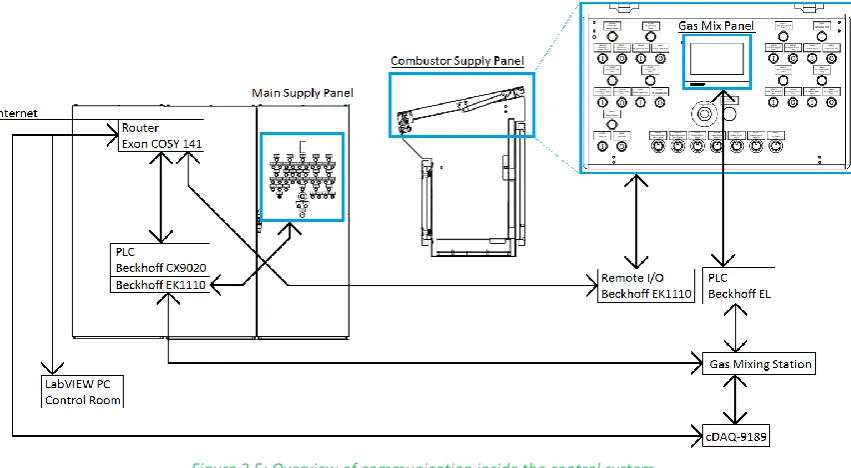
[image:14.595.85.511.254.488.2]The PLC is the heart of the control system. Via a router both sides can communicate with the PLC. The LabVIEW application or the supply panels sends commands to the PLC and the PLC transfers these commands to the different components in the combustion test cell. There are two supply panels in the system: a combustor supply panel, close to the combustor and the main supply panel. The LabVIEW application plays the role of Modbus Master and forces the PLC, which is the Modbus Slave, to start or stop test cell components. Since the control panels are also Modbus Masters, the LabVIEW application also must read the actual status from the PLC. Figure 2. gives an overview of the components that are relevant to the control system and how they communicate.
Figure 2.5: Overview of communication inside the control system.
In Figure 2., blue boxes are the control panels, black boxes are the communication systems. A more detailed picture of the control panels is given in Appendix G: Control panels. There are several processes going on in the control system:
- The router in the control cabinet is connected to internet. The router is wired to the LabVIEW pc, the CX9020 PLC, the data acquisition dock cDAQ-9189 and the Remote I/O system in the combustor supply panel. All four components are connected to each other via the router.
- The Beckhoff EL touchscreen PLC is used for the gas mix panel in the combustor supply panel. Both the PLC and the cDAQ-9189 are wired to the gas mixing station.
- The remote I/O communicates to the CX9020 PLC via the router connection.
- The combination of the CX9020 PLC and the EK1110 extension receive all statuses and commands from the supply panels. Via the router, the LabVIEW pc receives these
commands. This communication system is also turned around, so that the LabVIEW pc can control the commands of the supply panels.
Technical Report
The second address is used for reading or writing operation status and the third address is used for reading or writing the control value.
There are three different options regarding controlling components in the combustion test cell: - A system that can both control the operation status and the control value, such as the
combustion air fan (tag name W88CA). The status of the air fan can be started and stopped. Furthermore, the user of the test cell can control the fan is started, the capacity of the fan can be controlled between 80% and 100%. For the capacity, a slider control is implemented in the LabVIEW application.
- A system that controls only the operation status and a system that only controls the control values. The high-pressure diesel pump in the liquid fuel system is an example of the second case. The pump can be either started or stopped.
- The third case applies to potentiometers that are used by for example the control valve position of the Liquid Fuel system A. In this system, only the position of the valve is controlled, while the valve is always on.
To explain the idea behind the control system, the combustion air heater, W88CA, is used as an example, since this system controls of both the control value and the operation status.
In Table 2.4: Commands in PLC software per address. it is shown that the operational status and the control value are used. For W88CA, the three register addresses are 32768, 32769 and 32770. On one hand, LabVIEW writes the operation status to address 32769 and the control status to address 32770. In both cases, holding registers are used for this. On the other hand, LabVIEW reads the operation status and control status from an input register, which is read only. The address for the reading operation is then 32768 to determine the actual running status.
Due to the ambiguity of the control system, the LabVIEW is not always used as the way of controlling the combustion test cell. Sometimes it is desired to control the combustion test cell using the supply panels shown in Appendix G: Control panels. Therefore, the software of the PLC is programmed in such a way that LabVIEW can take over the control over each component in the combustion test cell. To do this, LabVIEW needs to send a signal to take over the control, while the same functionality should be added to give the controls back to the supply panels.
Table 2.4: Commands in PLC software per address.
Addresses LabVIEW to PLC PLC to LabVIEW 32768 W88CA_RunStatus W88CA_RunStatus
32769 W88CA_Operation W88CA_Operation
32770 W88CA_ControlValue W88CA_Control Value
To make sure that communication between LabVIEW and the PLC is still active, a counter was implemented in the software of the PLC. The software sends a certain value and the LabVIEW application must read this value and add 1 to this value. Then LabVIEW should send this value back to the PLC software. This process happens repeatedly. When communication between the PLC and LabVIEW is shut down by any unexpected reason, the counter is stopped and automatically, the control panels are activated. This way, the supply panels can take over the control system again when it is not possible for the user to give the supply panels access.
Technical Report
status regarding safety. For the High-calorific gas system, ZW20HGCTRL controls the isolation valve ZW20HGI and the vent valve ZW20HGV of the combustion test cell. In the control system
ZW20HGICT and ZW20HGVCT are only reading the status. The exact same concept is used for the natural gas system: ZW20NGCTRL controls both ZW20HGVCT and ZW20HGICT simultaneously, while in the control system only the operation status of ZW20NGVCT and ZW20NGICT.
2.4.2
Gas mix panel
The second part of the automatization of the combustion test cell is controlling the gas mix panel via LabVIEW. In the gas mix panel, the composition of a gas mixture can be chosen. In this composition, one of the hydrocarbons (propane, methane or natural gas) is selected and combined with other flammable components and dilutants.
The control panel was already in place at the Opaalstraat and now, the touchscreen is placed in the combustor supply panel. In the LabVIEW application, a system to control the variables in the software of the touchscreen is implemented. In Appendix F: Data binding for gas mix control, the variables in the system are given.
The LabVIEW application is used to control the variables that are already present in the PLC software of the gas mix panel. An overview of the user interface of the gas mix panel is shown in Figure 2.6: Picture of user interface on the gas mix supply panel for percentage mode (left) and flow mode (right). . There are two control options: the flow mode and the percentage mode. For the flow mode, the flow rate of each fuel component can be controlled in NL/min (Normal Liter per minute). The normal liter stands for the volume for normal conditions, where normal is a temperature of 0 °C and an absolute pressure of 1 atm. In the percentage mode, the fuel composition is set and based on a selected total flow rate, the flow rate of each component is calculated automatically.
Figure 2.6: Picture of user interface on the gas mix supply panel for percentage mode (left) and flow mode (right).
Technical Report
3
Requirements
In the previous chapter, all components and systems present in the combustion test cell are elaborated. In this section, requirements for the LabVIEW application for the combustion test cell are presented. It is intended to process these requirements in the application.
3.1
Data acquisition system
For the data acquisition system, the following targets were identified: - Clear code for the data acquisition system.
- Add new sensors to the application.
- Clear user interface with updated sensors and systems (e.g. environment & ventilation) - Main panel for quick overview.
- Having the right headers and units in the measurement files.
- Implement calibration tab to evaluate all systems in the combustion test cell. - Implement the flow chart presentation in same way as for the P&ID.
- Mass flow controller for combustion air, since the current combustion air fan operates irregularly.
- Implement subdivision of systems.
- Ways to show behavior of characteristics over time.
- Implement automatic fuel selection for the high-calorific system for control. - Add a tab to see how the total heat input is built up.
- Ventilation filter replacement warning sign.
3.2
Control system
For the control system, which is newly added, the following targets were identified. - Develop a system that can control each type of test cell component in LabVIEW. - Adapt the control system to the software of the PLC in the control cabinet. - Read actual status of systems in the combustion test cell.
- Check for communication to prevent problems when the connection between PLC and the LabVIEW pc is lost.
Technical Report
4
Approach
Based on the chapter Background information, the desired systems as given in Requirements must be integrated into the LabVIEW application of the combustion test cell. This chapter is dedicated to clarify the approach that has been taken to translate the specifications into a LabVIEW application for the combustion test cell. Separate approaches are taken for the data acquisition and control system. For data acquisition, raw signals are used to calculate characteristics related to combustor performance. For the control system, the goal is to be able to control the
combustion test cell behind the desk.
After the LabVIEW code was finished for the separate systems, they were merged to one LabVIEW Project. Using this approach, the validity of the code for each system was proven before working in one file.
4.1
Data acquisition system
To make a start on the data acquisition system, the LabVIEW application that was already in place for the combustion test cell at the Opaalstraat was used. Features that were already working were integrated in the new application with changes regarding clarity of the LabVIEW code. Also, the XZ-table controls were already in place and it was decided to keep the full XZ-XZ-table system in the application. Also, equations to calculate heat inputs of fuel systems were already in place and working, so with slight changes, these code blocks were reused.
In the application for the Opaalstraat, wiring of the block diagram created an unclear LabVIEW code. In the new application, wiring in the block diagram has been minimized by local variables. These local variables can be placed anywhere inside the code without wiring. Furthermore, the presentation of results has been changed. In the new application, LabVIEW graphs are replaced by charts in which new measurements are added to the plot. Charts give insight in the behavior over time.
In LabVIEW, the block diagram for the data acquisition system was divided into three parts. The data acquisition, the calculations and the data collection. They are all placed inside one loop. At the top of the loop, the acquisition of the measurement data is done. Below, the measurement data are analyzed for the three main systems: fuel, combustor and environment. In the end, all data are collected and written to a measurement file that is used for further combustor performance analysis. The structure for the data acquisition system is shown in Figure 4.1.
4.2
Control system
The code structure for programming a Modbus communication system in LabVIEW was retrieved from example cases. Based on the combustion test cell, a control system was prepared for testing the communication with the PLC software. The control system for the gas mix panel was set up based on the OPC communication protocol in collaboration with the supplier of the gas mixing station control panel.
Technical Report
control modes are integrated: the percentage mode and the flow mode. To overview of the LabVIEW code for the control system is shown in Figure 4.2.
Figure 4.1: Code structure for data acquisition in LabVIEW.
Technical Report
5
Data acquisition system
5.1
Setup of data acquisition system
In the LabVIEW code for the data acquisition system, the division into the three main systems has been used. The three systems have also been divided. The structure in the block diagram has been as follows:
1. Fuel Systems - Liquid fuel
- Gas mixing station - High-calorific gas 2. Combustion Systems
- Combustion air supply - Combustion temperature - Flame temperature - Exhaust temperature
- Flame monitoring (3B combustor only) 3. Environment and Ventilation System
- Ambient conditions
- Combustion test cell conditions - Ventilation
The general approach to the block diagram is to first obtain the raw sensor signals, then convert them for calculations to the right units and physically correct values. After several calculations on the combustor performance are carried out, the converted and calculated signals are combined in one array and then collected by a measurement file. To use the structure, two features in LabVIEW are very important: dynamic data and local variables.
The dynamic data type is used in case of so-called express VI’s, such as the DAQ Assistant. The data
are stored in an array that adds every new value on top, while holding the older values. Figure 5.1: Dynamic data type in LabVIEW. shows how dynamic data look like in the block diagram and in the front panel. The dynamic data on the front panel can be hidden, since they do not show data in a user-friendly way.
Local variables can be created for any type of indicator such as charts or the dynamic data array. The result is that the data can be used throughout the block diagram, which increases readability of a block diagram.
Figure 5.1: Dynamic data type in LabVIEW.
Technical Report
A80C3H8 signal somewhere else in the block diagram. After the scaling from mA to NL/min. The calculated flow rate in NL/min is then also stored in a dynamic data box.
Figure 5.2: Applied structure in LabVIEW block diagram.
For the user interface of the application, it was decided to implement a tab control panel, in which the user can switch between tabs that are related to subsystems of the combustion test cell. The following tabs are introduced in the interface for the data acquisition part.
- Main Panel. This is the screen that is shown to retrieve information of all
subsystems. It gives an overview of what is happening in one overview. Important data of each subsystem are presented in a compact way.
- Calibration tab. In the calibration tab, all sensor measurements are shown in alphabetic order to make looking for a certain sensor easier. In this tab, the processed values are shown, so these are the values that appear after scaling the current signals. So, in case there seems to be a malfunctioning sensor, it can be easily determined which sensor is malfunctioning.
- Combustion air supply tab. In this tab, all measurements in the combustion air system are shown. Furthermore, the mass flow rate of air entering the air heater is shown in multiple ways to give insight in the behavior of the system.
- Combustor systems. In this tab, all systems that are close to the combustor are treated. Combustion temperatures, flame temperatures and exhaust gas temperatures are shown and their behavior over time. Furthermore, the optical flame monitoring system is placed in this tab, since the flame inside the
combustor is monitored.
- Each fuel system has a separate tab. In each of the tabs, fuel properties or the fuels used in the experiment are controlled for calculations. Furthermore, all relevant measurements and calculated values are shown. Inside the gas mix tab, the control system for the gas mixture composition is placed.
- A tab has been added to present the heat inputs for each system and subsystems like Liquid Fuel A and Liquid Fuel B. Also, the total heat input to the system is shown. Furthermore, the heat inputs over time are shown in a chart.
- A tab to present the values for the newly integrated sensors that measure the ambient and room conditions is added. In this tab, also the ventilation is considered and a warning light is added to light up when the ventilation filter needs replacement.
Technical Report
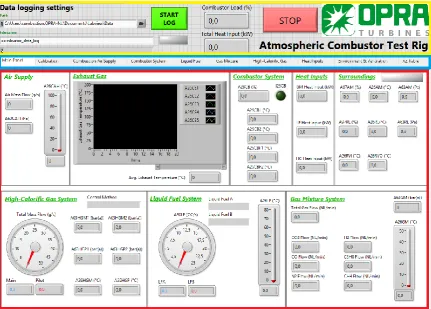
[image:22.595.82.514.197.506.2]The header of the application, which is placed above the tab control for the data acquisition system, is kept the same as for the LabVIEW application at the Opaalstraat, since it worked fine already. Figure 5.3 shows an overview of the user interface for the data acquisition part of the LabVIEW application. The yellow box shows the header, the blue box the tab control and the red box shows the data acquisition results. In this figure, the main panel is shown, but different tabs can be selected in the tab control.
Figure 5.3: Overview of the data acquisition part of user interface for the LabVIEW application.
5.2
Data acquisition
The data acquisition part of the LabVIEW code starts with the DAQ assistant. The DAQ assistant makes it possible to read out all output channels of the cDAQ-9189 in one function block. For the combustion test cell, one DAQ assistant has been used to read analog signals, and one DAQ assistant is used to read all digital signals. In the DAQ assistant, the sample rate and the number of samples per measurement can be set for all signals.
To be able to do continuous measurements, the whole data acquisition part of the LabVIEW application code is placed inside a while loop. The analog signals are separated into temperature signals in °C and current signals in mA. The properties of each sensor are edited during setup of the DAQ Assistant. After the analog signals are divided into two groups, each sensor signal is assigned to a dynamic data block where the measured values are stored.
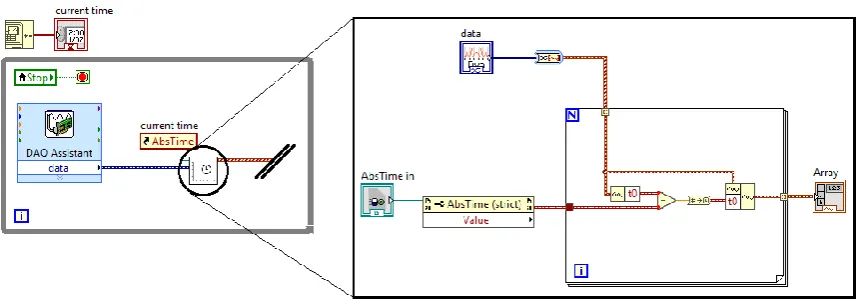
Technical Report
Figure 5.4: Setting the starting time of all incoming signals to zero.
5.3
Calculations and User Interface
The block diagram and the translation to the front panel of the LabVIEW application is discussed for each subsystem in the order that is given in this chapter. It was decided to start at the code in the block diagram and then show how it translates to the user interface. For the user interface, it was decided to follow the flowlines in the P&ID [2] for the combustion test cell.
5.3.1
Liquid Fuel System
The liquid fuel system has its own tab. In its current state, the following results are in the tab: - A26LF, the temperature of the liquid fuel in system B or the high-pressure diesel system in
[°C]
- A80LFA, the flow rate of liquid fuel system A in [mA] - A80LFB, the flow rate of liquid fuel system B in [mA]
[image:23.595.83.514.104.255.2]In the LabVIEW code, the flow rates A80LFA and A80LFB are converted. The current signal which ranges from 4 to 20 mA is scaled to a signal that ranges from 0 to 25 cc/s. For the scaling, a subVI is made, so that scaling functions are implemented in a compact way. The subVI that is used to scale A80LFA is shown in Figure 5.5. Negative values are filtered out by selecting only positive values or zero. Since A80LFA and A80LFB are treated identically, only A80LFA is treated in this section.
Figure 5.5: Scaling A80LFA to [𝑐𝑐 𝑠⁄ ].
After the scaling, has been carried out, the heat input per system can be calculated with the flow rates and product of density and lower heating value of the fuel that is used in the experiment. For fuels as diesel, ethanol, pyrolysis oil and liquid propane the product has been determined, but in the case a different liquid fuel type is used, its density and LHV can be entered in the LabVIEW application. The individual heat inputs are calculated by equation 5.1.
𝑄 = 𝑉̇.𝜌. 𝐿𝐻𝑉 1000
5.1
Technical Report
𝑄 is the heat input in [𝑘𝑊]
𝜌 is the density of the fuel in [𝑘𝑔/𝑚3]
𝑉̇ is the fuel flow rate in [𝑐𝑐/𝑠].
𝐿𝐻𝑉 is the Lower Heating Value of the fuel in [𝑀𝐽/𝑘𝑔]
In case the value of the heat input is smaller than 10 kW, it is neglected to filter measurements in case of a flow rate of zero. In the end, the heat inputs from LFA and LFB are combined to
[image:24.595.206.393.581.651.2]determine the total heat input for the liquid fuel system. Figure 5.6 shows the heat input calculation in the block diagram.
Figure 5.6: Calculation of heat input for the liquid fuel system.
In the user interface, the following values need to be presented: - A26LF, liquid fuel temperature in [°C]
- A80LFA, liquid fuel flow rate A in [cc/s] and [L/min] - A80LFB, liquid fuel flow rate B in [cc/s] and [L/min] - Heat Input A in [kW]
- Heat Input B in [kW] - Total Heat Input in [kW]
The liquid fuel tab is split in three parts: the part where the liquid fuel properties can be defined, the part where the measured values are shown and a part where the whole Liquid Fuel system is shown in a flow diagram. In this flow diagram, measured values are shown and the status of a test cell component is shown.
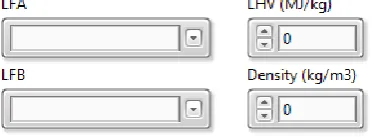
For the fuel selection, the liquid fuel that is stored in the liquid tanks in the combustion test cell should be selected. In case a custom fuel is used, the specification for LHV and density must be entered by the operator. Figure 5.7 shows the control elements in the liquid fuel tab.
Figure 5.7: Properties for the liquid fuel calculations.
Technical Report
Figure 5.8: Data presentation of liquid fuel system.
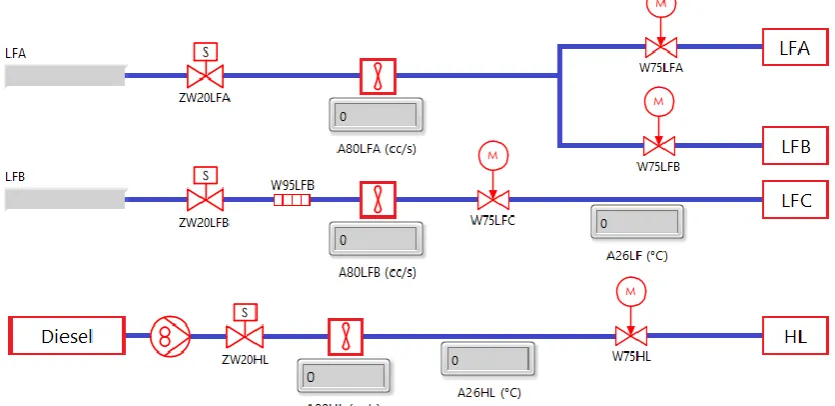
In the last part, the user interface is based on the P&ID flows [2] . The result is shown in Figure 5.9. Components that are controlled are also integrated in this system. Since it is an overview, only tag names are used. Although the sensors of the high-pressure liquid fuel system are not connected to the cDAQ-9189 yet, the system has already been integrated in the liquid fuel tab.
Figure 5.9: Flow diagram for liquid fuel system.
5.3.2
Gas-mixing Station
In the tab for the gas mixture, the following signals are used: - A80NG, natural gas flow rate in [mA]
- A80C3H8, gas mixture component flow in [mA], same holds for CH4, H2, N2, CO2 and CO. - A63GM, gas mixture supply pressure in [mA]
- A26GM, gas mixture supply temperature in [°C]
First, all current signals are scaled using the scaling equations given in the paragraph Sensors. The scaling calculations have been placed in a subVI. The flow rates are scaled to NL/min and the
A63GM is scaled to bar(a). To prevent noise, all flowrate signals are “thresholded”: very small flow
rates are neglected because to increase clarity of the data presentation and logging. The control system inside the gas mixing tab of the LabVIEW application is treated later under automatization.
Technical Report
Figure 5.10: Thresholding code for gas flows.
The thresholded signal processing is used for multiple calculations. First, they are summed, so that the total gas flow for the gas mixture can be determined. This total flow is then used in
combination with the thresholded flows and the molar volume of the individual components to determine the mole fractions. The subVI for determining these fractions is shown in Figure 5.11. After the volume fraction is determined, the fraction is divided by the molar volume. When summing the determined moles per volume, the mole fraction for each individual component is calculated.
Figure 5.11: Converting flow rate to mole fraction.
The thresholded flows and the mole fractions are used to finally calculate the Lower Heating Value of the fuel composition and the total heat input of the gas mixing system.
The heat input is calculated in three steps: first the flows of the flammable components, which are C3H8, CH4, H2 and CO are converted to NL per second. Then multiplying the flows by the Lower Heating Value (MJ/Nm3) yields the heat input of the individual components. After the values are summed, the total heat input is determined. Then the LHV of the gas mixture is determined by dividing the heat input by the total gas flow out of the gas mixing system in NL/seconds. For presentation of the results, a conversion to the LHV in Btu/SCF is determined. The code is shown in Figure 5.12. It is placed inside of a subVI for clarity. Furthermore, the mole fractions are used to calculate the LHV of the gas mixture in MJ/kg.
Technical Report
The following results are shown in the user interface of the gas mix panel: - A26GM, gas mixture supply temperature in [°C]
- A63GM, gas mixture supply pressure in [bar(a)]
- A80C3H8, gas mixture component flow in [NL/min], same hold for the other gases. - Total gas flow in [NL/min]
- LHV of the mixture in [MJ/kg], [Btu/SCF], [MJ/kg] and [Btu/lb].
The upper part of the user interface consists of a flow diagram that is based on the P&ID [2], as can be seen in Figure 5.13.On the left, the gas flows of the individual mixture components are given in NL/min. The status of the heaters and valves in the gas mix panel is shown, so that one can see which hydrocarbon is chosen for the mixture. After the mixture is composed, its pressure and temperature are shown.
Figure 5.13: Flow diagram for the gas mix panel.
The second part of the user interface, see Figure 5.14 shows the properties of the gas mixture in a visual way. The gas mixing chart presents the gas flow of each component over time. For the temperature, a thermometer is used and for all other values, an indicator box is shown. The Lower Heating Values are shown in 4 different units.
Technical Report
5.3.3
High-calorific Gas System
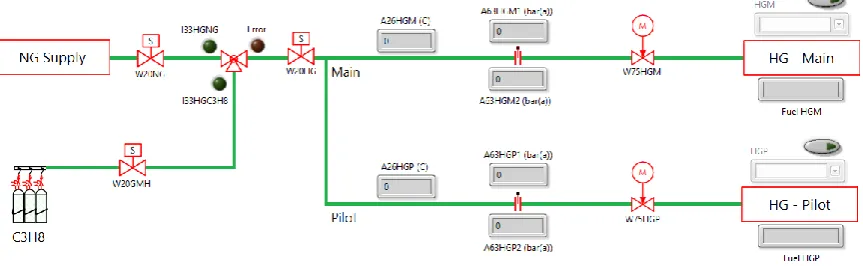
In the High-calorific gas system, the following measurements are done: - A26HGM, temperature over orifice in main system in [°C] - A26HGP, temperature over orifice in pilot system in [°C] - A63HGM1, inlet pressure of orifice in main system in [mA] - A63HGM2, outlet pressure of orifice in main system in [mA] - A63HGP1, inlet pressure of orifice in pilot system in [mA] - A63HGP2, outlet pressure of orifice in pilot system in [mA] - I33HGC3H8, Boolean signal when propane is used [-] - I33HGNG, Boolean signal when natural gas is used [-]
The system either uses natural gas or propane. This is controlled by a hand valve. The position of this hand valve is determined by a proximity sensor in this system. In case natural gas is selected, the proximity sensor sends a digital signal to the LabVIEW application. The position of the hand valve thus sets the fuel properties that are needed to calculate the heat inputs. The following values are required for the calculation: the heat capacity ratio 𝜅, the gas constant 𝑅 and the Lower Heating Value in 𝑀𝐽/𝑘𝑔.
First, the determined pressures are scaled from mA to bar(a). The paragraph Sensors shows which scaling equations in the high-calorific gas system are used. Furthermore, the control method and the fuel must be selected. The control method can be either automatic or manual. Automatic means that the position of the hand valve is used to control the calculations, which will be used in most cases. Manual is used in case it is desired to use air instead of natural gas or propane. When one of the cases is selected, the indicators for the other case are disabled, since otherwise both calculations are carried out.
Each control methods activates a case. For the automatic case, the fuel type selection is based on the status of the digital signal I33HGC3H8. If this signal is true, the fuel selectors for the pilot and
main automatically show “Propane” and the relevant properties are automatically used in the
calculations. If the signal is false, the fuel selectors automatically select the properties of natural gas to the calculations. When both signals are true or false, an error LED will light up and all fuel properties are then set to 0, so that the high-calorific gas properties for the calculations are set to zero. These nested cases are shown in Figure 5.15.
In the block diagram, the fuel properties are connected to indicators. These indicators are hidden in the front panel, because they are only used to transmit the values to the calculations using local variables.
The high-calorific fuel system contains an orifice in the piping for both the pilot and the main. The principle of orifice mass flow choking is used to calculate the mass flow of the fuel during an experiment. In the first step, the Mach number over the orifices are determined. For this
calculation, the pressure transmitters around the orifice are used. After the pressures are scaled, the Mach number over the orifices that are in the fuel system is calculated using equation 5.2.
𝑀 =√2 ⋅ (𝑝1 𝑝2 ) 𝜅−1 𝜅 −1 𝜅−1 5.2 Where:
Technical Report
𝑝1 = inlet pressure of orifice [bar(a)]
𝜅 = heat capacity ratio [-]
Another value that must be calculated is the orifice discharge coefficient, see equation 5.3. This value is based on the orifice characteristics and the pressure ratio over the orifice.
𝐶𝑑= −0.039. . (
𝑝1
𝑝2
)
2
+ 0.262. . (𝑝1 𝑝2
) + 0.405.. 5.3
If the value is larger than 2.3, 𝐶𝑑 is automatically set to 0.80096.
Figure 5.15: Selection of the high-calorific gas fuel.
The measured and calculated values are used to determine the mass flow of the fuel in the pilot and main. Dependent on the Mach number in the fuel systems either one of the equations below are used. Equation 5.4 is applied when 𝑀 ≥ 1 and equation 5.5 is applied when 𝑀 < 1.
𝑀 ≥ 1 𝑚̇ =𝐷. 𝐶𝑑. 𝑝1
√𝑇 √ 𝜅 𝑅(
𝜅 + 1 2 )
− 𝜅+1
2(𝜅−1)
5.4
𝑀 < 1 𝑚̇ =𝐷. 𝐶𝑑. 𝑝1
√𝑇 √ 𝜅
𝑅𝑀 (1 + 𝜅 − 1
2 𝑀
2)
− 𝜅+1
2(𝜅−1) 5.5
Where:
𝑚̇ = mass flow in [𝑘𝑔/𝑠]
𝐷 = flow area in [𝑚2]
𝐶𝑑 = orifice discharge coefficient [-]
𝑝1 = inlet pressure orifice in [𝑃𝑎]
𝑇 = temperature over the orifice in [𝐾]
𝜅 = heat capacity ratio [-]
𝑅 = Gas constant in [𝐽 𝑘𝑔 ⋅ 𝐾⁄ ]
Technical Report
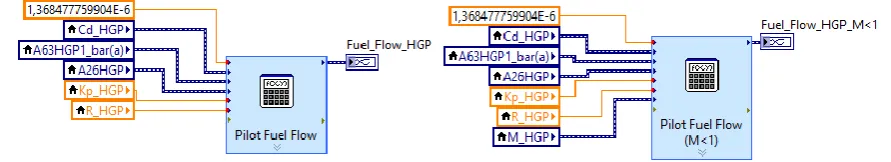
Figure 5.16: Calculation of fuel flow in block diagram.
After the fuel mass flow is determined for the following cases: - Pilot, M<1
- Pilot, M=1 - Main, M<1
- Main, M=1
The main and pilot Mach numbers are used to determine the appropriate outcome. The other two results are discarded. For the part of controlling the calculations, a switch is added to set the mass flow to zero when the high-calorific fuel system is not in use during an experiment. Finally, the heat input is determined by filling in equation 5.6.
𝑄 = 𝑚̇. 𝐿𝐻𝑉 5.6
Where:
𝑄 is the heat input in [𝑘𝑊]
𝑚̇ is the fuel mass flow in [𝑘𝑔/𝑠]
𝐿𝐻𝑉 is the Lower Heating Value in [𝑀𝐽/𝑘𝑔]
The lower heating value of the selected fuel (in MJ/kg) is used for the calculation. To prevent noise in case of a low heat input in either the pilot or main, a threshold has been applied, so that heat inputs below 10 kW are not shown. The described steps in the block diagram are shown in Figure 5.17for the High-calorific Main. For the Pilot, the exact same steps have been taken.
Figure 5.17: Calculation of the heat inputs for the high-calorific main system.
The following measured and calculated data must be shown in the user interface of LabVIEW: - A26HGM, temperature over orifice in main system in [°C]
- A26HGP, temperature over orifice in pilot system in [°C] - A63HGM1, inlet pressure of orifice in main system in [bar(a)] - A63HGM2, outlet pressure of orifice in main system in [bar(a)] - A63HGP1, inlet pressure of orifice in pilot system in [bar(a)] - A63HGP2, outlet pressure of orifice in pilot system in [bar(a)] - Main Mass Flow [kg/s]
[image:30.595.79.515.499.590.2]Technical Report
The High-calorific Gas tab is split into two parts: an overview of all measurement and states of the components of the combustion test cell and a part where all measurements are shown. The
[image:31.595.85.517.190.323.2]control method is set to “Automatic” by default. In Figure 5.18, the user interface for the overview is shown. In case of automatic control, the selection box is disabled. In the manual case, it would be the other way around. The switch above the selection box is used to use the calculated heat inputs or not.
Figure 5.18: Flow diagram of high-calorific gas system.
In Figure 5.19, the measured values and calculated mass flows for the main and pilot system are shown. During operation, the meters show both the value for the pilot and the main. The blue needle is assigned to the indicator with the blue letters and the red needle belongs to the red text.
Figure 5.19: Presentation of measured and calculated values.
5.3.4
Heat Inputs
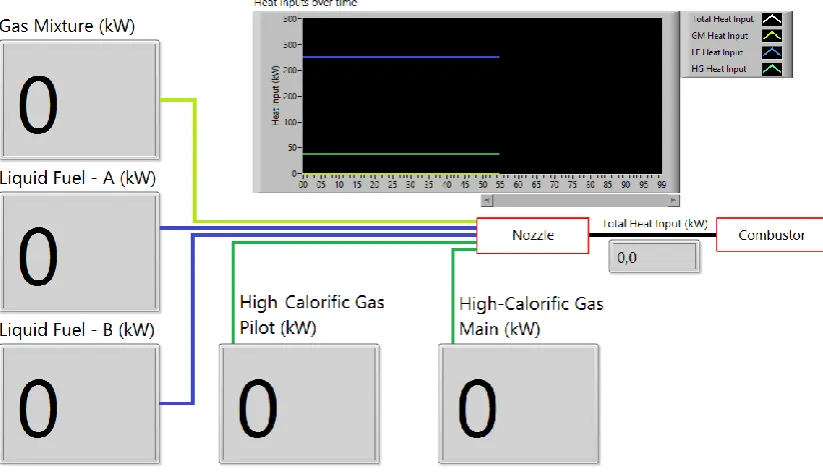
The heat inputs of the individual fuel systems are calculated, but not shown in the respective tabs. In the Heat Inputs tab, the heat inputs for each of the five fuel systems are shown. These inputs have all been calculated already in the LabVIEW code. For the total heat input, all heat inputs of the subsystems are summed. Based on the total heat input in [𝑘𝑊], the combustor load is determined. These two values are also placed in the header of the application. Because of the formula function blocks in the High-calorific Gas system, the time-scale of the signals is scaled for a second time, in the same way as shown in Figure 5.4. The formula block resets the time settings for the HG Heat input, and therefore each signal the time is made in such a way that the chart in the LabVIEW application starts at t=0. It can be seen as a way of improving the presentation of the data.
In Figure 5.20, the heat inputs are shown in big boxes because when the heat inputs are controlled in the combustion test cell, the values should still be readable when standing behind the
[image:31.595.81.517.399.524.2]Technical Report
Figure 5.20: Heat Inputs tab in LabVIEW application.
5.3.5
Combustion Air System
In the combustion air system, the following measurements are done: - A26CAC, temperature of cold combustion air in [°C]
- A26CAH, temperature of hot combustion air in [°C] - A63CAC, pressure of cold combustion air in [mA] - A63CAH, pressure of hot combustion air in [mA]
- A63CAJC, pressure drop over an orifice in cold air zone in [mA]
The analysis is focused of converting the incoming signals for the calculation of the mass flow rate of air, as can be seen in Figure 5.21, pressures are scaled to Pascals and the incoming air
temperature is converted to Kelvin. The differential pressuring the cold air section is then added to the room pressure in the combustion test cell to determine the absolute pressure.
Using on the ideal gas law, the mass flow rate at which air is entering the combustion air system is calculated in the subVI “Air Mass Flow”.
Figure 5.21: Combustion Air calculations.
The following results are shown in the combustion tab: - A26CAC in [°C]
[image:32.595.124.509.577.686.2]Technical Report
- A63CAJC in [Pa]
- Combustion air supply in [g/s].
All pressures are converted to Pascal. Furthermore, the calculated combustion air supply is the most important result of the code.
[image:33.595.85.513.253.476.2]The user interface combustion air system in the LabVIEW application, as shown in Figure 5.22, is divided into two parts: the flow diagram for the overview and a part that helps with observing the combustion air mass flow when standing behind the combustor supply panel. A large indicator box was added to this system, specifically to control the air fan behind the combustor supply panel.
Figure 5.22: Combustion air tab.
5.3.6
Combustor Systems
Since in the combustor system most signals are thermocouple signals, almost no scaling or post processing was needed in this section. The measured values are shown in indicator boxes and in charts, so that the behavior of combustion temperature, flame temperature, exhaust temperature and flame intensity over time can be evaluated. In Figure 5.23, the charts in the combustor system tab are shown.
Regarding the optical flame monitoring, the flame intensity is determined via the scaling equation given in the paragraph Sensors.
5.3.7
Calibration Tab
The calibration tab shows all measured values in the desired units, so after scaling has been applied. In this tab, it is possible to search for a signal when calibrating al sensors. The signals are placed in alphabetical order.
5.3.8
Environment and Ventilation systems
In the new combustion test cell, sensors to measure the ambient and room conditions are available. Furthermore, sensors are now equipped for the ventilation system. The following measurements are done:
Technical Report
- A63AM, ambient pressure in [mA] - A26AM, ambient temperature in [mA] - A97RE, test cell humidity in [mA] - A63RE, test cell pressure in [mA] - A26RE, test cell temperature in [°C]
- A26RVI, test cell ventilation inlet temperature in [°C] - A26RVO, test cell ventilation outlet temperature in [°C]
[image:34.595.86.515.226.415.2]- A63RVJF, differential pressure over room ventilation filter in [mA]
Figure 5.23: User interface for the combustor systems.
On these sensors, only basic scaling is done, except for the differential pressure measurement for the ventilation filter. After the signal is converted to mbar, the value is compared to the maximum pressure difference of 450 Pa [5]. In case the pressure difference exceeds this value, the filter of the room ventilation should be replaced. This is shown by a warning message that is placed in the Environment & Ventilation tab. The corresponding code is shown in Figure 5.24.
Figure 5.24: Code to warn for a filter replacement.
[image:34.595.110.489.518.652.2]Technical Report
Figure 5.25: Environment & Ventilation system in front panel.
5.3.9
Main Panel
The main panel is a tab that summarizes the results of all tabs, so that a global overview is provided for the user of the LabVIEW application. The main panel shows the actual status of the combustion test cell. Therefore, it is decided to use meters, thermometers and indicator boxes for most systems, since charts would use a lot of space. In case the behavior of a property over time should be evaluated, the tabs of the relevant subsystem can be used for that. Only the exhaust gas temperatures are shown in a chart. Figure 5.26 shows the main panel.
[image:35.595.81.517.462.718.2]Technical Report
5.4
Data Collection
After all relevant values are calculated in the LabVIEW code, the data should be collected at the end. The measurement file contains measurements in the desired units and results of calculations, like heat inputs or the combustion air mass flow.
The collection of data is done in an inverse way to the data acquisition from the DAQ assistant. Local variables to all values that contribute to the further analysis of the combustor performance are placed at the end of the code, under the calculations for the LabVIEW application. The following types of data are characterized: current signals (processed), temperature signals (unprocessed, since they are already in the right units) and calculated values like heat inputs and mass flows. The division into three types gives some clarity in the LabVIEW code. All signals of a certain type are merged first and afterwards the three types are merged. All signals together are stored in a dynamic data box that is called “Processed signals”. Figure 5.27 shows the structure of the data collection in the LabVIEW code. For scaled or calculated dynamic data, properties are set by the function blocks between the local variable of the dynamic data and the merging function. In this block, the name of the header in the measurement file is set. Furthermore, the units are also set as a property to have correct units for further analysis in the measurement file.
To make sure that the measurement file runs from the starting time, the actual time of the measurement needs to be used. To make the presentation in the LabVIEW application clear, the actual time was subtracted from the starting time, so that the charts would start at t=0. For the measurement file it is the other way around. Now the actual time needs to be added to t=0, so that in the measurement file, the given time starts at zero. Figure 5.28 shows the code and in Figure 5.29 the resulting measurement file is shown. Afterwards, the resulting signals are
[image:36.595.154.448.442.716.2]connected to a “Write Measurement File” function block in LabVIEW.
Technical Report
Figure 5.28: Code to set back the starting time of the signals to the actual time.
Technical Report
6
Control system
For the control system of the LabVIEW application, the supply panels and the gas mixing panel were used as guideline for the application. All systems that are implemented in the software for the PLC are shown on the right side of the data acquisition part of the LabVIEW application. Figure 6.9 shows the user interface of the control system in the LabVIEW application. The system is divided into three parts.
- On the left, the test cell components of which only the Boolean values can be controlled are shown, such as the diesel pump (W88HL) and the solenoid (safety) valve of the gaseous mixture (ZW20GM). These components are shown on the left.
- In the fuel systems, one button can close or open multiple valves. This system
type is shown in the middle. When clicking on the button “ZW20CTRL ON”, all six
valves in the gas mix panel are opened simultaneously.
- For the third type, on the right, positions of valves are controlled. In the supply panels, potentiometers are used for this, in the LabVIEW application, slider bars are used for this. Valves for liquid fuel system and high-calorific gaseous fuel system are shown. The valves for the gas mix panel are already integrated in the gas mix tab of the data acquisition part of the LabVIEW application.
6.1
Control Panels
The control system in LabVIEW starts with making connection with the control cabinet in the combustion test cell. The IP address of the router is 10.0.2.5. After starting the LabVIEW application, communication is directly established, where LabVIEW is the Modbus master.
The Modbus TCP master instance enters the while loop of the control system. In the while loop, an event structure is used. The structure is shown in Figure 6.1. First reading the status of test cell
components is treated. The idea behind reading the status of the components is that a “reading
[image:38.595.124.473.547.672.2]-operation” is carried out periodically. Therefore, the timeout function is used as the first case. In the LabVIEW code, the loop times out every 250 ms. Inside this case, the code block to read multiple input registers (reading only) is used. The block reads out all word data types for the 255 addresses after 32768, which is the starting address.
Figure 6.1: Basic communication structure of a Modbus master in LabVIEW.
The three types of control systems for different applications, given in paragraph 2.4.1 are used to explain the code behind the front panel. The combustion air fan, liquid fuel valve A and the high-pressure diesel pump are described here. Figure 6.2, Figure 6.3 and Figure 6.4 show the control
systems as they are in the user interface. The working of the buttons, sliders and LED’s that are