148
CECL at SemEval-2019 Task 3: Using Surface Learning for Detecting
Emotion in Textual Conversations
Yves Bestgen
Centre for English Corpus Linguistics Universit´e catholique de Louvain
Place Cardinal Mercier, 10 1348 Louvain-la-Neuve Belgium [email protected]
Abstract
This paper describes the system developed by the Centre for English Corpus Linguistics for the SemEval-2019 Task 3: EmoContext. It aimed at classifying the emotion of a user ut-terance in a textual conversation as happy, sad, angry or other. It is based on a large number of feature types, mainly unigrams and bigrams, which were extracted by a SAS program. The usefulness of the different feature types was evaluated by means of Monte-Carlo resam-pling tests. As this system does not rest on any deep learning component, which is currently considered as the state-of-the-art approach, it can be seen as a possible point of comparison for such kind of systems.
1 Introduction
This paper presents the participation of the Cen-tre for English Corpus Linguistics (CECL) in the SemEval-2019 Task 3 “EmoContext: Contextual Emotion Detection in Text”. The objective of the task is to classify the emotion of a user utterance in a textual conversation with a bot as happy, sad, angry or other. Contextual information is provided by means of the two previous utterances, the one just before, which was produced by the bot, and the first one of the triplet produced by the same person as the third. This task can be seen as a dif-ficult problem in absence of any non-written infor-mation (Gupta et al., 2017).
Because of its recent and important develop-ment for the analysis of big data and especially for natural language processing, deep learning has become the preferred procedure to take up this kind of challenge (Chatterjee et al., 2019a). However, detecting emotion in texts is a well-established field of research for which unsuper-vised approaches have been proposed in content analysis (e.g. Anderson and McMaster, 1982; Bestgen, 1994) as well as less recent supervised
approaches such as SVM (Chatterjee et al., 2019a; Pang and Lee, 2008). SVM has long been con-sidered as the state-of-the-art in text categorization (Joachims, 2002). Therefore, it seemed interesting to get an idea of its effectiveness for the present task in comparison to deep learning approaches that should be used by many participants in this challenge. Trying to determine what level of per-formance can be achieved with a surface learning system was thus the main focus of this study. It should be noted that the developed system does not rely on complementary training data, nor on lexical emotional norms produced manually or au-tomatically (Bestgen and Vincze, 2012), nor on se-mantic knowledge extracted from large databases or large corpora (Miller et al., 1990). However, several attempts have been made to increase its effectiveness by adding more complex features to the usual token n-grams.
The remainder of this report describes the datasets made available for this challenge, the sys-tems developed, and the results obtained as well as the analyses performed to get a better idea of the factors that affect the system performance as well as the usefulness of the various types of features used.
2 Data
The challenge organizers divided the materials into three datasets (see Chatterjee et al. (2019b) for details):
• The learning set (Learn) that contained 30160 instances of which approximately 16.7% of the three emotion categories and the remain-ing 50% of Other,
• The test set (Test) that contained twice as many instances as the Dev set and the same proportion of the four categories as in that set.
The true labels for the Learn set were available from the beginning of the training phase, those for the Dev set on December 10 and those for the Test set after the end of the challenge. Between the beginning of the development phase (August 21, 2018) and the beginning of the test phase (January 18, 2019), it was possible to use Codalab to evalu-ate the systems on the Dev set.
3 Systems
This section describes the systems developed to maximize the approach effectiveness. The feature extraction was performed by means of a custom SAS program running in SAS University (freely available for research at http://www.sas.com/en us/software/university-edition.html). The predictive models used during the development phase were built on the Learn set and evaluated on the Dev set (see section 4 for a justification) by means of the L1-regularized L2-loss Support Vector Machine for classification (L1-L2-SVM) available in the LIBLINEAR package (-s 5, Fan et al., 2008).
3.1 Base System
The main part of the system consists of tokens and tokens n-grams present in the three utterances of an instance to be categorized. First, the utter-ances are processed by a Perl script that group the most frequent contracted forms with their corre-sponding full forms (e.g. I’m >I am). Then, an ad-hoc tokenizer splits each sequence of charac-ters separated by a space in tokens composed of (lowercased) letters, numbers, punctuation marks or emojis, trying not to cut the potential emoticons such as :-) and :D. In the case of tokens composed exclusively of alphabetic characters, the encoder detects the presence of the same character at least three times at the end of the token (e.g. ahhh) and keeps only one occurrence.
The features for the SVM were generated from these tokens. These are mainly unigrams and bigrams of tokens, present in each utterance, to which a tag is added to keep trace of the utter-ance it comes from. The tokens, bigrams, and tri-grams from the first and the last utterances, those produced by the human participant, are also out-putted without being distinguished by a tag so
that their frequencies add up. The emojis of the first and third utterances are also processed specif-ically. Each token composed of several emojis is not only produced as it is, but the different emojis that compose it are also outputted separately.
Finally, a feature frequency dictionary based on all the available materials, thus also on the Test set, is produced in order to be able to use a min-imum frequency threshold (set in all the analyses reported here at 2). This dictionary is also used to number the features in order to put them in LI-BLINEAR format. The weight of each feature is equal to the logarithm in base 10 of its frequency in the instance to which one is added.
3.2 Extended System
The basic system was extended during the devel-opment period with a series of meta-features that seemed to improve its predictive power. They consist in a dozen simple global statistics com-puted on each of the utterances: number of tokens, number of characters without the spaces, number of capital letters and a potential index of emo-tional intensity based on the number of charac-ters repeated at least three times, the number of emoticons and of emojis (whatever their mean-ing). These statistics were divided by the maxi-mum values observed in the dataset.
Another addition was made specifically for the instances whose third utterance contained only the “yes” token: the content of the first utterance was copied to this third one.
3.3 Parameters
The regularization meta-parameter C of the SVM was optimized using a grid search. Although LIB-LINEAR has a built-in program for optimizing C, we used our optimization program to have more flexibility in choosing the values to test. To take into account the differences between the frequen-cies of the four categories in the Learn and the other two datasets, the LIBLINEAR -wi param-eter, which allows modulating the C parameter ac-cording to the category, was used. The values were set using a heuristic approach.
4 Analyses and Results
de-tails). A first analysis was aimed to determine whether it was possible to extract several devel-opment datasets from the Learn set that produced similar performances to those obtained by using the Dev set provided by the organizers so as to limit the risk of overfitting when only one evalua-tion dataset is used. To this end, ten development samples were independently extracted from the Learn set in such way that they contained exactly the same number of instances in each of the four categories as in the official Dev set1. The results showed that the performances on these ten sam-ples were systematically much higher than those obtained on the Dev set (0.78 vs. 0.69 for the ver-sion of the system available at that time). It would thus seem that the Dev set has specificities that distinguish it quite clearly from the Learn set and therefore all the developments have been made on the Dev set, accepting the risk of overfitting.
4.1 Official Performance on the Test Set
During the test phase, teams were allowed to sub-mit 30 trials during 9 days. The base system (Sys-tem 1) was first submitted to Codalab and obtained a F1µ of 0.7212. The remaining 29 trials were used to try improving performance. Three tracks were followed:
• First, I tried to optimize the number of in-stances assigned to each category in order to obtain better recall and precision values. To this end, I used the L1-regularized logistic re-gression (L1-LR) available in LIBLINEAR (-s 6) which is for the present datasets a lit-tle less effective than the L1-L2-SVM used previously but is able to estimate the prob-abilities of each instance belonging to each class. The most effective approach found was to classify into a category the same number of instances as the one actually presents in the Test set (the needed counts were obtained during the test phase by means of the proce-dure described in Note 1). This system 2 ob-tained a F1µof 0.726.
• Then, the predictions of these two first
sys-1As these analyses were performed before the labels for
the Dev set had been released, I used the number of instances assigned to each category in a submission and the precision and recall for each category outputted by CodaLab for that submission to calculate the actual category frequencies.
2SVM parameters for this system were as following:C= 0.67,w angry = 0.275,w happy = 0.31andw sad = 0.275.
tems were combined to try maximizing the F1s in each category because it was observed that System 1 was less accurate than System 2 for the Angry and Sad categories, but more accurate for the Happy category. Since the prediction differences between the two sys-tems were systematically changes from one emotion category to the Other category or vice versa, but never from one emotion cat-egory to another one, it was easy to combine the two systems by taking the Happy predic-tions of System 1 and the Sad and Angry pre-dictions of System 2 and placing the remain-ing instances in the Other category. This Sys-tem 3 reached a F1µof 0.73.
• Finally, System 3 was combined with a model based only on the third utter-ance. This model was used to move to the Other category instances assigned to one of the three emotional categories for which the probability of membership (provided by the logistic regression) was the lowest. A series of tests carried out on Codalab to optimize the decision rules made it possible to reach the final system performance of 0.736 (F1 Angry=0.7331, F1 Happy=0.7035, F1 Sad=0.7746).
4.2 Factors that Affect the System Performance
The remainder of this report analyzes the impact of several factors, including the different types of features, to the system performance. All these analyses were conducted using various versions of System 1. They aimed at categorizing the Dev set using the Learn set to build the model and the Test set using the Learn and Dev sets to build the model. In these analyses, the L1-L2 SVM was used with the parameters considered as optimal for each evaluation dataset. In order to determine if the observed differences were statistically signif-icant, two Monte-Carlo resampling tests (Howell, 2008, Chap. 18) were used, a test for related sam-ples to compare two different models on the same evaluation set and a test for independent samples to compare the performance on the Dev and Test sets.
dif-Dev Set Test Set
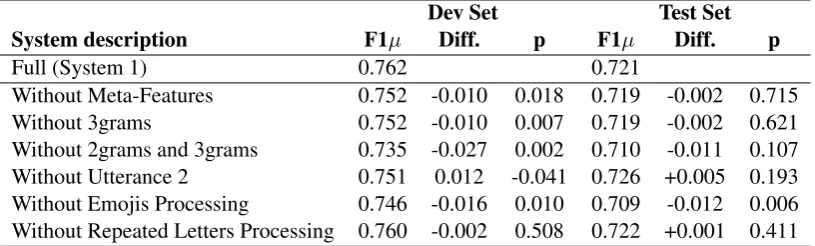
System description F1µ Diff. p F1µ Diff. p
Full (System 1) 0.762 0.721
[image:4.595.96.504.63.186.2]Without Meta-Features 0.752 -0.010 0.018 0.719 -0.002 0.715 Without 3grams 0.752 -0.010 0.007 0.719 -0.002 0.621 Without 2grams and 3grams 0.735 -0.027 0.002 0.710 -0.011 0.107 Without Utterance 2 0.751 0.012 -0.041 0.726 +0.005 0.193 Without Emojis Processing 0.746 -0.016 0.010 0.709 -0.012 0.006 Without Repeated Letters Processing 0.760 -0.002 0.508 0.722 +0.001 0.411
Table 1: F1µ, difference from the full system, and p-value for the ablation approach.
ference was far from being statistically significant (p >0.30).
A second analysis showed that the system was more efficient on the Dev set (0.762) than on the Test set (0.721), a statistically significant differ-ence (p = 0.043). Providing that the Dev and Test sets were randomly extracted from the same sample, this result suggests that the system suffers from overfitting since it was developed on the ba-sis of the Dev set.
The ablation approach was then used to assess the independent contribution of each type of fea-tures to the overall performance. It consists in moving some sets of features of the model and evaluating it. As Table 1 shows, the impact of re-moving feature types was often quite different on the two evaluation sets. Suppressing most of the feature types for the Dev set produced a sizable de-crease in performance while a very small dede-crease or even an increase in performance was observed for the Test set. Significance tests, which compare the ablated systems to the full one, confirm this analysis. Table 1 also shows that the specific treat-ment of emojis seemed particularly useful for both datasets.
A final analysis consisted in constructing a sys-tem from which all feature types in Table 1 were simultaneously removed except the specific treat-ment of emojis. This system obtained a F1µ of 0.743 on the Dev set, a decrease of 0.019, and a F1µof 0.731 on the Test set, an increase of 0.01.
5 Conclusion
The main goal of this study was to try to deter-mine what level of performance could be reached in the EmoContext task by employing a non-deep learning approach. The achieved F1µ was be-tween 0.721 and 0.736, ranking the system ap-proximately in the first quarter of the 165 teams
who submitted a prediction for the Test set, yet far enough from the top teams who achieved a F1µof 0.79. Looking at the other system description pa-pers should allow to find out whether other teams used a surface learning approach while achieving better performance.
To conclude, it seems useful to underline an ob-servation reported above that could have greatly affected the performance of the system, but also of other systems. The analyses carried out showed that the Dev set provided by the organizers gave rise to significantly lower performances than those obtained by using evaluation datasets from the Learn set as similar as possible to the actual Dev set. This led me to develop the system on the basis of the Dev set provided by the organizers and the consequence was a statistically significant overfit on the Dev set when compared to the Test set. In the absence of information about how the three datasets were created, it is not possible to com-ment on the origin of these differences.
Acknowledgments
The author wishes to thank the organizers of the EmoContext task for putting together this valuable event. The author is a Research Associate of the Fonds de la Recherche Scientifique - FNRS.
References
C. W. Anderson and G. E. McMaster. 1982. Computer assisted modeling of affective tone in written docu-ments.Computers and the Humanities, 16(1):1–9.
Yves Bestgen. 1994. Can emotional valence in stories
be determined from words? Cognition and
Emo-tion, 8(1):21–36.
Yves Bestgen and Nadja Vincze. 2012. Checking and bootstrapping lexical norms by means of word
similarity indexes. Behavior Research Methods,
Ankush Chatterjee, Umang Gupta, Manoj Kumar Chinnakotla, Radhakrishnan Srikanth, Michel Gal-ley, and Puneet Agrawal. 2019a. Understanding emotions in text using deep learning and big data. Computers in Human Behavior, 93:309–317.
Ankush Chatterjee, Kedhar Nath Narahari, Meghana Joshi, and Puneet Agrawal. 2019b. Semeval-2019 task 3: Emocontext: Contextual emotion detec-tion in text. In Proceedings of International Work-shop on Semantic Evaluation (SemEval-2019), Min-neapolis, USA.
Rong-En Fan, Kai-Wei Chang, Cho-Jui Hsieh, Xiang-Rui Wang, and Chih-Jen Lin. 2008. Liblinear: A library for large linear classification. Journal of Ma-chine Learning Research, 9:1871–1874.
Umang Gupta, Ankush Chatterjee, Radhakrishnan Srikanth, and Puneet Agrawal. 2017. A sentiment-and-semantics-based approach for emotion detec-tion in textual conversadetec-tions. arXiv preprint arXiv:1707.06996.
David Howell. 2008. M´ethodes statistiques en sciences humaines. De Boeck Universit´e, Bruxelles.
Thorsten Joachims. 2002. Learning to Classify Text Using Support Vector Machines – Methods, Theory, and Algorithms. Kluwer/Springer.
George A. Miller, Richard Beckwith, Christiane Fell-baum, Derek Gross, and Katherine J. Miller. 1990.
Introduction to WordNet: An On-line Lexical
Database*. International Journal of Lexicography, 3(4):235–244.
Bo Pang and Lillian Lee. 2008. Opinion mining and
sentiment analysis. Foundations and Trends in