C
OLOFON
Document Master thesis
Title Optimisation of a component replacement policy at KLM Engineering & Maintenance using Predictive Maintenance
Keywords Predictive maintenance, prognostics and health management, spare part management, repair costs, replacement policy, discrete-event simulation
Author Irene van den Hof
s1238817
Educational
institution University of Twente Faculty of Behavioural Management and Social Sciences Department of Industrial Engineering and Business Information Systems
Educational program
Industrial Engineering and Management
Specialisation track: Production and Logistics Management
Graduation
committee University of TwenteDr. E. Topan Dr. Ir. M.R.K. Mes
KLM Engineering and Maintenance
Ir. S. Stokkers
M
ANAGEMENT
S
UMMARY
This research is an attempt to support KLM Engineering & Maintenance with the construction of a solid business case for a new data-driven maintenance application called ‘Prognos’. Prognos isdeveloped to improve Maintenance, Repair and Overhaul operations by forecasting component failures. Predictions about upcoming failures can be employed to implement a Predictive Maintenance (PdM) strategy, that aims to reduce cost in various aspects of the organisation. This study investigates the impact of PdM on repair cost and spare part cost. It is the first time that a detailed analysis on these two cost factors combined is performed for components in a 𝑘
-out-of-𝑁 structure: not only for KLM E&M but also in literature. This addresses the following
problem statement, that is of particular interest at KLM:
‘There is a lack of insight in how a predictive component replacement policy should be designed at KLM Engineering & Maintenance such that spare part and repair cost are minimised.’
KLM’s current situation is analysed and a literature study is performed in order to identify saving
opportunities in repair and spare part cost. Three predictive component replacement policies are designed that are aimed at minimising these cost factors, and their performance is tested within a simulation model. The corresponding research question is formulated as:
‘How should a predictive component replacement policy be designed and implemented at KLM
Engineering & Maintenance, in order to reduce repair and spare part cost?’
It was found that the predictive policy that initiates replacement on an aircraft when at least 2-out-of-4 components are alerted and/or failed, is the most beneficial policy for a 3-2-out-of-4 system. When replacement is initiated, the aircraft with the highest number of alerted components should be prioritized in order to maximise repair cost savings.
When predictive policies also consider current on-hand stock levels in their replacement decision, the variability of components in repair can be reduced. The increased time frame realised by forecast information, enables to smoothen the inflow of repairs. This variability reduction has an effect on the minimum required stock level: it is shown in a case study that spare inventory for KLM’s 787 fleet can be reduced with 20% for one particular system. The corresponding average total cost reduction is expected to be approximately 30%.
By using experimentation, the simulation study had the following findings:
- When fleet size is increased, the reduction of inventory levels is increased to 30%; - Policy performance remains stable when the model is run with different failure
distributions or added randomness in lead times;
- Changes in repair turnaround times and repair costs have the largest impact on spare levels and costs respectively;
- Low sensitivity rates and short prediction horizons also result in cost reductions.
This research provided promising results for the benefits related to the implementation of PdM at KLM E&M. However, it must be kept in mind that results could only be generated with the help of simplifying assumptions that include uncertainty.
time between removal, and therefore the increase in maintenance workload, is minor. It is also recommended to integrate current stock levels in replacement decisions, such that KLM is able to capitalize on benefits of spare part inventory reduction. This might lead to competitive advantage in the MRO market. Further research should be performed to investigate how decisions ‘in the front’ (i.e. the replacement decision) can be aligned with the situation ‘in the back’ (i.e. the current
P
REFACE
With this research I finish my master Industrial Engineering and Management and my time as a student. I have learned many things in the past few years about the field of research and myself, and had great pleasure while doing so at the University of Twente and the city of Enschede. It was a wonderful time with many new experiences and accomplishments.
This thesis is the final milestone, where I had the opportunity to learn about the dynamic world of aviation at one of Holland’s greatest companies. I found the subject of the research very interesting and liked the associated complexity a lot. It was challenging to continuously make the right trade-off for the scope of the research, but I think this was done successfully and the final result provides valuable insights for KLM E&M.
All members of the graduation committee are accountable for this success, so thank you Sidney, Engin and Martijn for all your helpful feedback, insights, support and time. It improved the thesis a lot and made me learn many new things. I enjoyed working with you.
I would also like to thank all my family, friends, fellow students and colleagues that supported me during my studies. You have made my time as a student great and very special. I am proud of the result.
T
ABLE OF CONTENTS
Colofon ... 3
Management Summary ... 5
Preface ... 7
List of abbreviations ... 10
1 Introduction ... 11
1.1 Context description ... 11
1.2 Research motivation ... 15
1.3 Research objective ... 17
1.4 Scope and limitations ... 19
1.5 Research questions & approach ... 19
2 System description ... 22
2.1 Current situation ... 22
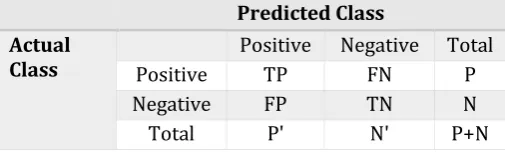
2.2 Performance measurement ... 27
2.3 Conclusion ... 30
3 Literature review... 31
3.1 Prognostics in maintenance: potential risks and benefits ... 31
3.2 Impact of predictive maintenance ... 32
3.3 System modelling ... 34
3.4 Conclusion ... 36
4 Solution design ... 38
4.1 Notation ... 38
4.2 Policy design... 39
4.3 Conclusion ... 44
5 Model ... 45
5.1 Conceptual model ... 45
5.2 Model design ... 50
5.3 Computer model ... 52
5.4 Conclusion ... 56
6 Results ... 57
6.1 Benchmark scenario ... 57
6.2 2k-factorial design ... 62
6.3 Other experiments ... 63
6.4 Conclusion ... 67
7.1 Implementation of a predictive policy for the CSU component ... 68
7.2 Other components in Prognos’ (future) scope ... 69
7.3 Development of Predictive maintenance at KLM E&M ... 70
7.4 Conclusion ... 71
8 Discussion ... 72
8.1 Method ... 72
8.2 Policy and model design ... 72
8.3 Results... 73
8.4 Conclusion ... 73
9 Conclusion and recommendations ... 74
9.1 Suggestions for further research ... 75
References ... 76
Appendices ... 79
Appendix A: Numbers and figures ... 79
L
IST OF ABBREVIATIONS
ABBREVIATION DEFINITION
A/C Aircraft
AFI Air France Industries
AHM Aircraft Health Monitoring
AOG Aircraft On Ground
BAR Big Data, Analytics & Reliability
CBM Condition-Based Maintenance
CS Component Services
CSF Critical Success Factor
CSU Cooling System Unit
DD Deferred Defect
DIL Demand Initiation Level
E&M Engineering & Maintenance
EASA European Aviation Safety Association
ERP Enterprise Resource Planning
FDE Flight Deck Effect
FIM Fault Isolation Manual
GUI Graphical User Interface
KLM Koninklijke Luchtvaart Maatschappij (Royal Dutch Airlines)
KPI Key Performance Indicator
LC Logistic Centre
LRU Line Replaceable Unit
MCC Maintenance Control Centre
MEL Minimum Equipment List
MRO Maintenance, Repair, Overhaul
MSO Maintenance Support Order
MTBR Mean Time Between Removal
MTTF Mean Time To Failure
NFF No Failure Found
NRM Non Routine Maintenance
OEM Original Equipment Manufacturer
PdM Predictive Maintenance
PH Prediction Horizon
PHM Prognostics & Health Management
RI Rectification Interval
RM Routine Maintenance
RUL Remaining Useful Life
TAT Turn Around Time
UGT Unplanned Ground Time
1
I
NTRODUCTION
Maintenance, Repair and Overhaul (MRO) activities are one of the major cost drivers in the competitive civil aviation market. The aim to be cost effective on these operations has drawn more and more attention over the past few years, due to technological developments, limited saving potential in other areas and the introduction of low-cost carriers (Doganis, 2010). A popular saying at the Royal Dutch Airlines (KLM) is that aircraft on ground only generate cost, and revenue while being in the air. Therefore, the organisation aims to minimise ground times and maximise aircraft availability. This results in tight schedules and high fleet utilisation rates compared to other airlines. This is realised due to an efficient organisation and close cooperation between the airline operator and MRO organisation.To maintain high aircraft availability, the Big Data, Analytics & Reliability (BAR) team was recently established at KLM. The goal of the team is to improve MRO operations with data analytics support or by making them completely data-driven. This research is an attempt to help the BAR team with the quantification of the benefit of a new data-driven maintenance application called ‘Prognos’.
This chapter is an introduction to the research, including context description (1.1), research motivation (1.2), research objective (1.3), scope and limitations (1.4), and finally the research questions and approach (1.5).
1.1
C
ONTEXT DESCRIPTION
To understand the context of our research, this section provides an introduction on KLM (1.1.1), (aircraft) maintenance (1.1.2 and 1.1.3) and Prognos (1.1.4). It provides insight in the industry, the capabilities of Prognos and some key concepts in maintenance, required to understand the problem of this research.
1.1.1 Company and fleet
The MRO organisation Air France Industries (AFI) KLM Engineering & Maintenance (E&M) is, in terms of revenue, the second largest MRO service provider in the world. It provides services to more than 200 airlines worldwide (Shay, 2017). With a workforce of 14,000 employees they offer technical support and services, including engineering, line maintenance, components, airframe and cabin modifications, engines, on wing services and technical training.
The 118-aircraft fleet of KLM is maintained by KLM E&M at their home base Schiphol-Oost. KLM
E&M’s organisation consists of six departments: Component Services, Engine Services, Logistics, Engineering, Aircraft Maintenance, and Staff (AIR FRANCE KLM GROUP, 2018). Table 1 shows an
overview of KLM’s fleet. The Boeing 787 aircraft (‘Dreamliner’), from now on 787, was introduced at KLM in 2015 and is the youngest aircraft in KLM’s fleet.
Table 1: KLM fleet (Royal Dutch Airlines, 2017)
Aircraft Multiplicity Max. passengers Range (km) Short / long haul
Airbus A330 13 268 - 292 8,200 – 8,800 Long haul
Boeing 747 (cargo) 13 (3) 268 - 408 11,500 Long haul
Boeing 787 13 294 11,500 Long haul
Boeing 777 29 320 - 408 11,800 – 12,000 Long haul
Boeing 737 50 188 4,300 Short haul
Embraer 190 42 100 - 88 3,300 – 3,180 Short haul
1.1.2 Maintenance in aviation
Safety requirements influence maintenance operations in aviation to a large extent. Regulations concerning airworthiness 1 requirements, approval of maintenance organisations, staff certification and training are supervised by the European Aviation Safety Agency (EASA) (European Union, 2003).
Maintenance actions to ensure airworthiness include required Routine Maintenance (RM) operations, which are executed during regular checks of the aircraft at predetermined time intervals, and Non Routine Maintenance (NRM). Repairs and other unplanned maintenance actions belong to NRM. The Mean Time Between (Unscheduled) Removal (MTB(U)R) is an
indication of the duration of a component’s ‘time on wing’ between replacements. It is a valuable measure that can be used to estimate resource demand for maintenance planning. The Mean Time To Failure is also used to estimate demand.
NRM is required when components fail before their next scheduled maintenance. From flight data that is logged by an aircraft, a Flight Deck Effect (FDE) can be generated. An FDE represents a fault that requires crew awareness or affects dispatchability (United States Patent No. 4943919, 1990). The required procedure that has to be performed based on an FDE, is specified in the Fault Isolation Manual (FIM)2. Sometimes FDEs can be solved with a system reset or a minor repair, but it can also lead to the replacement of a Line Replaceable Unit (LRU). This study only considers
‘repair by replacement’, which means that a failed system is always repaired by means of replacement. If an FDE requires an LRU replacement to be carried out, a technician can either replace directly, given a spare part is available, or defer the action. Common practice is that replacements are deferred, to keep local stock levels low. The Minimum Equipment List (MEL) specifies the Rectification Interval (RI), which is the time period in which the replacement has to be performed (no. of days within which the failure has to be solved), depending on the category.
Table 2: MEL categories and corresponding deadlines
MEL Category Rectification Interval (RI)
A Part specific
B 3 days
C 10 days
D 120 days
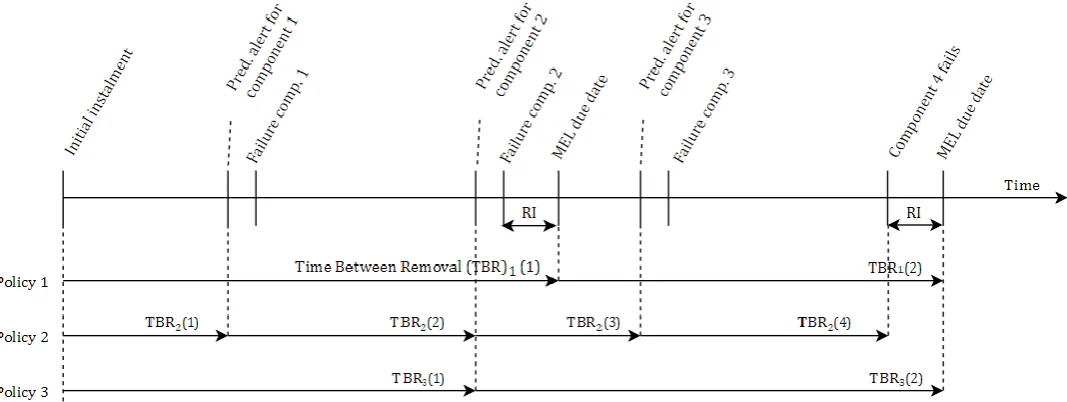
The graph below shows the relation between the Time To Failure, Time Between Removal and Rectification Interval for a 3-out-of-4 system. A 3-out-of-4 system is a variant of a 𝑘-out-of-𝑁
redundant system. Such systems have 𝑁 identical components and require 𝑘 of them to operate
in order to have an operational system. In the 3-out-of-4 case, the system is down or/and MEL is violated if more than 1 component fails.
1 Airworthiness represents the suitability of an aircraft for a safe flight.
2 Fault isolation refers to the maintenance procedure of the isolation of faults as well as the determination of the
1.1.3 Maintenance policies
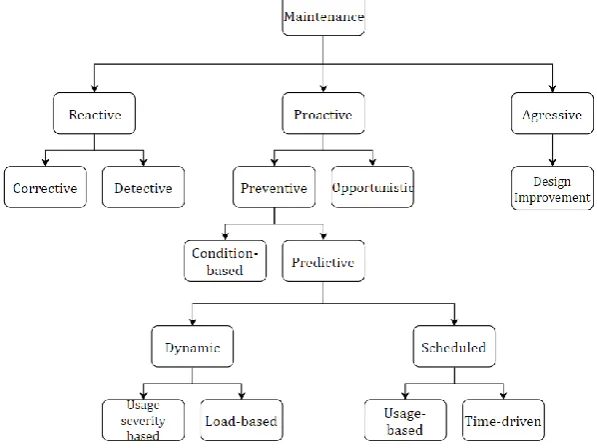
[image:13.595.55.542.71.262.2]A lot of general maintenance policies exist in order to effectively maintain systems in terms of quality, costs and time. Policies are distinguished between three main categories: reactive (act after failure), proactive (act before failure), aggressive (minimise failure occurrence) (Tinga, 2013). Prognos is a PdM application, developed to predict future failure states of components. In aviation, component criticality is an important aspect for policy selection. Criticality of a component represents the impact of its functionality to the airworthiness of an aircraft. Critical components have short RI’s or their failure leads to an Airplane On Ground (AOG; not airworthy) status right away. Usually a preventive policy is applied to these type of components. Non-critical components are mostly maintained according to a corrective policy. It is common practice to use redundancy for critical components in order to increase aircraft reliability3. In that case, a single component failure does not directly cause an AOG, provided that MEL requirements are still met. Redundancy increases complexity in maintenance and is an important aspect in this study.
Figure 2: Maintenance policies (Tinga, 2013)
[image:13.595.148.447.487.711.2]
3 Reliability = 1 – Probablity of failure, so high reliability means little failure occurrences.
1.1.4 Prognos
The Big Data, Analytics & Reliability (BAR) team is part of the Engineering division of KLM E&M. One of their major projects is the development of Prognos: a Predictive Maintenance (PdM) application designed to optimise MRO operations. The BAR team uses continuous data streams and in-depth system knowledge to develop algorithms that can predict upcoming failures, thereby potentially saving high maintenance costs and preventing technical delays. This differs from other health monitoring systems that use snapshot sensor data instead of continuous data, and only provide diagnostic information without predictions about future component failures.
Prognos’ models can be classified as ‘Dynamic Predictive’ in Figure 2.
Prognos started with the development of algorithms for a selection of LRUs of the Boeing 747 and, the majority, of the 787. LRUs were selected based on criteria such as data availability, repair costs and amount of operational disruptions due to failures. At the moment, algorithms for three selected LRUs are implemented in the Prognos software.
The software can create two types of signals: an alert (prognostic) or a failure indication (diagnostic). The failure indication, in combination with historical data about system behaviour,
can provide troubleshooting support: It helps to ‘do the right thing’. Predictive alerts provide additional support, namely also to perform maintenance ‘at the right time’. Prognos creates a
predictive alert based on sensor data collected during flights and predictive algorithms installed in the application. The alert represents an expected upcoming failure occurrence. The timing of an alert could be varied within a certain range. The maximum of this range varies per component and depends on a number of factors. The time between a predictive alert and a failure occurrence is referred to as the Prediction Horizon (PH). The accuracy4 of alerts increases as the time to failure decreases: a predictive alert for a failure tomorrow might be 99,9% accurate whereas a prediction about a failure next month might be correct 50% of the time. Technicians are currently warned with a Prognos alert 10 days in advance of the expected component failure. This provides extra operational planning flexibility while not sacrificing too much Remaining Useful Life (RUL). Prognos monitors several condition indicators, and using these parameters, it calculates an aggregate measure that indicates the health of a component. When this aggregate measure of a component exceeds a certain critical limit, it is expected to fail soon, or, it is considered as failure. The classification of failures and predictive alerts and the corresponding thresholds for the aggregate measures are continuously monitored and optimised by the BAR team. So far, the accuracy of the alerts and failure indications in Prognos has been very good, also with alerts that were generated 10 days in advance.
Focus on 787 – Prognos’ focus is on the 787, the first “more electric aircraft” from Boeing. This aircraft has far more expensive components than the other aircraft. More electric aircraft are
designed to push forward the concept of ‘more electric’, and, ultimately, ‘all electric’. The aircraft
contains a lot of new, innovative systems designed to reduce fuel consumption and environmental impact. The high costs related to maintenance of the 787 leads to the expectation of high saving potential with PdM. Since the 787 is an aircraft used for long haul flights with high passenger loads, the potential savings due to reduction of technical delays are also significant compared to short haul. Finally, the 787 enables the development of predictive analytics due to the huge amount of data that is collected during flights.
1.2
R
ESEARCH MOTIVATION
PdM can minimise total maintenance costs by optimising the timing of component replacements. This concept is embraced by the BAR team and is a motivation for this research, as it arises the question: How can KLM E&M minimise total maintenance cost with PdM? In the next subsection the concept of minimising maintenance cost by optimising the timing of replacements is discussed. Section 1.2.2 discusses a few recent issues at KLM E&M that are relevant for this study since Prognos might be able to contribute to solving these issues.
1.2.1 The concept of minimising cost with PdM
Detailed information about the occurrence of component failures enables to perform a more accurate trade-off between repair cost and prevention cost. Figure 3 shows the relation between repair, prevention and total costs in maintenance. As can be seen in the figure, prevention costs are high and repair costs are low with a preventive maintenance strategy (left section in the graph). This policy prevents failure occurrences due to timely replacements. This results in little failures and a high frequency of preventive replacements.
A reactive maintenance policy, which is shown on the right side in Figure 3, has a high number of failures, resulting in high repair costs. The number of preventive actions is low (or zero), resulting in low prevention costs. Predictive maintenance aims to set the maintenance policy such that total costs are minimised, by making the optimal trade-off between preventive – and corrective (repair) costs, by using predictive information, e.g. information about the health status of systems or components and predicted time of a future failure.
Currently, Prognos is only used for corrective maintenance. Yet, it is not used for proactive maintenance and does not consider the basic trade-offs explained in Figure 3. Current practice of
the LRU’s included in Prognos’ scope can therefore be indicated with the red X in the figure. Most components fail before their estimated MTTF and are correctively removed before the expected MTBR, resulting in high total repair and replacement costs. The maximum saving potential of Prognos equals the decrease in total costs if the X shifts from its current position on the right to the green optimum point in the middle (the result of the decrease in repair cost and the increase in prevention cost, indicated with 1; (2) – (3) = (1)).
At this moment, the potential savings are calculated based on historical data about repair costs (indicated with 2) and technical delays, which presumably could have been prevented if Prognos’
Figure 3: Cost associated with traditional maintenance policies (Tchakoua, et al., 2014)
The figure explains the trade-off between prevention cost and repair (or, corrective) cost in the traditional maintenance strategies. The study should focus on the cost related to repairing and replacing components on one hand, and on the other hand on the cost related to failure prevention. In the last category, spare part cost are identified as an important cost factor. Spare parts are expensive in aviation and an increased frequency of component replacements due to preventive actions, could result in high stock levels.
1.2.2 Research motivation for KLM E&M
At this moment, supply chain performance is poor for the supply of some components of the 787. One of the main reasons for the poor performance is the rather optimistic performance estimations that were made in advance of the 787 program kick-off, combined with the actual performance that turned out to be worse than the OEM MTTF/MTBR. This results in 787 component scarcity worldwide and capacity problems at KLM: delays in Turn Around Time (TAT)5 for repairs, unavailability of components and high costs. Prognos can provide timely information about component failures, which can be used to improve the effectiveness of spare part decisions. It is unknown how and to which extent PdM can contribute to getting a grip on supply chain performance; this is a motivation for this study. In addition, timely information about component failure generates an opportunity for early component removal, resulting in minor repairs with low cost and short repair times instead of major repairs with high cost and long repair times. In order to show Prognos’ full potential, maintenance operations have to be analysed in a more accurate and integral fashion. Potential benefits of a predictive replacement policy are, among others:
- Reduction of operational delays, by preventing technical delays due to improved scheduling;
- Repair cost savings, by using information about component condition to avoid major repairs;
- Repair time reduction, by reducing the work scope of repairs by avoiding major repairs; - Reduction of inventory stock-out cost, due to alignment of demand for spares;
- Reduction of inventory levels, as a result of improved planning and control enabled by PdM;
- Reducing the number of unjustified replacements, due to improved diagnostics.
It is unknown how KLM E&M can exploit these benefits with the current capabilities of Prognos and how a predictive replacement policy should be implemented for the components within
Prognos’ scope. Since the development of Prognos requires large investments, a detailed cost-benefit analysis is set as a high priority within the company. This cost-cost-benefit analysis is also necessary for awareness creation and cooperation among KLM E&M employees, which is another motivation for this research. This is needed for successful implementation of PdM.
1.3
R
ESEARCH OBJECTIVE
Prior to setting the research objective, we need a more thorough understanding of the problem(s) we are trying to solve. Therefore, this section is divided in problem description (1.3.1), problem statement (1.3.2) and research objective (1.3.3).
1.3.1 Problem description
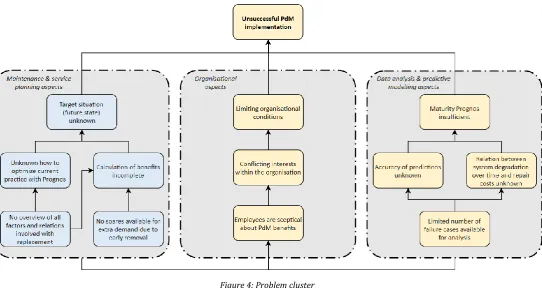
Figure 4 shows an overview of the problems related to unsuccessful PdM implementation at KLM. Prognos is already capable of indicating component failures, however this information is not used yet within the organisation to improve replacement decisions in an integral manner. At this point, Prognos predictive alerts are triggered 10 days before expected failure. However, 10 days is not the maximum PH with acceptable accuracy for some components and KLM should leverage the capabilities of Prognos to a larger extent to gain efficiency in planning and control, to match the
‘right moment’ of replacement. This ‘right moment’ should be set as a result of a trade-off between the cost related to preventive and corrective replacements. At this moment, a larger time frame can be used to plan a replacement, but only when a couple of constraints are met such as the presence of a maintenance message in one of the existing health monitoring system (due to warranty restrictions). It is unknown what the effect would be of potential other predictive replacement strategies, with larger or smaller prediction horizons and different replacement decisions taken based on the predictive alerts.
Some of the problems related to the lack of employment of predictive information are a motivation for this research, mentioned in the previous section. The problems are clustered in three categories: Maintenance & service planning aspects, Organisational aspects, and Data analysis and predictive modelling aspects.
Problems related to Maintenance & Service planning – It is complex to quantify the benefits of Prognos, since it involves a lot of uncertainty and different aspects within the organisation. Currently, Prognos’ potential is not quantified to a full extent. This is due to the fact that it is unknown how PdM should be implemented to save cost in various areas of the organisation. Also, due to scarcity of spare parts, it is impossible to experiment with the implementation of PdM strategies. Implementation of PdM in the current organisation and process flows, will lead to a higher frequency of replacements due to early removals. This will (temporarily) increase work load in the supply chain, which is expected to result in a drop in service level. Therefore this (suboptimal) implementation is deferred until availability issues are solved. The lack of overview of all factors involved with predictive component replacement, also causes a lack of knowledge about the design and objectives of the future state. How can current practice be improved, with
various areas of the organisation? These questions remain unanswered in the current situation, which results in an unclear business objective. The answers to these questions are far from straightforward, due to the complexity involved with maintenance operations.
Problems related to Organizational aspects – Ambiguity and uncertainty about the benefits (and drawbacks) of the implementation of PdM, and the risks related to it, contribute to the scepticism among various stakeholders at KLM E&M. Divisions have conflicting interests, as they all pursue their own objectives. Since the mutual business objective and the target situation is not defined in detail yet, benefits are not fully recognized and some stakeholders remain critical about PdM implementation and Prognos’ capabilities. One of the main counterarguments is that predictive replacements result in more frequent replacements, due to a decrease in the time between removals (a shorter time on wing).
Problems related to Data Analysis & Predictive Modelling – Prognos is in its development stage. Although some components are successfully implemented in the application, some models are still being optimised and new models are developed. Due to the limited amount of failure cases available, it is hard to measure performance of predictions or to define the relation between system degradation over time and the effect on repair workload (time and cost). One could argue that the maturity of the application in its current state is insufficient for successful implementation of a PdM strategy. However, it is expected that performance develops rapidly due to high investments, team expansion and increased data availability enabled by partnerships. Therefore, a study on implementation is very relevant at this point.
1.3.2 Problem statement
[image:18.595.30.573.117.405.2]This research focuses on the problems related to maintenance and service planning (indicated with blue in the left square of Figure 4). Within the target situation that KLM should aim for, benefits of predictive maintenance are exploited. That is, ideally, all aspects have been aligned and the situation of the green dot in Figure 3 is reached. This ‘target situation’ is unknown due to
the lack of insight in how all aspects influence the position of ‘the green dot’ (Figure 3) and
depends on Prognos’ capabilities. This research will focus on the impact of a predictive component replacement policy on spare part and repair cost. We aim to find out how this policy should be designed in order to reduce cost and create some understanding on how the benefits
of PdM depend on Prognos’ prediction performance. The related problem can be best described according to the following statement:
‘There is a lack of insight in how a predictive component replacement policy should be designed at KLM Engineering & Maintenance such that spare part and repair cost are
minimised.’
The concept of spare part and repair cost savings was briefly mentioned in the list with potential benefits in the Research motivation section on page 12. In the remainder of this research the impact of these aspects shall be investigated in more detail. The problem owners of the problem mentioned above are the manager of the BAR team and the product owner of Prognos.
1.3.3 Objective
The aim of the research is to evaluate the potential impact of PdM at KLM E&M and how to maximise the benefits by designing a predictive component replacement policy. A cost trade-off must be made, including repair – and spare part costs, and the policies should satisfy operational constraints. The research aims to provide insight in the factors that are affected by PdM, including their mutual relations. This insight helps to set the right priorities, for future development of Prognos and for the implementation of the application. This will contribute to the overall success of PdM at KLM E&M. The research should provide:
- An estimation of the impact of a predictive replacement policy on current operations; - Insight in cost fluctuations in the maintenance supply chain, under various scenarios; - Prognos’ requirements in order to capitalize on benefits.
1.4
S
COPE AND LIMITATIONS
This study will focus on the 787 aircraft only, because most of the components within the scope of Prognos are 787 components.
We focus on the problems that are indicated with a blue colour in the problem bundle of Figure 4. RM activities will be out of scope; we will focus only on corrective maintenance activities that are indicated by the degradation of components and which have the potential of using predictive maintenance. Decisions regarding the implementation of PdM include spare part investments and the replacement policy. Decisions regarding repair shop capacity allocation and repair priority rules are out of scope. The benefits related to improved planning of airline operations, are also out of scope. That is, the savings realised due to the prevention of technical delays.
1.5
R
ESEARCH QUESTIONS
&
APPROACH
This research will be conducted by consecutively answering a number of sub research questions, resulting in a final conclusion to the main research question. This addresses the problem statement formulated in Section 1.3. The main research question of this study is:
‘How should a predictive component replacement policy be designed and implemented at
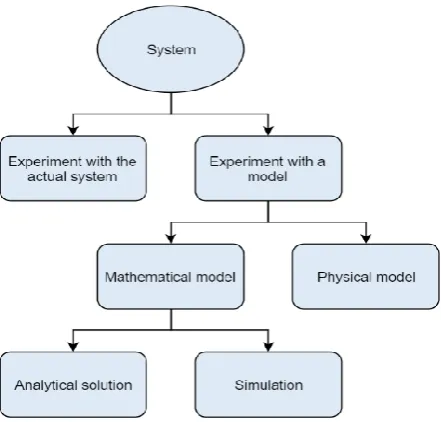
The research investigates how KLM can shift from corrective to predictive maintenance. This final section presents the research approach, which is based on the conceptual modelling framework of Robinson (2011), which will be described in more detail in later sections. In this chapter, the problem KLM E&M currently faces is introduced. To improve component replacements, we should analyse current processes and aspects related to this problem. Benefits increase when the performance of predictions is optimised. Therefore, we need to know the maturity of Prognos, providing us information about the capabilities of the application. This will be addressed in the second Chapter ‘System description’ with the following research questions:
1. What is the current component replacement policy?
a. Which stakeholders are involved with non-routine component replacements and what are their interests?
b. Which process steps are involved with component replacement?
c. What is the performance of the current component replacement policy? 2. What is Prognos and what are the capabilities of the application?
a. Which components are included in the application? b. What does the application look like?
c. What cost reduction is expected?
After we have described all relevant aspects of the system, we perform a literature study to search for studies related to PdM (implementation). Based on knowledge from literature, a solution can be designed for our research problem. Chapter 3 is a literature review and answers the third question:
3. What can we learn from related studies, when we want to improve the component replacement policy with predictive maintenance?
a. What are the risks and opportunities related to predictive maintenance?
b. Which aspects should we focus on when designing a predictive replacement policy? c. Which method is suitable to compare policies in our research?
In Chapter 4 predictive component replacement policies are designed that use Prognos information in order to reduce repair and spare part cost. The chapter proposes potential solutions and the fourth research question is addressed:
4. How should predictive component replacement policies be designed for k-out-of-N systems, that capitalize on repair and spare part benefits?
In Chapter 5, a model is constructed for a case study of one of the components within Prognos’
scope. The model should represent the system described in Chapter 2 and be able to analyse the performance of the designed policies from Chapter 4. For this purpose, all input factors have to be determined as well as the scope and level of detail of the model. The corresponding research questions is:
5. How should we construct a model that is able to test the impact of predictive component replacement policies for k-out-of-N systems?
a. How can we abstract a conceptual model from the system description? b. What does the model design look like?
c. How can we use the model to find the best solution?
The next step is to implement the model in software and analyse the results. Model validation is included in this chapter and various experiments are executed in order to evaluate the impact of certain factors on cost. This experimental study and its numerical results will be discussed in this
Chapter ‘Results’ and has the corresponding research questions:
6. What is the expected performance of the predictive replacement policies, when they are applied to a 787 component at KLM E&M?
b. What is the required performance of Prognos’ prediction models?
7. What are the benefits and drawbacks of using a predictive replacement policy at KLM?
Chapter 7 ‘Implementation’ is the last chapter that answers research questions, namely:
8. How should KLM E&M implement predictive maintenance?
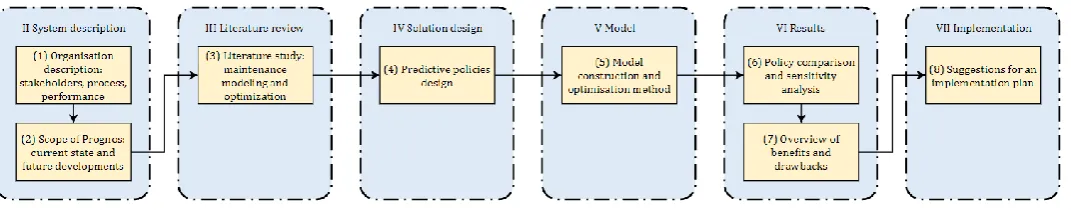
[image:21.595.35.571.203.308.2]Chapter 8 includes a discussion about the results and Chapter 9 answers the main research question, including final conclusions and recommendations. Figure 5 is a representation of the research approach in chapters 2-7 (blue blocks) and the corresponding research questions (yellow blocks).
2
S
YSTEM DESCRIPTION
The first two research questions will be addressed in this chapter:1. What is the current component replacement policy?
a. Which stakeholders are involved with non-routine component replacements and what are their interests?
b. Which process steps are involved with component replacement?
c. What is the performance of the current component replacement policy? 2. What is Prognos and what are the capabilities of the application?
a. Which components are included in the application? b. What does the application look like?
c. What cost reduction is expected?
The aim of this chapter to analyse the context at KLM E&M and to identify all relevant aspects involved with corrective component replacement. The first section describes the current situation, including an introduction of the stakeholders, a description of the process flow and a description of Prognos.
The second section describes current performance of the component replacement process and Prognos related performance measures. Section 2.3 is a conclusion of this chapter.
2.1
C
URRENT SITUATION
This section describes the process for corrective component replacement. Therefore, this excludes all planned maintenance activities, resulting from preventive maintenance. These planned maintenance activities are performed during letter checks 6 at the base, at a predetermined time. This mid-term and long-term planning of maintenance within letter checks is not within the scope of this research.
2.1.1 Direct stakeholders
There are multiple stakeholders involved with corrective component replacement process. The most important ones are introduced.
Line maintenance – At Schiphol and many other airports around the globe, AFI KLM E&M provides line maintenance services. Maintenance staff perform inspections, replacements, refuelling and troubleshooting between flights. A ground mechanic is responsible for executing all required actions to ensure safety. If a complaint is deferred, the Maintenance Control Centre (MCC) plans the activity.
Maintenance Control Centre (MCC) – The MCC is, together with line maintenance, responsible for planning and preparing corrective maintenance activities. Corrective maintenance can be planned within the available time window according to MEL. In addition, the MCC provides technical advice to line maintenance and pilots. Technical specialists from the MCC monitor
aircraft’s technical status via health monitoring systems, such as Aircraft Health Monitoring (AHM). Their goal is to minimise technical delays during flight operations and optimise reliability. Thus, line maintenance primarily executes corrective maintenance while the MCC plans the activities and provides technical support.
Repair shop– KLM E&M has two repair shop divisions with numerous repair shops, both part of Component Services (CS). The Plant Shop MRO repairs hydraulics, low/high frequency
6 Letter checks are periodic inspections that are performed at the base of the MRO organisation. Light, more
components, computers, indicators, air data systems and galleys. The Plant Shop Hub handles mechanical systems, such as panels, toilets, aircraft kitchens, flight controls, doors, plastic/carbon fibre parts, wheels, brakes, chairs and emergency equipment. If KLM does not have the capability to repair a certain part, the repair activity is outsourced to a vendor.
2.1.2 Indirect stakeholders
Big Data, Analytics & Reliability (BAR) team –Three engineers of the BAR team are working on the development of Prognos for 787 components. The product owner of Prognos is responsible for the development and performance of the application. The manager of the BAR team is responsible for defining the strategic purpose related to PdM (mission, vision and objectives related to becoming a data-driven organisation) and the coordination of the implementation of Prognos.
Component Availability –Each type of aircraft has its own ‘availability team’, responsible for spare part availability and consisting of an operations team and a support team. The operations team is responsible for operational control, making sure repair TATs are met. This means they are responsible for contact with the airlines and the suppliers and solve operational disruptions.
TAT’s are contracted in service contracts with customers and vendors. For most components, the TAT corresponds with 14 calendar days and it varies per supplier and component whether these agreements are met.
Supply chain specialists from the support team are responsible for long-term decisions, such as determining spare part levels and new sales cases. Together, the component availability team is responsible for the coordination of component flows and their timely availability. This is for all airlines included in the pool (so not only the KLM fleet). Currently this consists of approximately 160 aircraft (787) from 19 airlines around the globe. This number is growing rapidly.
2.1.3 Stakeholder’s interests
Stakeholders within the organisation can have conflicting interests regarding component replacement. These differences are easy to explain but difficult to manage. To create a better understanding of the various objectives, Table 3 provides an overview of stakeholder’s interests.
Table 3: (conflicting) interests among stakeholders
Stakeholder Objective (regarding component replacement)
Line maintenance Minimise technical delays while minimizing line maintenance effort
MCC Maximise aircraft availability and reliability, by responding effectively on health monitoring information and minimizing operational disruptions
Repair shop Maximise reliability (by performing good quality repairs), deliver on time
BAR team Minimise overall cost by providing support with data-driven optimisation tools
Component Availability Minimise spare part cost and maximise service level
2.1.4 Corrective maintenance process flow at KLM
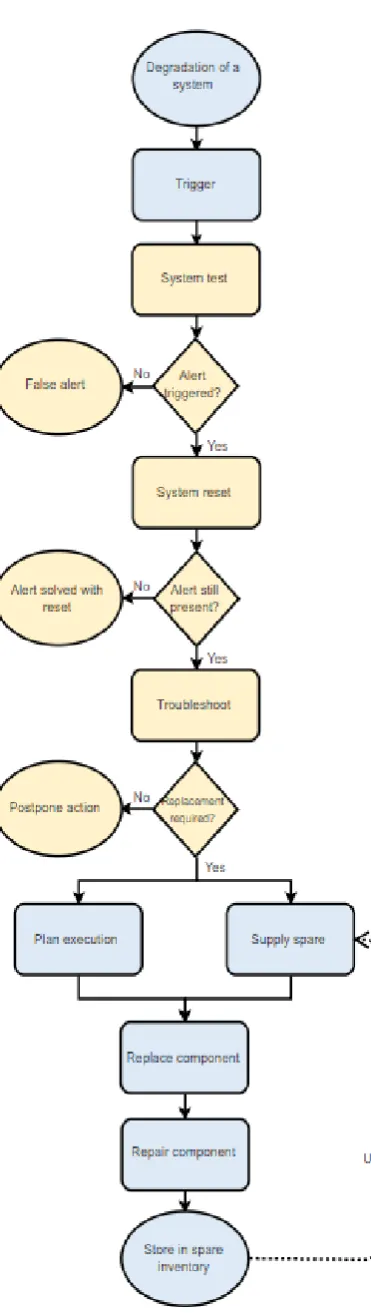
This section describes the current process involved with corrective component replacement at KLM as shown in Figure 6 (without PdM).
Process flow exclusively for KLM corrective replacements (non-routine) – The process starts with a trigger from one of the aircraft health monitoring systems (such as AHM) or a technical complaint from the pilot. The MCC or ground technician receives and evaluates the trigger by consulting all information systems. In between flights, a technician tests the system. If the fault message does not appear again, the process ends and the alert is labelled as a false alarm.
If the alert is still present after testing, the technician performs a system reset. If this doesn’t solve the problem,
troubleshooting has to be performed to find the cause of the error. If replacement is not required right away, the action is usually postponed and placed on the ‘Deferred Defect’ (DD)
list. The MCC creates maintenance orders for the parts on this list and plans the activities at a later time. If the replacement cannot be deferred, it can lead to an AOG. The MCC aims to solve MEL items as soon as possible, however, due to scarcity of some 787 components, current practice for these parts is that replacements are postponed to a moment close to the due date.
In order to perform component replacement, the execution needs to be planned and a spare needs to be supplied. It depends on the component and the required equipment whether it is possible to remove a component at the line. Some components can only be removed at the base. CS is responsible for on time spare delivery. After replacing the component with a spare, the defective component will be sent to the repair shop and put back into the serviceable inventory once it is repaired.
Impact of PdM on process – The system test, reset and troubleshooting (yellow boxes) will not be part of the process flow with (solely) Prognos alerts, since the test limits are not adjusted to Prognos sensitivity. That means, a component that was replaced based on a Prognos alert will pass a system test (in principle), since it is still within the bounds of the quality limits.
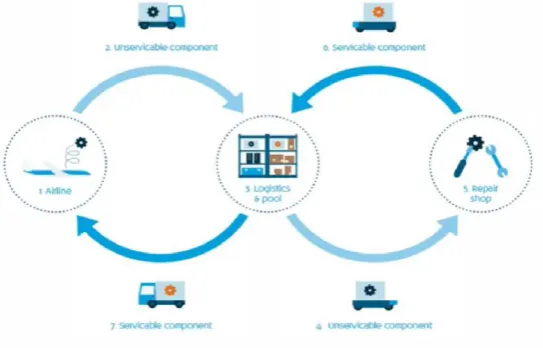
[image:24.595.28.214.68.726.2]Spare supply and repair procedure – The standard logistic process of component replacement is best described according to Figure 7. This process is the same for all (pool) customers of KLM E&M. The process starts with a customer order. If a spare is available at the Logistic Centre (LC) it is picked and shipped. If there is no spare available, KLM can decide to lease or
exchange a part. KLM has multiple partners worldwide that could deliver a lease spare, however these components are costly and not always available. If a part is leased, common practice is to exchange the part with another service part once there is one available. So, a random other spare can be returned for the outstanding lease part: it does not have to be the same component. The price of exchanging a component is 10% of the component price on average. Leasing of components is an exception rather than regularity.
[image:25.595.162.434.226.400.2]After shipping, the serviceable unit is installed into the aircraft. The unserviceable unit is shipped to the LC. A repair order is created and the part is sent to an internal or external repair shop. After repair the part is received in serviceable condition at the LC. New spares are ordered by supply chain specialists, based on expected demand and expected component performance.
Figure 7: Logistic process related to component replacement
2.1.5 Prognos
Together with data engineers and data scientist, the BAR team develops algorithms to indicate component failures. It depends per component which parameters indicate failure modes. An example is the increase of temperature in a component used for cooling, or high power usage due to degradation in the filter. Another example is an anomaly in the oscillation pattern of a motor controller, indicating a certain failure mode. Most failure modes can be detected with Prognos.
Table 4 shows the LRUs that are implemented in Prognos’ Graphical User Interface (GUI) in 2018.
Users of the GUI navigate between all the tails (aircraft) of the fleet and per tail an overview is presented of current and historic performance of the LRU’s on that tail.
Table 4: Systems implemented in Prognos in Q3 and Q4 2018
Component (Q3) Repaired by QPA7 Criticality (MEL restrictions)
747 Electrical Generator (EG) KLM E&M 4 Solve within 3 days if 1-out-of-4 are failed 787 Cooling System Unit (CSU) OEM 4 Solve within 10 days if 2-out-of-4 are failed 787 CSU Motor Controller (CSU MC) AFI/OEM 4 Solve within 10 days if 2-out-of-4 are failed 787 Air Compressor Epcor8 4 Solve within 10 days if 1-out-of-4 are failed
7 Quantity per aircraft
8 Epcor is a component overhaul and repair company, part of the KLM Group.
In a system’s configuration diagram in the GUI, failed components are indicated with a red colour and predictive alerts are indicated with orange. Figure 9 shows a screenshot from the GUI of Prognos with a configuration diagram of a component with a predictive alert on the compressor. The time window for predictive alerts is aligned with the planning window for scheduling replacements: 10 days in advance of an expected failure an alert is triggered. This increases the planning flexibility of the MCC and thereby helps to reduce Unplanned Ground Time (UGT) and AOGs. Ten days after an alert the component will fail and move to the red zone.
As an example, Figure 10 provides a (fictional) relation between the accuracy of the predictions and the prediction horizon. The maximum PH in the figure is 50 days. Currently, Prognos’
algorithms are set such that a predictive alert is triggered (at least) 10 days before expected failure, indicated with the yellow X on the right. So, at that point the icon in the GUI corresponding to the observed component turns orange,
as Figure 9 illustrated as example. This 10-day interval was chosen by the MCC, as it would give them more planning flexibility. A larger interval would be ineffective for them since their planning horizon for corrective replacements only considers short term. In that case, a larger PH will only have the negative effect of RUL reduction (if potential repair savings are not considered). If the graph in the figure were true, it would also be possible to trigger alerts sooner: for instance 30 days in advance with >85% accuracy. Prognos’
developers are not yet able to provide a curve such as Figure 10, however they can provide an estimation of the accuracy of their predictions at various time intervals. This estimation provided by the BAR team, based on extensive research, is assumed to be correct.
Larger prediction horizons might provide additional benefits for KLM E&M that are not utilised at this moment. If one also considers repair savings and spare part decisions, this threshold might be more efficient when it is set at another level. This could enable the avoidance of expensive repairs and the extra flexibility in spare part planning could be used to gain efficiency and reduce inventory. This study aims to provide a recommendation about the timing of alerts, while considering these repair and spare savings, such that threshold values in Prognos can be adjusted to the right requirements.
Besides a fleet overview and configuration diagrams, Prognos provides historical performance data per tail. The algorithms ‘behind’ the GUI generate graphs. Based on these graphs, an algorithm can generate an alert, as shown in Figure 9. Thresholds can be varied according to the preferred PH. The definitions of the thresholds vary per component and are defined by the BAR team and other stakeholders, such that an alert is triggered at the right time and with acceptable accuracy. Anomalies in the performance graphs (clearly detectable on the components with the
Figure 9: Configuration diagram with a predictive alert
red lines on the PH-BHC9 in Figure 11) can exceed threshold values which results in alerts or failure indications in the configuration diagrams and fleet overview.
In these graphs, data of a system with four components is plotted over time: each component represents a colour. Each dot in the graph represents a summary of a flight and the value on the y-axis represents the fraction of time within which the component had a temperature above a certain threshold. So if a red dot is plotted on [2018-07, 0.6], it means that component number 1 had a temperature above the threshold value for 60% during a flight in July 2018. The data models account for all kinds of noise and interaction effects. These algorithms have proven to be very effective: so far there have been no false alerts10 at all.
2.2
P
ERFORMANCE MEASUREMENT
To create more insight in our system and its characteristics, we elaborate on the performance related to component replacements and Prognos. From Section 2.1.3 we know that there are multiple objectives related to component replacements, such as the minimization of maintenance effort, maximization of aircraft availability, maximise reliability, maximise service levels and minimise cost. Performance can be measured in terms of Key Performance Indicators (KPI’s). The
9 These five letter codes are aircraft registrations. PH represents the Dutch registration prefix. The B is for Boeing
and the H indicates that the aircraft is a 787 model.
10A false alert or false alarm is a wrong prediction: the prediction value is ‘failure’, but the actual value is
‘no failure’.
most important KPI’s related to this study are costs and service level. Repair- and spare cost cover the largest fraction of total maintenance cost and the service level KPI is expressed as the fraction of on time deliveries. High service levels are required to ensure high fleet availability.
In Figure 6 a flowchart of component replacements was presented. The performance and cost related to this process depends on a number of factors. In this section the most relevant are highlighted. The steps indicated with yellow in the figure are out of scope, as these are considered irrelevant to PdM implementation at this moment.
Regarding the KPI’s, the ‘time on wing’, ‘time off wing’ and service level mainly determine the costs related to spare parts. These costs, together with repair costs, are considered to have the most impact on total cost. In the next subsections this is explained in further detail.
2.2.1 Time on wing
A component on wing degrades while being operational and fails eventually. A number of factors determine when this will happen, for instance its operating environment, component quality and number of flight cycles. The most important performance measure at KLM regarding this process is the Mean Time Between Removal, which basically measures the average operational life cycle of a component (see also Figure 1). This measure determines the expected number of replacements on the fleet to a large extent. The formula used at KLM to estimate the total number of replacements on a fleet, is given as follows:
𝑛𝑜. 𝑜𝑓 𝑟𝑒𝑝𝑙𝑎𝑐𝑒𝑚𝑒𝑛𝑡𝑠 = 𝑓𝑙𝑒𝑒𝑡 𝑠𝑖𝑧𝑒 ∗ 𝑄𝑃𝐴 ∗ 𝑎𝑣𝑒𝑟𝑎𝑔𝑒 𝑓𝑙𝑖𝑔ℎ𝑡 ℎ𝑜𝑢𝑟𝑠 𝑝𝑒𝑟 𝑦𝑒𝑎𝑟 𝑀𝑇𝐵𝑅
For non-redundant systems with short rectification intervals, the MTBR ≈ MTTF. In that case a
failure will result in replacement almost right away. For 𝑘-out-of-𝑁 systems, the MTTF and MTBR
can vary: the MTTF is a characteristic of a component and the MTBR is the result of a policy. For instance, in a 2-out-of-4 system one is obliged to replace components with less than 2 operational components (so at least 3 failures). However, one could also decide to preventively replace components when the system has 1 or 2 defective components. Here, preventively refers to
‘before MEL violation’. In the latter case, the MTBR will be shorter as when replacements are postponed until there are at least 3 failures (MEL violation)11. The MTTF is unchanged.
One of the main counter arguments for the implementation of PdM is that it will reduce the MTBR, which results in a larger number of replacements. This is expected to result in higher spare levels, according to the defenders of this argument.
The given example illustrates the impact of replacement policies on the MTBR. From the formula it can be concluded that the MTBR is the most determining factor in the number of replacements, as the fleet size, quantity per aircraft and average flight hours per year are given. The number of replacements impacts the demand for spare parts. So, the replacement policy influences the demand for spares through the MTBR in 𝑘-out-of-𝑁 systems.
2.2.2 Time off wing
Once component replacement is required, the component needs to be taken off the aircraft and sent to repair. This requires maintenance time, shipping time and repair time. In this research only repair time is considered. Replacement actions take up to half a day, which is negligible. Shipping times from and to customers can take up to weeks (when waiting times are included),
however, for KLM’s fleet shipping is always performed within a day. Therefore, in this research the time off wing is set as the repair TAT. For repair shops, this TAT is contracted and set to 14
days in most of the cases. This contracted time is not always met and can include high variability and uncertainty.
The TAT is the most important measure in determining the ‘average number in repair’, or Work
In Progess (WIP). This WIP determines, together with the number of replacements, the demand for spare parts since spares are required to fulfil demand during repair lead time. This relation is shown in the formula below, also known as Little’s Law. The formula is later used to estimate spare demand, which is explained further in the next subsection.
𝑎𝑣𝑒𝑟𝑎𝑔𝑒 𝑖𝑛 𝑟𝑒𝑝𝑎𝑖𝑟 = 𝑛𝑢𝑚𝑏𝑒𝑟 𝑜𝑓 𝑟𝑒𝑝𝑙𝑎𝑐𝑒𝑚𝑒𝑛𝑡𝑠 ∗𝑅𝑒𝑝𝑎𝑖𝑟 𝑇𝐴𝑇 (+𝑠ℎ𝑖𝑝𝑝𝑖𝑛𝑔 𝑡𝑖𝑚𝑒𝑠) 365 𝑑𝑎𝑦𝑠
2.2.3 Service level
To maintain high fleet availability, the service level of spare part delivery has to be high. At KLM, the target service level is set at 95% for most the components with MEL category C. This means that 95% of the components have to be delivered on time. There is no KPI related to the lead time. To estimate spare levels, the formula below is used:
𝑛𝑢𝑚𝑏𝑒𝑟 𝑜𝑓 𝑠𝑝𝑎𝑟𝑒𝑠 𝑛𝑒𝑒𝑑𝑒𝑑 = 𝐹𝑁𝑜𝑟𝑚𝑎𝑙(𝜇,𝜎−1 2)(𝑠𝑒𝑟𝑣𝑖𝑐𝑒 𝑙𝑒𝑣𝑒𝑙)
Where 𝜇 represents the average number of spares in repair and 𝜎2 is the variance of the number
of spares in repair. It is assumed that this number can be approximated with a Normal distribution. Therefore, the inverse Normal distribution at the service level will provide an estimation of the required spares. At KLM, the formula for variance is given as:
𝜎2= √𝜇
This formula is used based on historic research at KLM. It is unknown whether this Normal approximation and approximation for the variance provide reasonable estimates.
New spares should be delivered within 7 days, however due to scarcity issues with 787 components, lead times can run up to months. If on-hand inventory cannot meet spare demand, KLM has the option to lease components. A lease component costs 10% of the purchasing price on average, and can be exchanged with a random other spare part when one becomes available. Lease units can be sourced from all over the world; from other airlines but also at MRO competitors. The lead time of lease parts depend on the urgency of the shipment (1 – 10 days).
2.2.4 Repair cost
Repair cost can vary greatly. Many repairs have no cost as they are performed within the warranty period. When a component enters the repair shop, a test can result in No Failure Found, a minor repair or an overhaul (major repair). Cost of repairs are mainly determined by the cost of labour and piece parts. This research considers fixed cost related to minor and major repairs. Warranty periods are not taken into account.
Current estimations of Prognos’ benefits greatly depend on repair savings. Total expected savings
on KLM 787 fleet in 2019-2020 due to Prognos are estimated to be more than 𝑥 million dollar12. This is based on the top 10 systems that are included in the (future) scope of Prognos. It is estimated that 1/3 of the delay costs (out of scope in this research) can be saved and that the repair costs are reduced with 1/6. It is unknown how accurate these estimations are. Historical data from 2016-2018 was used as input for the calculation. Although the benefit calculation provides a first estimate for potential savings, it is a rough estimate. Figure 12 illustrates the ratio
of potential savings between the two categories, when delay and repair cost are reduced with 0.333% and 0.167% respectively. The figure emphasizes the impact of repair savings with PdM.
2.3
C
ONCLUSION
This chapter provided a system description: it discussed the process related to corrective component replacements and reviewed the factors that have great impact on cost and service level. From Section 2.2 we can conclude that the formulas used to estimate spare and repair cost, are simplified. To estimate the impact of PdM on spare demand, a more detailed analysis of the effects might be required. From this section we have learned that the impact of a policy on the MTBR plays an important role in spare part management. A reduced MTBR will result in more frequent replacements and increase inventory, however, PdM might also be able to reduce the variance of the average number of components in repair by improved planning. The latter will have a positive impact on inventory by reducing spare levels.
In this chapter we also created more insight in the capabilities of Prognos. The performance can be evaluated in terms of the accuracy of predictions and the prediction horizon. Currently, KLM has chosen to trigger alerts 10 days before expected failure. However, for some components, this does not correspond with the maximum PH. In Appendix A, a table is given with all values for the
KPI’s related to component replacement of the CSU, one of the components in Prognos’ scope. In
this example the maximum PH is three times larger than the current PH of 10 days.
At this point we have acquired, partially by assumption, all information about the system related to our problem introduced in Chapter 1. The remaining tasks are to design a predictive replacement policy that reduces spare part and repair cost, while satisfying constraints regarding service level and aircraft availability, and to find a method to test the impact of this predictive policy on various organisational aspects. In the next chapter a literature review is performed to search for studies that helps us with the design of this policy and method.
78% 22%
DISTRIBUTION EXPECTED SAVINGS 2019-2020
Repair savings Delay savings
3
L
ITERATURE REVIEW
In order to analyse, model and optimise maintenance processes related to PdM, we search for related studies in literature. This will address the third research question:3. What can we learn from related studies, when we want to improve the component replacement policy with predictive maintenance?
a. What are the risks and opportunities related to predictive maintenance?
b. Which aspects should we focus on when designing a predictive replacement policy? c. Which method is suitable to compare policies in our research?
Section 3.1 discusses the risks and benefits related to the use of prognostics in maintenance. In Section 3.2 relevant factors are identified that determine the potential benefit of PdM. In section 3.3 a model is selected for our research and 3.4 is a conclusion of the chapter.
3.1
P
ROGNOSTICS IN MAINTENANCE
:
POTENTIAL RISKS AND BENEFITS
Application of PdM or Prognostic Health Management (PHM) can either (significantly) reduce operational costs, or result in a less economic situation when the investment costs of the PHM technology are considered. In literature both situations are present (Wu, Jia, Lei, & Wang, 2013). Although there is an excessive amount of literature about health monitoring systems, prognostics, PdM, and combined optimisation of maintenance, repair or spares, relatively little has been published on the interaction between (predictive) maintenance, spares and repairs (de Smidt-Destombes, van der Heijden, & van Harten, 2009). Most PdM applications in literature are based on over-idealistic experimental data that fails to represent real-world challenges (Vinck, 2018). Therefore, PdM is not very well understood in practice. This section discusses the risks and opportunities related to the use of prognostics in maintenance. We aim to identify important factors related to the design of a predictive replacement policy, so that we select the right variables and parameters to include in our analysis.
3.1.1 Risks
Complexity –The lack of suitable reference cases in this early stage of the PdM life cycle, makes it hard for companies to construct solid business cases (Price Waterhouse Coopers and Mainnovation, 2017). The integral optimisation of maintenance, spares and repairs is not straightforward, especially when the civil aviation market is concerned and one also has to deal with the interaction with flight scheduling and other complexity issues such as component redundancy (𝑘-out-of-𝑁 systems), legal matters, high variabilities and complex failure modes.
Too many simplifying assumptions to deal with complexity can cause difficulties in the derivation of valuable conclusions or create misleading results.
3.1.2 Opportunities
PHM and PdM have become more and more appealing in aviation business. Logistic optimisation, asset availability maximization and reduction of maintenance costs are among the benefits (Nicchiotti & Rüegg, 2018). A drawback of all proactive strategies is the waste of RUL due to early removal. With PdM, this waste can be minimised due to sophisticated information about the RUL. Prognostic information enables predictive logistics, which can improve the planning, scheduling, and control of activities in the supply chain (Kim, An, & Choi, 2016).
Figure 13: Visualisation of impact of predictive maintenance in aircraft operations (Kahlert, 2017)
The optimisation opportunities related to the aircraft operation are visualized in Figure 13. The benefit from a prognostic fault indication on flight operations can be derived from the figure. Regarding maintenance operations, resource planning and preparing activities can also be performed in advance.
In literature all kinds of optimisation techniques are designed based on Advance Demand Information (ADI), such as revenue management (pricing, reservation policies) and capacity control (inventory management). Predictive signals about component failures can be considered as a demand signal (or ADI) for spare parts, as failures generate demand for spares. This can be used to optimise spare parts supply decisions (Topan, Tan, & van Houtum, 2018). Hariharan and Zipkin (1995) also employ early warnings for demand, to improve performance of basic inventory models. Demand lead times (time between a customer order and an order due date) are, in a precise sense, the opposite of supply lead times. That is, the effect of a demand lead time on overall system performance is precisely the same as corresponding reduction in the supply lead time (Hariharan & Zipkin, 1995). A predictive alert can be interpreted as an early warning for demand, where the prediction horizon corresponds with the demand lead time. Although the inventory policy at KLM E&M does not correspond with one of the basic inventory models
mentioned in Hariharan & Zipkin’s paper, it motivates to explore the benefits of demand lead times in inventory management at KLM.