The disruption of a patient
A longitudinal study about the association between global
functioning and disruptive behaviour of patients in the acute
psychiatric care.
Tamar de Boer
ABSTRACT
2
INTRODUCTION
In 25.9% of all patients admitted to acute psychiatric care units in the Netherlands coercion is applied (Argus Informatie Centrum, 2016). Coercion is restricting a patient’s movement using
environmental, physical, or mechanical means (Gerace & Muir-Cochran, 2019). Restricting a patient’s movement using environmental means, such as seclusion, is the most often used
method with a prevalence of 11.6% (Argus Informatie Centrum, 2016). Coercion is frequently applied to prevent and manage the risk of harm caused by a patient’s disruptive behaviour (Gerace & Muir-Cochrane, 2019; Janssen et al., 2008). However, the use of coercion could have negative consequences for both patients and staff. This includes psychological consequences such as emotional damage (National Mental Health Consumer & Carer Forum, 2009), post-traumatic stress (Chieze, Hurst, Kaiser, & Sentissi, 2019) and physical consequences even resulting in death of the patient (Currier, 2003). For the staff the use of coercion could also result in post-traumatic stress (Bonner et al., 2002) and serious injury (Renwick et al., 2016). To improve the health, safety and wellbeing of both patient and staff, coercion needs to be reduced to a minimum by predicting and preventing disruptive behaviour. Disruptive behaviour is a combination of behaviours and symptoms of a patient. It includes aggressive behaviour such as spitting, scratching and pinching. But also violent behaviour such as physical force by slapping, punching, kicking and biting or the use of an object as a weapon. Furthermore, verbal threats involving no physical contact may also be classified as disruptive behaviour (Clarke, Brown, & Griffith, 2010). The symptoms of disruptive behaviour can include confusion and disorientation, whereby a patient has no idea of time, location and/or their identity. Irritation is another symptom, in these cases a patient is not capable of tolerating other people. The final symptom of disruptive behaviour is noisiness, whereby the patient shows loud behaviour such as throwing with doors or yelling at people (van de Sande, Mulder, & Nijman, 2013). The website of Triasweb (https://ppsso.triasweb.nl/form /webMeldplein.aspx) provides information about the amount of disruptive behaviour. In the province Gelderland of the Netherland, the acute psychiatric care reported 3296 counts of unacceptable behaviour/aggression and 949 counts of risky/unsafe situations in 2016 and 2017. Disruptive behaviour is common in patients in the acute psychiatric care and might result in the use of coercion.
disruptive behaviour (Brendel, Wei, & Edersheim, 2010; Steinert & Whittington, 2013; Krippl & Karim, 2011). Furthermore, patients with personality disorders who are in a crisis accompanied by self-destructive behaviour, appear to be more at risk for disruptive behaviour (van de Sande et al., 2013). However, the nature of the connection between psychiatric diagnoses and disruptive behaviour is unclear. Mental illness appears to be a mediating factor rather than a primary cause (Steinert & Whittington, 2013; Clarke et al., 2010). So, it makes sense that disruptive behaviour occurs frequently in the psychiatry because the mediating factor of the psychopathology. This indicates that disruptive behaviour is developed when combining multiple risk-factors.
The expression of disruptive behaviour is different in specific situations. For this reason, situational circumstances can stimulate disruptive behaviour (Faay, van de Sande, Gooskens, & Hafsteinsdóttir, 2012; Steinert & Whittington, 2013). Many violent outbursts are preceded by frustrations or restrictions, frequently imposed by mental health professionals (Duxbury, 2002; Steinert & Whittington, 2013). Misperceptions of situations and misunderstanding of other people’s intentions and attitudes may also trigger disruptive behaviour (Steinert &
Whittington, 2013). These external factors indicate the development of disruptive behaviour, it does not arise suddenly. It’s a reaction on the situational circumstances, but when it can be stimulated it might also be prevented. For this, a complete understanding of the development of disruptive behaviour is needed.
The internal sign of impeding disruption of a patient has to be understood. For this, a deeper understanding of a patient’s functioning can be helpful (van de Sande et al., 2017). A multidimensional look at a patient’s functioning is the global functioning. According to
4
There are multiple observational tools for mental health professionals that focus on disruptive behaviour and the global functioning of a patient. The most studied observational questionnaire focusing on disruptive behaviour is the Brøset Violence Checklist (BVC). It is a valuable tool in acute psychiatry care units (Anderson & Jenson, 2019). The BVC measures disruptive behaviour on the basis of three types of behaviour (verbal threats, physical threats and violence against objects), and three patient related symptoms (confusion, irritability, and noisiness) as present or absent (Clarke et al., 2010; van de Sande, Mulder, & Nijman, 2013). The Kennedy Axis V (K-As) is a observational tool in evaluating a patient’s functioning (van de Sande et al., 2013; Kennedy, 2003). It has four subscales: psychological functioning, social functioning, violence (to self/others) and activities of daily living (ADL) – occupational skills (Kennedy, 2003). The four subscales together, the global functioning, capture the major clinical areas of a patient (Kennedy, 2003). The BVC has been previously used in studies about the association between disruptive behaviour and coercion or violent incidents (Partridge & Affleck, 2018; van de Sande et al., 2013). The K-As has been previously used in studies about the association between global functioning and coercion (van de Sande et al., 2013, 2017). However, no previous study researched the association between global functioning and disruptive behaviour. The existing research only gives some indication about the association between global functioning and disruptive behaviour.
Disruptive behaviour does not arise suddenly. In a study about disruptive behaviour among patients in the acute psychiatric care units, assessed with the BVC, the positive predictive values (PPV) for committing a violent incident in the next 24 hours was 16.7% for a score ≥ 1 (Partridge & Affleck, 2018). For patients who scored ≥2 on the BVC, the PPV for
an incident in the next 24 hours was 34.3% and patients who scored ≥3 on the BVC, had a PPV of 55.2%. A longitudinal study of van de Sande et al., (2013) about the association between the BVC and seclusion considered a score of ≥2 on the BVC, enough to intervene with de-escalation interventions. So, a higher presence of disruptive behaviour indicated a higher likelihood of a violent incident.
significant negatively association with seclusion. The association of global functioning and seclusion indicates that multiple subscales of global functioning might have an association with disruptive behaviour. To intervene at an early stage, it is important to know if and which subscales of global functioning have an association with disruptive behaviour over time.
The characteristics of a patient might in turn have an influence the association between global functioning and disruptive behaviour. Male sex, age < 35 years, having a personality disorder and having a substance abuse disorder were all significantly associated with a higher likelihood of seclusion (van de Sande at al., 2013, 2017). This could also indicate a higher likelihood of developing disruptive behaviour or a stronger association between global functioning and disruptive behaviour. Itself, indicating that global functioning may be a better predictor of disruptive behaviour in some subgroups of patients.
6
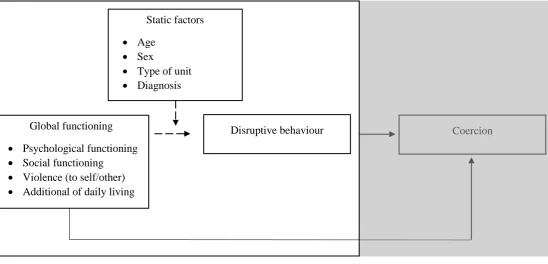
[image:7.595.28.577.77.341.2]
Known association Hypothesized Association
Figure 1. An Overview of the Hypothesized and Known Associations Between Global functioning, Static Factors, Disruptive
Behaviour and Coercion.
METHOD
The current study had a retrospective longitudinal design. Routine data was collected with the Brøset Violence Checklist (BVC) and Kennedy Axis V (K-As). This study contains daily measurements from these two instruments for each patient, admitted in two acute psychiatric care units, over a period of three years. The mental health professionals were trained to use these observational measurements as the basis for their daily report in the ‘Crisis Monitor’. All admitted patients were monitored twice a day, in the afternoon and evening, by different mental health professional working in their acute psychiatric care units.
Sample
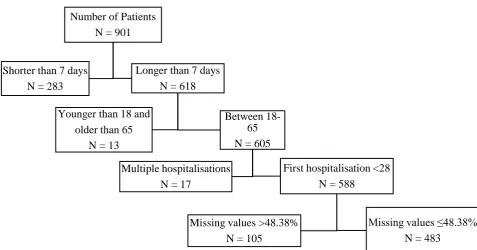
Data regarding all admitted patients of two acute psychiatric care units, of the same institute in different cities, were collected and used in the present study. The data was from the periods of 2016, 2017 and 2018. The data of the BVC and K-As was already collected in a database for patient related treatment processes. All patients admitted were included, but a minimum stay of 7 days was required for data analysis inclusion. Patients who were younger than 18 years and older than 65 years were excluded, because these patients belong in the youth psychiatric care
Coercion Disruptive behaviour
Global functioning Psychological functioning Social functioning
Violence (to self/other) Additional of daily living
Static factors Age
Sex
Number of Patients N = 901
Shorter than 7 days N = 283
Longer than 7 days N = 618
Younger than 18 and older than 65
N = 13
Between 18-65 N = 605
Multiple hospitalisations N = 17
First hospitalisation <28 N = 588
Missing values >48.38% N = 105
Missing values ≤48.38% N = 483
[image:8.595.53.531.486.736.2]8
[image:9.595.78.515.82.303.2]
Table 1. Number of Patients and Percentage of the Sex and Main Diagnoses Divided in Unit and the Total Sample.
Unit 1 Unit 2 Totaal
N % N % N %
Sex
Men 89 63.6% 158 46.1% 247 51.1%
Female 51 36.4% 185 53.9% 236 48.9%
Age
Age < 35 77 55.4% 135 39.4% 212 43.9%
Age > 35 62 44.6% 208 60.6% 271 56.1%
Main diagnoses
Mood or anxiety disorders 28 20% 129 37.6% 157 32.5% Psychotic disorders 94 67.1% 125 36.4% 219 45.3%
Personality disorder 8 5.7% 45 13.1% 53 11.0%
Neurobiological development disorder 3 2.1% 19 5.5% 22 4.6%
Other disorders 7 5.0% 25 7.3% 32 6.6%
Totaal 140 29.0% 343 71.0% 483 100%
Instruments
The Brøset Violence Checklist (BVC) is a validated observation instrument for measuring disruptive behaviour by patients in acute psychiatric care units. It identifies the risk of disruptive behaviour in the next period of four till eight hours (van de Sande et al., 2013). The BVC consists the following six items: confusion; irritability; noisiness; physical threat; verbal threat; and attack on objects. A patient with a score of two or more, on a range of zero till six, is more likely to become violent (van de Sande et al., 2013). A patient scoring 0 is at very low risk of disruptive behaviour, a patient scoring 1-2 is at moderate risk and when a patient scores more than 2 there is a very high risk (van de Sande et al., 2013). For a score of two or more points, a sensitivity of 0.657 and a specificity of 0.978 for prediction of violence in the next 24 hours was found (Partridge & Affleck, 2018). The BVC has a fair overall inter-rater reliability (k = 0.44) (Almvik, Woods, & Rasmussen, 2000). A Cronbach’s alpha of 0.71 was found for the first time point in days in this study.
or lower indicates problematic functioning in a specific area (Kennedy, 2003). Patients with a score of 50 or less, are often associated with the need of hospitalization. With the individual scores for each of the subscales, mental health professionals can generate a patient profile using the K-As. Also a Dangerousness Level (DL) of a patient can be generated. The numbers used to derive the DL are on the scoring sheet directly below each subscale score. The lowest score becomes the DL (Kennedy, 2003). The K-As has an outstanding overall inter-rater reliability (0.79) calculated with the intraclass correlation coefficient and Pearson’s r (Faay et al., 2012). A Cronbach’s alpha of 0.83 was found for the total score on first time point in days in this study.
Statistical analyses
Data were analysed using IBM SPSS version 23. A database was constructed that contained the highest daily assessment scores, as determined by the Brøset Violence Checklist (BVC) and the lowest daily assessment scores, as determined by the Kennedy Axis V (K-As). A high score on the BVC indicates disruptive behaviour and a low score on the K-As indicates poor global functioning. For each patient, the measurements between the first day till 28 days of hospitalization were used for analysis. Patients’ sex, age, main diagnosis, time of hospitalization and type of unit obtained for the hospital’s admissions database were also added. Descriptive statistics were used to characterize the sample. One way Anova and Chi-square test were used to find differences in mean age, frequency of sex and frequency of diagnoses between unit 1 and unit 2.
A series of linear mixed modelling for repeated measurements (LMM) with maximum likelihood estimation was used in this study (Field, 2017). LMM is a type of analysis method that can handle nested data and missing values (Field, 2017). A basic model is used with further expansion dependent on the specific research question. In the basic model the subjects were identified with the ID and the time point was repeated. A compound symmetry structure was selected for the repeated measurements covariance matrix, assuming a constant variance at each time point and a constant correlation between dependent measurements time (Field, 2017). The parameter estimates and tests for covariance parameters were selected as test statistics. Additionally, standardized z-scores were calculated for the dependent and independent variables using descriptive statistics to analyse the strength of the associations (Cohen, 1988). With the standardizes additional LMM is conducted, to calculated standardized Beta (β)
10
Scores of the instruments over time
Descriptive statistics were used to calculated the minimum, maximum, mean and standard deviation of the BVC, the K-As and the subscales of the K-As. Also a histogram was made to indicate the presence or absence of a normal distribution of data points over time of the BVC and the K-As. Furthermore, a graph was made to analyse the Estimated Marginal (EM) Mean score over time of the BVC, the K-As and the subscales of the K-As with LMM. The BVC, the K-As and the subscales of the K-As were indicated as dependent variable, time point as fixed factor and EM means display means for time point. To identify the associations between the subscales of the K-As, the Pearson correlation between the standardized scores were analysed at time point 0, 14 and 28 days (Cohen, 1988). At last, to analyse the EM mean of the BVC and the K-As over time divided in sex, age, unit and diagnose, the static factors were categorised in dummy’s. A graph was made with the databases selected on the dummy.
Static predictors of BVC
The association between the static factors and the BVC was analysed with LMM. The BVC was indicated as the dependent variable and the static factors sex, age, unit and type of diagnose were indicated as the fixed factor. The analyses were univariate and multivariate conducted.
Association with BVC over time
To analyse the association between the K-As and the BVC over time, the BVC was indicated as a dependent variable and the total K-As score as fixed covariant in the LMM. The association between the subscales of the K-As and the BVC over time was analysed using the subscales of the K-As indicated as fixed covariates in the LMM. This analyses was univariate and multivariate conducted.
Interaction effect
Finally, the interaction effect of the static factors on the association between the K-As and the BVC was analysed with LMM. The static factors sex, age, unit and type of diagnosis were indicated as factor. The static factors, the covariate K-As, and the static factors * covariate were indicated as fixed effects. The analyses were univariate and multivariate conducted. To compare the static factor, the database was selected on the dummy of the static factor for a simple slope test for interpreting.
RESULTS
Scores of the instruments over time
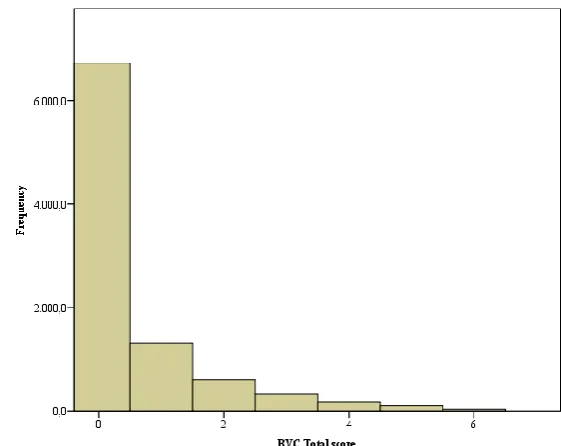
In the present study, data of the Brøset Violence Checklist (BVC) and the Kennedy Axis V (K-As) of 483 patients were analysed. The observed frequency of the BVC Total score ranged from 0 (n=6724, 72.1%), 1 (n=1309, 14.0%), 2 (n=609, 6.5%), 3 (n=323, 3.5%), 4 (n=181, 1.9%), 5 (n=99, 1.1%) and 6 (n=34, 0.4%) across all data points. As Figure 3 shows, data were severely skewed to the right. Table 2 shows the mean score of the BVC
[image:12.595.282.563.255.478.2](M=0.53, SD=1.07). The item irritability had the highest mean (M = 0.19, SD = 0.40), and the item physical threat had the lowest mean (M = 0.03, SD, 0.18), over all measurements. As would be expected during the course of treatment, the Estimated Marginal (EM) mean score of the BVC decreased and tended to stabilize over time. The EM mean score showed a lot of fluctuation in the 28 day period (Fig. 4). Also, the mean score of the K-As is shown in Table 2, these scores were more normally distributed. The mean score of K-As was 52.89 with a standard deviation of 10.25. The subscale violence had the highest mean (M = 57.90, SD = 11.24) and the subscale psychological functioning had the lowest mean (M = 49.77, SD = 11.32). As expected the EM mean score of the K-As increased and tended to stabilize over time (Fig. 5).
12 44,000 46,000 48,000 50,000 52,000 54,000 56,000 58,000
0 1 2 3 4 5 6 7 8 9 10 11 12 13 14 15 16 17 18 19 20 21 22 23 24 25 26 27 28
EM M ea n K -A s T o tal sc o re
Time point in days
,000 ,100 ,200 ,300 ,400 ,500 ,600 ,700
0 1 2 3 4 5 6 7 8 9 10 11 12 13 14 15 16 17 18 19 20 21 22 23 24 25 26 27 28
EM M ea n BV C T o tal sc o re
[image:13.595.70.525.92.555.2]Time point in days
Table 2. Number of data points, Minimum, Maximum, Mean, Standard Deviation (SD) and Cronbach’s Alpha of the
Kennedy Axis V and the Brøset Violence Checklist.
N Minimum Maximum Mean Standard deviation
Cronbach’s alpha
Kennedy Axis V 0.83
Total score 8948 0 98 52.89 10.25
Psychological functioning 8934 0 90 49.77 11.32 Social functioning 8937 0 100 53.52 11.70
Violence 8850 0 100 57.90 11.24
ADL 8932 0 100 52.61 11.21
Brøset Violence Checklist
0.71
Total score 9257 0 6 0.53 1.07
Confused 9265 0 1 0.13 0.34
Irritability 9277 0 1 0.19 0.40
Noisness 9278 0 1 0.10 0.30
Physical threat 9276 0 1 0.03 0.18
Verbal threat 9276 0 1 0.05 0.23
Attack 9273 0 1 0.04 0.19
[image:13.595.71.525.95.543.2]Figure 4. Estimated Marginal Mean Scores of the Brøset Violence Checklist Over Time
[image:13.595.81.520.593.776.2]30,000 35,000 40,000 45,000 50,000 55,000 60,000 65,000
0 2 4 6 8 10 12 14 16 18 20 22 24 26 28
EM
M
ea
n
K
-A
s
T
o
tal
sc
o
re
Time point in days
Psychological functioning
Social functioning
Violent (to self/other)
ADL
Subscales of the K-As
The EM mean score of the subscales of the K-As increases and tended to stabilize over time (Fig. 6). Of the four subscales psychological functioning had the highest increase of 9.491 in 28 days. The subscale social functioning showed the smallest increase of 5.544 in 28 days.
The Pearson correlation of the standardized scores of the BVC and the subscales of the K-As are shown in Table 3. The subscales of the K-As were all significantly correlated with disruptive behaviour. Psychological functioning had a low and medium correlation (p < 0.001), social functioning had a medium correlation (p < 0.001), violence (to self/other) had a low and medium correlation (p < 0.001) and ADL had a low correlation (p < 0.001). Over time the subscale violence (to self/other) tended to show a stronger correlation with disruptive behaviour and ADL showed a weaker correlation. Furthermore, the subscales were significantly correlated to each other. Psychological functioning and social functioning showed a strong correlation with each other (p < 0.001). Psychological functioning, social functioning and ADL had a low and medium correlation with violence (to self/other) (p < 0.001). Psychological functioning and social functioning had a medium and high correlation with ADL (p < 0.001). The subscale psychological functioning tended to a stronger correlation with the other subscales over time. The correlation of the other subscales tended to increases and then decreases over time.
[image:14.595.82.433.175.411.2]14
Static factors
The EM Mean of the BVC and the EM mean of the K-As is shown in figure 7-14 and appendix II stratified by the static factors over time. The BVC and K-As scores were not so different between male and female patients (Appendix II, Figure 1 and 2). In contrast, patients with an age < 35 years had a higher BVC score in almost all time points, this variable fluctuated a lot (Fig. 7). The K-As score was lower in all time points when compared to patients with an age ≥35 years (Fig. 8).
42,000 44,000 46,000 48,000 50,000 52,000 54,000 56,000 58,000 60,000
0 1 2 3 4 5 6 7 8 9 10 11 12 13 14 15 16 17 18 19 20 21 22 23 24 25 26 27 28
[image:15.595.75.440.234.436.2]EM m ea n o f K -A s T o tal sc o re Time point Age <35 Age ≥35 Figure 7. Estimated Marginal Mean Scores of Age of the Brøset Violence Checklist Over Time
,000 ,100 ,200 ,300 ,400 ,500 ,600 ,700 ,800
0 1 2 3 4 5 6 7 8 9 10 11 12 13 14 15 16 17 18 19 20 21 22 23 24 25 26 27 28
EM m ea n o f BV C T o tal sc o re Time point
Age < 35
Age ≥35
[image:15.595.85.446.499.703.2]Furthermore, a difference between the two units is present. Figure 9 and 10 show a higher score on the BVC and a lower score on the K-As, for unit 1 compared to unit 2. The BVC score fluctuates a lot in unit 1, with a large decrease and increase between days 19 and 22. Also, patients with a mood or anxiety disorder had a lower score on the BVC and a higher score on the K-As, when compared to patients with other psychiatric disorders (Appendix II, Figure 3 and 4). Further, figure 11 and 12 show a higher score on the BVC and a lower score on the K-As, for patients with a psychotic disorder, compared to patients with other disorders than psychotic disorders. 0,000 0,200 0,400 0,600 0,800 1,000 1,200 1,400
0 1 2 3 4 5 6 7 8 9 10 11 12 13 14 15 16 17 18 19 20 21 22 23 24 25 26 27 28
[image:16.595.74.456.254.456.2]EM m ea n s o f BV C T o tal sc o re Time point Unit 1 Unit 2
Figure 9. Estimated Marginal Mean Scores of the Unit of the Brøset Violence Checklist Over Time
0,000 10,000 20,000 30,000 40,000 50,000 60,000 70,000
0 1 2 3 4 5 6 7 8 9 10 11 12 13 14 15 16 17 18 19 20 21 22 23 24 25 26 27 28
EM m ea n s o f K -A s T o tal S co re Time point Unit 1 Unit 2
[image:16.595.68.501.510.701.2]16
For patients with a personality disorder, there is a clear deviation of the overall trend of a decreasing BVC score over time. Furthermore, there is a lot of fluctuation within the BVC score, possibly through the decreasing number of patients over time (Fig. 13). Also, in the K-As score there is a lot of fluctuation over time (Fig. 14). At last, patients with a neurobiological development disorder had a lower score on the BVC (Fig. 15) compared to other patients. In the K-As score, were no big differences noticed (Fig. 16).
0,000 0,200 0,400 0,600 0,800 1,000 1,200
0 1 2 3 4 5 6 7 8 9 10 11 12 13 14 15 16 17 18 19 20 21 22 23 24 25 26 27 28
EM m ea n s o f BV C T o tal sc o re Time point Psychotic disorder Other disorders than psychotic disorder 0,000 10,000 20,000 30,000 40,000 50,000 60,000 70,000
0 1 2 3 4 5 6 7 8 9 10 11 12 13 14 15 16 17 18 19 20 21 22 23 24 25 26 27 28
[image:17.595.81.525.74.275.2]EM m ea n s o f K -A s T o tal sc o re Time point Psychotic disorder Other disorders than psychotic disorder Figure 11. Estimated Marginal Mean Scores of Psychotic Disorder of the Brøset Violence Checklist Over Time
[image:17.595.89.517.257.508.2]
Figure 13. Estimated Marginal Mean Scores of Personality disorder of the Brøset Violence Checklist Over Time
44,000 46,000 48,000 50,000 52,000 54,000 56,000 58,000 60,000
0 1 2 3 4 5 6 7 8 9 10 11 12 13 14 15 16 17 18 19 20 21 22 23 24 25 26 27 28
EM m ea n s o f K -A s T o tal so cre Time point Personality disorder Other disorders than personality disorder ,000 ,100 ,200 ,300 ,400 ,500 ,600 ,700 ,800
0 1 2 3 4 5 6 7 8 9 10 11 12 13 14 15 16 17 18 19 20 21 22 23 24 25 26 27 28
EM m ea n s o f BV C T o tal so cre Time point Personality disorder Other disorders than personality disorder
[image:18.595.89.515.321.522.2]18 ,000 ,100 ,200 ,300 ,400 ,500 ,600 ,700 ,800
0 1 2 3 4 5 6 7 8 9 10 11 12 13 14 15 16 17 18 19 20 21 22 23 24 25 26 27 28
EM m ea n s o f BV C T o tal sc o re Time point Neurobiological development disorder Other disorders than neurobiological development disorder 0,000 10,000 20,000 30,000 40,000 50,000 60,000 70,000
0 1 2 3 4 5 6 7 8 9 10 11 12 13 14 15 16 17 18 19 20 21 22 23 24 25 26 27 28
[image:19.595.76.510.77.274.2]EM m ea n e o f K -A s T o tal sc o re Time point Neurobiological development disorder Other disorders than neurobiological development disorder
[image:19.595.75.513.303.510.2]Table 3. Pearson Correlation of the Standardized Scores of the Brøset Violence checklist and the Subscales of the Kennedy Axis V on Time Point 0, 14 and 28 in Days.
BVC Totaal Psychological functioning Social functioning Violent (to self/other)
ADL
TP 0 TP14 TP28 TP0 TP14 TP28 TP0 TP14 TP28 TP0 TP 14 TP28 TP0 TP14 TP28
BVC Totaal 1 1 1
Psychological functioning -.569 (n=456) -.488 (n=296) -.505 (n=189)
1 1 1
Social functioning -.579 (n=456) -.516 (n=296) -.567 (n=189) 0.721 (n=457) 0.807 (n=297) 0.828 (n=189)
1 1 1
Violent (to self/other) -.398 (n=452) -.517 (n=293) -.534 (n=186) 0.392 (n=453) 0.561 (n=294) 0.597 (n=186) 0.455 (n=454) 0.630 (n=294) 0.591 (n=186)
1 1 1
ADL -.453
(n=454) -.428 (n=294) -.392 (n=189) 0.681 (n=455) 0.791 (n=295) 0.728 (n=186) 0.653 (n=455) 0.784 (n=295) 0.696 (n=189) 0.378 (n=452) 0.528 (n=292) 0.436 (n=186)
1 1 1
20
[image:21.842.40.762.85.453.2]
Table 4. Linear Mixed Modelling for Repeated Measurement of the Brøset Violence Checklist
Univariate Multivariate
b SEь 95% CI β SEβ P-value b SEь 95% CI β SEβ P-value Static factors Sex -.054 0.063 -.177, 0.068 -.051 0.058 0.384 0.118 0.06 0.005, 0.231 0.109 0.054 0.042* Age -.165 0.063 -.288, -.042 -.154 0.058 0.009* -.079 0.057 -.190, 0.032 -.074 0.053 0.163 Unit -.529 0.058 -.643, -.414 -.494 0.055 0.000* -.435 0.058 -.550, -.321 -.407 0.055 0.000* Mood or anxiety disorder 0.311 0.065 0.183, 0.439 0.291 0.061 0.000* 0.058 0.116 -.170, 0.286 0.054 0.108 0.617* Psychotic disorder -.496 0.059 -.612, -.382 -.464 0.055 0.000* -.325 0.116 -.551, -.099 -.304 0.107 0.005* Personality disorder 0.308 0.099 0.113, 0.503 0.288 0.093 0.002* 0.165 0.135 -.101, 0.430 0.154 0.126 0.224 Neurobiological development disorder 0.384 0.150 0.088, 0.679 0.358 0.141 0.011* 0.199 0.168 -.131, 0.529 0.186 0.157 0.237 Other disorders 0.129 0.126 -.118, 0.377 0.121 0.118 0.305 0ª 0ª 0ª 0ª
Kennedy Axis V
Total score -.045 0.001 -.048, -.043 -.435 0.011 0.000*
Psychological functioning -.041 0.001 -.043, -.039 -.431 0.011 0.000* -.014 0.002 -.017, -.011 -.151 0.016 0.000* Social functioning -.041 0.001 -.044, -.040 -.457 0.011 0.000* -.020 0.001 -.023, -.017 -.219 0.015 0.000* Violent -.039 0.001 -.041, -.037 -.409 0.010 0.000* -.023 0.001 -.025, -.021 -.238 0.012 0.000* ADL -.030 0.001 -.032, -.028 -.318 0.011 0.000* -.001 0.001 -.003, 0.002 -.005 0.014 0.730 Interaction
effect
K-As Total score * Male -.007 0.002 -.011, -.002 -.064 0.021 0.002* 0.002 0.002 -.003, 0.006 0.017 0.022 0.430 K-As Total score * Age <35 -.015 0.002 -.019, -.010 -.520 0.166 0.000* -.011 0.002 -.016,-.007 -.108 0.022 0.000* K-As Total score * Unit 1 -.035 0.003 -.040, -.030 -.330 0.024 0.000* -.027 0.003 -.032, -.022 -.261 0.025 0.000* K-As Total score * Mood or
Anxiety disorder
0.019 0.002 0.015, 0.024 0.183 0.022 0.000* 0.001 0.005 -.009, 0.011 0.008 0.048 0.873
K-As Total score * Psychotic disorder -.030 0.002 -.034, -.026 -.289 0.021 0.000* -.021 0.005 -.031, -.011 -.202 0.048 0.000* K-As Total score * Personality disorder 0.020 0.004 0.012, 0.027 0.188 0.036 0.000* 0.009 0.006 -.003, 0.020 0.084 0.057 0.139 K-As Total score * Neurobiological
development disorder
0.036 0.006 0.024, 0.047 0.341 0.057 0.000* 0.022 0.008 0.007, 0.036 0.208 0.071 0.004*
K-As Total score * Other disorders 0.009 0.005 0.086 0.047 0.067 0ª 0ª 0ª 0ª
Static predictors of BVC
The outcomes of the linear mixed models for repeated measurements are shown in Table 4. The association between the static factors sex, age, unit and type of diagnoses and disruptive behaviour was analysed. In the univariate model patients aged < 35, hospitalized in unit 1 (F(1, 702.348) = 82.181, t = -9.065, β = -.494) or patients with a psychotic disorder (F(1, 489.058) = 71.642, t = -8.464, β = -.464) had a significantly higher BVC score. Patients with a mood or anxiety disorder, personality disorder or a neurobiological development disorder had a significantly lower BVC score (Table 4.). In the multivariate model patients hospitalized in unit 1 (F(1, 702.291) = 55.520, t = -7.451, β = -.407) or diagnosed with a psychotic disorder had a significant higher BVC score (t (486.154) = -2.826, β = -.304). Unexpectedly male patients had a significantly lower BVC score (F(1, 483.437) = 4.177, t = 2.044, β = 0.109) (Table 4.).
Association with BVC
Total K-As
The association of global functioning with disruptive behaviour was analysed (Table 4.)
Global functioning was significantly associated with disruptive behaviour over time (F
(1,7764.55) = 1721.46, t = -41.49. The standardized score indicates a moderate association (β = -.436, SEβ = 0.011).
Subscales of K-As
In the univariate model, the subscales psychological functioning (F(1,7060.48) = 1536.40, t = -39.20, β = -.431), social functioning (F(1,7108.55) = 1793.51, t = -42.35, β = -.458), violent (to self/other) (F(1,8696.75) = 1746.83, t = -41.80, β = -.409) and ADL (F(1,7926.92) = 830.15,
22
Between – within patient
The association of global functioning with disruptive behaviour was next analysed between-patients and within each individual patient. The between-patient correlation of the K-As was significantly negatively associated with disruptive behaviour over time (F(1, 488.443) = 474.701, t = -21.788, β = -.588, SEβ = 0.027, p < 0.001). The standardized score indicated a
strong association. This indicated that the variability in the overall K-As is associated with the BVC across patients. The within-patient correlation of the K-As was also significantly negatively associated with disruptive behaviour over time (F(1, 8420.672) = 1314,037, t = -36.250, β = -.411, SEβ = 0.011, p < 0.001). The standardized score shows a moderate
association, this indicates that a specific individual variation in the K-As is associated with the BVC. In conclusion it can be stated, that an individual decrease in global functioning has a negative effect on the disruptive behaviour of that patient or vice-versa.
Interaction effect
The interaction effect of the static factors sex, age, unit and type of diagnosis on the association between global functioning and disruptive behaviour were analysed (Table 4.). Sex, the diagnosis mood or anxiety disorder and personality disorder all had a significant interaction effect in the univariate model. However, in the multivariate model there was no interaction effect present between these static factors and the association of global functioning with disruptive behaviour.
Age
In the univariate model a significant negative interaction effect was found for the age < 35 (F
Unit
In the univariate model a significant negative interaction effect was found for Unit 1 (F
(1,8610.96) = 183.55, t = -13.55, β = -.330) on the association. In the multivariate model, a significant negative interaction effect remained for Unit 1 (F (1,8534.701) = 111.074, t = -10.54, β = -.261) on the association. The estimate β of patients in Unit 1 (β = -.679) was stronger that the estimate β of patients in Unit 2 (β = -.342) (Table 5.). Unexpectedly patients in unit 1
had a stronger association between global functioning and disruptive behaviour when compared to patients in unit 2.
Psychotic disorder
In the univariate model a significant negative interaction effect was found for the diagnosis psychotic disorder (F (1, 8080.67) = 188.33, t = -13.72, β = -.289) on the association when compared to the other diagnoses. In the multivariate model, a significant negative interaction effect remained for the diagnosis psychotic disorder (t = -4.233, β = -.202). The estimate β of patients with a psychotic disorders (β = -.583) was stronger that the estimate β of patients with other disorders than psychotic disorder (β = -.295) (Table 5.). This indicates that patients with a psychotic disorder had a stronger association between global functioning and disruptive behaviour.
Neurobiological development disorder
In the univariate model a significant positive interaction effect was found for the diagnosis neurobiological development disorder (F (1, 8900.51) = 36.37, t = 6.03, β = 0.341) on the association when compared to the other diagnoses. In the multivariate model, a significant negative interaction effect remained for the diagnosis neurobiological development disorder (t
24
[image:25.595.74.520.85.323.2]
Table 5. βeta estimates of Kennedy Axis V on the association with the BVC conducted with Standardized Scores
β SEβ 95% CI P-value
Male -.471 0.016 -.0502, -.441 0.000*
Female -.400 0.014 -.428, -.373 0.000*
Age < 35 -.521 0.019 -.558, -.485 0.000*
Age ≥ 35 -.378 0.012 -.402, -.354 0.000*
Unit 1 -.679 0.030 -.737, -.621 0.000*
Unit 2 -.342 0.010 -.361, 0.321 0.000*
Mood or Anxiety disorder -.313 0.015 -.341, -.284 0.000* Other disorders than Mood or Anxiety -.497 0.014 -.525, -.469 0.000*
Psychotic disorder -.583 0.018 -.619, -.547 0.000*
Other disorders than psychotic disorder -.295 0.012 -.317, -.272 0.000* Personality disorder -.279 0.027 -.332, -.226 0.000* Other disorders than personality disorders -.453 0.011 -.475, -.430 0.000* Neurobiological development disorder -.107 0.027 -.160, -.054 0.000* Other disorders than neurobiological
development disorder
-.448 0.011 -.469, -, 427 0.000*
DISCUSSION
The aim of this study was to examine the longitudinal association between global functioning and disruptive behaviour. Disruptive behaviour of a patient in the acute psychiatric care might be predicted and prevented by analysing the global functioning of a patient. Preventing disruptive behaviour assures coercion could be reduced to a minimum and the health, safety and wellbeing of both patient and staff could be improved. Global functioning and disruptive behaviour can both fluctuate in a matter of hours (Steinert et al., 2007). To find an association that is time-varying, a longitudinal database was used of registrations during 28 days of hospital admission of 483 patients from two acute psychiatric care units.
Dynamic factors
The findings of this study showed that, global functioning was associated with disruptive behaviour over time. However, the causal direction is unclear. It is hypothesised that global functioning has an influence on disruptive behaviour as shown in fig. 1. As disruptive behaviour arises through different symptoms and behaviours that are part of the global functioning of a patient (Silver, as cited in Brendel, 2010). A change in the global functioning of a patient has an effect on development of disruptive behaviour of that patient, or vice versa. However, a decrease in global functioning does not have to be the cause of an increase of disruptive behaviour. It could also just indicate a worse global functioning of a patient and that disruptive behaviour may occur. To predict disruptive behaviour through the changes in the global functioning, the causal direction has to be confirmed. Further research is needed explained in ‘Research implications and recommendations’.
26
Static factors
Some static factors of patients were related to a higher likelihood of disruptive behaviour. In this study we did not find higher scores on disruptive behaviour for male patients. Male patients had a lower score of disruptive behaviour compared with female patients. This is not in line with the higher likelihood of seclusion of male patients in previous studies (van de Sande et al., 2013). Male sex is one of the strongest individual predictors of violent behaviour according to Bonta et al., (as cited in Steinert & Whittington, 2013). It is possible that male patients have a higher likelihood of seclusion because they are considered to be more dangerous. Disruptive behaviour captures more than only violent behaviour and seclusion is a consequence of disruptive behaviour.
Furthermore, patients hospitalized with the diagnosis psychotic disorder had a higher risk of disruptive behaviour. Figure 11 showed how patients with a psychotic disorder had a higher score of disruptive behaviour over time compared with patients with another psychiatric disorder. This is in line with the study of Brendel et al., (2010) were patients with a psychotic disorder had a higher likelihood of disruptive behaviour.
Patients with a personality disorder have a strong association with disruptive behaviour (van de Sande et al., 2013; Brendel et al., 2010), this study was unable to demonstrated this conclusion. However, it is interesting to note, that patients with a personality disorder had an increase in disruptive behaviour after day 22. It might be possible that the chance of a crisis accompanied by self-destructive behaviour gets higher for these patients during hospitalization. On the other hand, there could be changes in treatment plans or other influential changes happening for these type of patients. Also, on day 22 the data-base consisted less patients. The data-base consisted only patients who were hospitalized of a longer period of time and had possibly a higher case load. This effects the interpretation of the data. In future research the hospitalization process of patients with a personality disorder is interesting to examine.
has a stronger association. In conclusion, the global functioning may be a better predictor of disruptive behaviour in some subgroups of patients.
Methodological strengths and weaknesses
The present study had some limitations. A clear limitation were the many missing values on the Kennedy Axis V (K-As) as a lot of patients had to be excluded from the data. The exclusion of patients with missing values was based on the mean percentage of missing values and may have let to sampling bias. Also, the data of the Brøset Violence Checklist (BVC) had a severely skewed distribution. A normal distribution of the data on the BVC could expand the validity of the study, but this is obviously not desired in the clinical acute psychiatric care. However, the number of data points collected in this study could be considered as reasonably high. Longitudinal studies in similar settings conducted in the Netherlands had weekly assessments (van de Sande et al., 2017) or were only conducted for the duration of one year (van de Sande et al., 2013). This study had data from daily assessments for the duration of three years conducted in two different acute psychiatric care units. Nevertheless the number of data points does not clear the problem of the skewed distribution of the BVC. In further research Generalized Linear Mixed Modelling (GLMM) can be used to better handle the skewed distribution of the dependent variable.
A strength of the present study was the scores of the subscales of global functioning. The score of the subscales expand the generalizability of the study. The mean score of the subscales were consistent with data obtained from the study of Higgins and Purvis (2000) who also showed that psychological functioning had the lowest mean and violence (to self/other) had the highest mean. In a longitudinal study conducted in a group of schizophrenic patients, psychological functioning had the lowest mean score compared the other subscales (Kennedy, 2003). Finally, the subscale violence (to self/other) had the highest mean compared to the other subscales in the study of van de Sande et al., (2013). The scores of the subscales are generalizable to the acute psychiatric care units in the Netherlands.
28
Research implications and recommendations
To improve the health, safety and wellbeing of both patient and staff, coercion needs to be reduced to a minimum extend by preventing disruptive behaviour. Previous studies have revealed that disruptive behaviour needs to be controlled at an early stage (Faay et al., 2012; Steinert & Whittington, 2013). Therefore, integration of the use of the BVC and the K-As, assessed in daily reports, can help mental health professionals to identify current signals on psychological functioning, social functioning and violence (to self/other). Using these instruments on a daily basis during hospitalisation can support teams to analyse changes over time, because the patients global functioning can fluctuate in the matter of hours (Steinert el al., 2007). It gives more information for tailoring individualized treatment plans to prevent disruptive behaviour.
A next step is to analyse the direction of the association between global functioning and disruptive behaviour, for instance with a cross-lagged panel model. It is hypothesized that global functioning has an effect on disruptive behaviour. However, it is unknown to what extent global functioning influences disruptive behaviour, or vice versa. Also a deeper understanding of the process of disruptive behaviour and patterns in the global functioning within a patient is important to tailor individualized treatment plans. In a study conducted by van de Sande et al. (2013), a cut-off score of <30 for psychological- social functioning and <50 on violence (to self/others) was advised for the possible presence of violence behaviour. However, difference were found in subgroups of patients, personal cut-off scores as Kennedy (2003) recommend could be conducted through single-case studies. With a personal cut-off score on the subscales, the time to develop disruptive behaviour could be predicted with for instance survival analyses.
Conclusion
30
Appendix II Graph of Estimated Marginal Mean scores over time 44,000 46,000 48,000 50,000 52,000 54,000 56,000 58,000 60,000
0 1 2 3 4 5 6 7 8 9 10 11 12 13 14 15 16 17 18 19 20 21 22 23 24 25 26 27 28
M ea n K -a s T o tal sc o re Time point Male Female ,000 ,100 ,200 ,300 ,400 ,500 ,600 ,700 ,800 ,900
0 1 2 3 4 5 6 7 8 9 10 11 12 13 14 15 16 17 18 19 20 21 22 23 24 25 26 27 28
M ea n BV C T o tal sc o re Time point Male Female 0,000 10,000 20,000 30,000 40,000 50,000 60,000 70,000 M ea n K -A s T o tal sc o
re Mood and Anxiety
disorder
32
,000 ,100 ,200 ,300 ,400 ,500 ,600 ,700 ,800 ,900
0 1 2 3 4 5 6 7 8 9 10 11 12 13 14 15 16 17 18 19 20 21 22 23 24 25 26 27 28
M
ea
n
BV
C
T
o
tal
sc
o
re
Time point
Mood and anxiety disorder
REFERENCES
Abderhalden, C., Needham, I., Dassen, T., Halfens, R., Haug, H.J., & Fisher, J.E. (2008). Structured Risk Assessment and Violence in Acute Psychiatric Wards: Randomised Conroled Trial. The Britisch Journal of Psychiatry, 193, 44-50. doi: 10.1192/bjp.bp.107.045534
Almvik, R., Woods P., & Rasmussen, K. (2000). The Broset Violence Checklist: Sensitivity, Specificity, and Interrater Reliability. Journal of Interpersonal Violence, 15 (12),
1284-1296. https://doi.org/10.1177/088626000015012003
Amore, M., Menchetti, M., Tonti, C., Scarlatti, F., Lundgren, E., Esposito, W., & Berardi D. (2008). Predictors of Violent Behavior Among Acute Psychiatric Patients: Clinical Study. Psychiatry and Clinical Neurosciences, 62, 247-255. doi: 10.111/j.1440-1819.2008.01790.x
Anderson, K.K., & Jenson, C.E. (2019). Violence Risk-assessment Screening Tools for Acute Care Mental Health Settings: Literature Review. Archives of Psychiatric Nursing, 33, 112-119. https://doi.org/10.1016/j.apnu.2018.08.012
Argus Informatie Centrum. (2016). GGZ: Aantal Vrijheidsbeperkende Interventies. Retrieved from https://www.staatvenz.nl/kerncijfers/ggz-aantal-vrijheidsbeperkende-interventies Bonner, G., Lowe, T., Rawcliffe, D., & Wellman, N. (2002). Trauma for all: a Pilot Study of
the Subjective Experience of Physical Restraint for Mental Health Inpatients and Staff in the UK. Journal of Psychiatric and Mental Health Nursing, 9, 465-473. https://doi.org/10.1046/j.1365-2850.2002.00504.x
Brendel, R.W., Wei, M.H., & Edersheim, J.G. (2010). An Approach to the Patient in Crisis: Assessments of the Risk of Suicide and Violence. Medical Clinics, 94 (6), 1089-1102. doi: 10.1016/j.mcna.2010.08.002
Chieze, M., Hurst, S., Kaiser, S., & Sentissi, O. (2019). Effects of Seclusion and Restraint in Adult Psychiatry: A Systematic Review. Frontiers in Psychiatry, 10 (491),1-19. doi: 10.3389/fpsyt.2019.00491
Clarke, D.E., Brown, A.M., & Griffith, P. (2010). The Brøset Violence Checklist: Clinical Utility in a Secure Psychiatric Intensive Care Setting. Journal of Psychiatric and Mental Health Nursing, 17, 614-620. doi: 10.1111/j.1365-2850.2010.01558.x
Cohen, J. (1988 ). Statistical Power Analysis for the Behavioural Sciences. (2nd ed.).
34
Curran, P.J., & Bauer, D.J. (2011). The Disaggregation of Within-Person and Between-Person Effects in Longitudinal Models of Change. Annual Review of Psychology, 62, 538-619. doi: 10.1146/annurev.psych.093008.100356
Currier, G.W. (2003). The Controversy over ‘Chemical Restraint’ in Acute Care Psychiatry.
Journal of Psychiatric Practice, 9 (1), 59-70. Retrieved from https://journals.lww.com /practicalpsychiatry/Abstract/2003/01000/The_Controversy_over__Chemical_Restrain t__in_Acute.6.aspx
Duxbury, J. (2002). An Evaluation of Staff and Patient Views of and Strategies Employed to Manage Inpatient Aggression and Violence on One Mental Health Unit: a Pluralistic Design. Journal of Psychiatric and Mental Health Nursing, 9, 325-337. https://doi.org/10.1046/j.1365-2850.2002.00497.x
Duxbury, J., Hahn, S., Needham, I., & Pulsford, D. (2008). The Management of Aggression and Violence Attitude Scale (MAVA): a Cross-national Comparative Study. Journal of Advanced Nursing, 62(5), 596-606. doi: 10.1111/j1365-2648.2008.04629.x
Faay, M.D.M., Gooskens, F., & Hafsteinsdóttir, T.B. (2012). Kennedy Axis V: Clinimetric Proporties Assessed by Mental Health Nurses. International Journal of Mental Health Nursing. doi: 10.1111/j.1447-0349.2012.00887.x
Field, A. (2017). Discovering Statistics Using IBM SPSS Statistics (5nd ed.). Newbury Park: Sage Publications LTD
Fiorillo, A., Giacco, D., De Rosa, C., Kallert T., Katsakou, C., Onchev, G., Raboch, J., Mastrogianni, A., Del Vecchio, V., Luciano, M., Catapano, F., Dembinskas, A., Nawka, P., Kiejna, A., Torres-Gonzales, G., Kjellin, L., Maj, M., & Priebe, S. (2011) Patient Characteristics and Symptoms Associated with Perceived Coercion During Hospital Treatment. Acta Psychiatrica Scandinavica, 1-8. doi: 10.1111/j.1600-0447.2011.01809 .x
Gerace, A., & Muir-Cochrane, E. (2019). Perceptions of Nurse Working with Psychiatric Consumers Regarding the Elimination of Seclusion and Restraint in Psychiatric Inpatient Settings and Emergency Departments: An Australian Survey. International Journal of Mental Health Nursing, 28, 209-225. doi:10.1111/inm.12522
Gudjonsson, G.H., Rabe-Hesketh, S., & Szmulker, G. (2004). Management of Psychiatric In-patient Violence: Patient Ethnicity and Use of Medication, Restraint and Seclusion.
British Journal of Psychiatry, 184, 258-262. https://doi.org/10.1192/bjp.184.3.258 Higgins, J., & Purvis, K. (2000). A Comparison of the Kennedy Axis V and the Global
https://journals.lww.com/practicalpsychiatry/Abstract/2000/03000/A_Comparison_of_ the_Kennedy_Axis_V_and_the_Global.5.aspx
Hvidhjelm, J., Sestoft, D., Skovgaard, L.T., & Bjorner, J.B. (2014). Sensitivity and Specificity of the Brøset Violence Checklist as Predictor of Violence in Forensic Psychiatry.
Nordic Journal of Psychiatry, 68 (8), 536-542. doi: 10.3109/08039488.2014.880942 Janssen, W.A., Noorthoorn, E.O., de Vries, W.J., Hutschemeakers, G.J.M., Widdershoven,
G.A.M., Lendemeijer, H.H.G.M. (2008). The Use of Seclusion in the Netherlands Compared to Countries in and Outside Europe. International Journal of Law and Psychiatry, 31, 463-470. https://doi.org/10.1016/j.ijlp.2008.09.002
Janssen, W.A., van de Sande, R., Noorthoorn, E., Nijman, H.L.I., Bowers, L., Mulder, C.L., Smit, A., Widdershoven, G.A.M., & Steinert, T. (2011). Methodological issues in monitoring the Use of coercive measures. International Journal of Law and Psychiatry, 34 (6), 419-428. https://doi.org/10.1016/j.ijlp.2011.10.008
Kennedy, J.A. (2003). Mastering the Kennedy Axis V: A new psychiatric assessment of patient functioning. Washington, DC: American Psychiatric Publishing, Inc.
Krippl, M., & Karim, A. A. (2011). ‘Theory of mind’ and its neuronal correlates in
forensically relevant disorders. Der Nervenarzt, 82 (7), 843–852. doi: 10.1007/s00115-010-3073-x
van der Molen, H.T., Perreijn, S., & van den Hout, M.A. (2007). Klinische psychologie: Theorieën en psychopathologie (2nd ed.). Groningen/Houten, NL: Wolters-Noordhoff. National Mental Health Consumer & Carer Forum. (2009). Ending Seclusion and Restraint in Australian Mental Health Services. Retrieved form https://nmhccf.org.au/publication /ending-seclusion-and-restraint-australian-mental-health-services-2009-revised-2010 Partridge, B., & Affleck, J. (2018). Predicting Aggressive Patient Behaviour in a Hospital
Emergency Department: An Empirical Study of Security Officers Using the Brøset Violence Checklist. Australasian Emergency Care, 21, 31-35. https://dio.org/10.1016/j.auec.2017.11.001
Renwick, L., Lavelle, M., Brennan, G., Stewart, D., James, K., Richardson, M., Williams, H., Price, O., & Bowers, L. (2016). Physical Injury and Workplace Assault in UK Mental Health trusts: an Analysis of Formal Reports. International Journal of Mental Health Nursing, 25, 355-366. https://doi.org/10.1111/inm.12201
36
Hospitals and Correlates with Hospital Characteristics. Social Psychiatry Epidemiology, 42, 140-145. https://doi.org/10.1007/s00127-006-0137-0
Steinert, T., & Whittington, R. (2013). A Bio-Psycho-Social Model of Violence Related to Mental Health Problems. International Journal of Law and Psychiatry, 36 (2), 168-175. https://doi.org/10.1016/j.ijlp.2013.01.009
Van de Sande, R., Noorthoorn, E., Wierdsma, A., Hellendoorn, E., van der Staak, C., Mulder, C.L., & Nijman, H. (2013). Association Between Short-term Structured Risk Assessment Outcomes and Seclusion. International Journal of Mental Health Nursing, 22, 475-484. https://doi.org/10.1111/inm.12033
Van de Sande, R., Mulder, N., & Nijman, H. (2013) Werken met de CrisisMonitor (2nd ed.). Den Haag: Parnassia Groep
Van de Sande, R., Noorthoorn, E., Nijman, H., Wierdsma, A., van de Staak, C., Hellendoorn, E., & Mulder, N. (2017). Associations Between Psychiatric Symptoms and Seclusion Use: Clinical Implications for Care Planning. International Journal of Mental Health Nursing, 26, 423-436. https://doi.org/10.1111/inm.12381