warwick.ac.uk/lib-publications
Original citation:
Pages, Benjamin J., Sakoff, Jennette, Gilbert, Jayne, Rodger, Alison, Chmel, Nikola P., Jones,
Nykola C., Kelly, Sharon M., Ang, Dale L. and Aldrich-Wright, Janice R.. (2016) Multifaceted
studies of the DNA interactions and in vitro cytotoxicity of anticancer polyaromatic
platinum(II) complexes. Chemistry - A European Journal, 22 (26). pp. 8943-8954.
Permanent WRAP URL:
http://wrap.warwick.ac.uk/80972
Copyright and reuse:
The Warwick Research Archive Portal (WRAP) makes this work by researchers of the
University of Warwick available open access under the following conditions. Copyright ©
and all moral rights to the version of the paper presented here belong to the individual
author(s) and/or other copyright owners. To the extent reasonable and practicable the
material made available in WRAP has been checked for eligibility before being made
available.
Copies of full items can be used for personal research or study, educational, or not-for profit
purposes without prior permission or charge. Provided that the authors, title and full
bibliographic details are credited, a hyperlink and/or URL is given for the original metadata
page and the content is not changed in any way.
Publisher’s statement:
"This is the peer reviewed version of the following article: Pages, Benjamin J., Sakoff,
Jennette, Gilbert, Jayne, Rodger, Alison, Chmel, Nikola P., Jones, Nykola C., Kelly, Sharon M.,
Ang, Dale L. and Aldrich-Wright, Janice R.. (2016) Multifaceted studies of the DNA
interactions and in vitro cytotoxicity of anticancer polyaromatic platinum(II) complexes.
Chemistry - A European Journal, 22 (26). pp. 8943-8954.which has been published in final
form at http://dx.doi.org/10.1002/chem.201601221 This article may be used for
non-commercial purposes in accordance with
Wiley Terms and Conditions for Self-Archiving
."
A note on versions:
The version presented here may differ from the published version or, version of record, if
you wish to cite this item you are advised to consult the publisher’s version. Please see the
‘permanent WRAP URL’ above for details on accessing the published version and note that
access may require a subscription.
cytotoxicity of anticancer polyaromatic platinum(II) complexes
Benjamin J. Pages,
[a]Jennette Sakoff,
[b]Jayne Gilbert,
[b]Alison Rodger,
[c]Nikola P. Chmel,
[c]Nykola C.
Jones,
[d]Sharon M. Kelly,
[e]Dale L. Ang,
[a]Janice R. Aldrich-Wright.*
[a]Abstract: This paper reports a detailed biophysical analysis of the DNA binding and cytotoxicity of six platinum complexes (PCs). They are of the type [Pt(PL)(SS-dach)]Cl2, where PL is a polyaromatic ligand and SS-dach is 1S,2S-diaminocyclohexane. The DNA binding of these complexes was investigated using six techniques including ultraviolet and fluorescence spectroscopy, linear dichroism, synchrotron radiation circular dichroism, isothermal titration calorimetry and mass spectrometry. This portfolio of techniques has not been extensively used to study the interactions of such complexes previously; each assay provided unique insight. The in vitro cytotoxicity of these compounds was studied in ten cell lines and compared to the effects of their R,R enantiomers; activity was very high in Du145 and SJ-G2 cells, with some sub-micromolar IC50 values. In terms of both DNA affinity and cytotoxicity, complexes of 5,6-dimethyl-1,10-phenanthroline and 2,2ʹ-bipyridine exhibited the greatest and least activity, respectively, suggesting that there is some correlation between DNA binding and cytotoxicity.
Introduction
A long-standing aspiration of medicinal inorganic chemists has been the development of chemotherapeutic agents that can effectively combat cancerous cells, yet overcome the resistance and toxicity that plague current clinically used platinum agents.[1]
Platinum complexes (PCs) with mechanisms of action quite different from current agents have been explored as alternatives, and have demonstrated in vitro cytotoxicity up to 100 times
greater than cisplatin in several cell lines.[2] In particular, our
group has focused on the development of PCs that consist of a polyaromatic ligand (PL) and a cyclic amine ancillary ligand (AL)
in the form [Pt(PL)(AL)]2+.[3] These complexes interact
non-covalently with DNA, often via intercalation, rather than by forming permanent adducts. They also induce cell death by a different mechanism than cisplatin,[2a, 4] and are potently
cytotoxic against a variety of cell lines, including some that are cisplatin-resistant.[5] Our previous studies have been
inconclusive as to whether there is a correlation between DNA affinity and cytotoxicity; however, these studies have often used only one or two spectroscopic techniques to study PC-DNA interactions.[6] Moreover, DNA binding affinity is known to vary
depending on the method of measurement and the conditions used, and so separately conducted studies can often provide inconsistent results.[7] In this study, we have utilised several
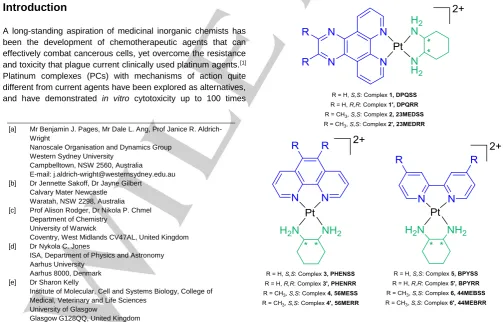
[image:2.595.44.548.412.734.2]biophysical assays to study the interactions of six PCs with DNA (Figure 1).
Figure 1. The structures of complexes 1–6 and 1ʹ–6ʹ; each AL is highlighted in green and each PL in blue. Chloride counter ions have been omitted for clarity. * indicates a stereocentre, either S or R.
[a] Mr Benjamin J. Pages, Mr Dale L. Ang, Prof Janice R. Aldrich-Wright
Nanoscale Organisation and Dynamics Group Western Sydney University
Campbelltown, NSW 2560, Australia E-mail: [email protected] [b] Dr Jennette Sakoff, Dr Jayne Gilbert
Calvary Mater Newcastle Waratah, NSW 2298, Australia [c] Prof Alison Rodger, Dr Nikola P. Chmel
Department of Chemistry University of Warwick
Coventry, West Midlands CV47AL, United Kingdom [d] Dr Nykola C. Jones
ISA, Department of Physics and Astronomy Aarhus University
Aarhus 8000, Denmark [e] Dr Sharon Kelly
Institute of Molecular, Cell and Systems Biology, College of Medical, Veterinary and Life Sciences
University of Glasgow
Glasgow G128QQ, United Kingdom
The experimental conditions were kept consistent, where possible, for each assay to facilitate comparison of the binding data elucidated from the individual techniques. This allowed for definitive trends in DNA binding affinity to be determined for the six PCs. The complexes studied here incorporated 1S,2S-diaminocyclohexane (SS-dach) as an AL and one of
dipyrido[3,2-d:2ʹ,3ʹ-f]quinoxaline (dpq), 2,3-dimethyl-dpq (23Me2dpq),
1,10-phenanthroline (phen), 5,6-dimethyl-phen (56Me2phen),
2,2ʹ-bipyridine (bpy) and 4,4ʹ-dimethyl-bpy (44Me2bpy) as an PL. The
use of a variety of PLs allowed for a comparison between the
DNA affinity and aromatic surface area of these complexes; it is known that structural variations can result in different DNA binding behaviour for metal complexes.[8] Methylated variants of
each PL were included due to the proven cytotoxic and DNA
binding influences of methyl substituents in our complexes,[3, 5b]
and SS-dach was chosen as the AL as complexes of this ligand
are the most active overall.[5b] The interactions of complexes 1–6
with calf-thymus DNA (CT-DNA) and some oligonucleotides were analysed using several methods. Firstly, linear dichroism (LD), ultraviolet spectroscopy (UV) and isothermal titration calorimetry (ITC) were utilised in tandem to gain an overall picture of DNA binding mode and affinity. Secondly, fluorescent intercalator displacement assays (FIDs) and synchrotron radiation circular dichroism (SRCD) experiments were undertaken to determine the effect of DNA affinity on the ability of each complex to displace competitive binders and stabilise the DNA strand, respectively. Thirdly, electrospray ionisation mass spectrometry (ESIMS) was used to determine if 1–6
preferentially bind to any base-pairs. Finally, the cytotoxicity of these compounds was determined in ten human cell lines. The activity of 1–6 was compared to their enantiomers 1ʹ–6ʹ and to the DNA binding results to determine any correlations between chemical structure, DNA affinity and cytotoxicity.
Results and Discussion
Linear dichroism
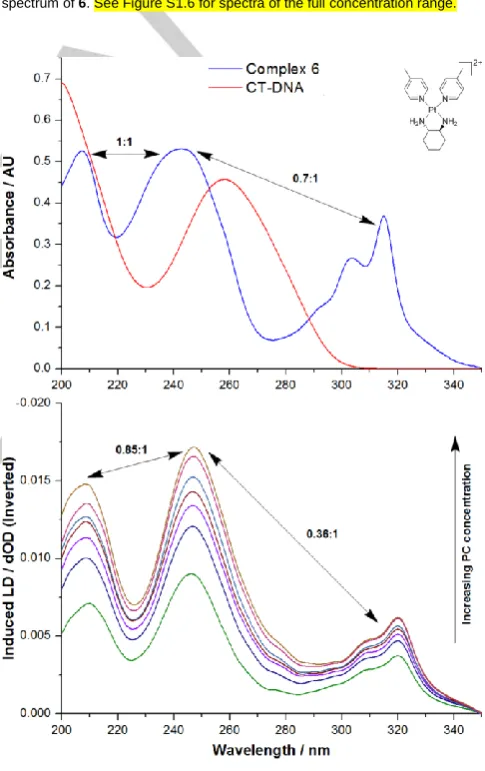
The LD spectrum of CT-DNA is characterised by a large negative band at ~260 nm. Upon the addition of each PC in this study, the band at 260 nm increased in intensity, which suggests a lengthening or stiffening of the DNA strand. Additionally, negative LD signals appeared at the absorbance wavelengths of each PC, which suggests that their aromatic components have aligned perpendicular to the DNA strand. The PC signals were flattened, broadened and red-shifted relative to their absorbance bands (Figure 2). These phenomena together indicate that each PC is binding via intercalation to DNA. While the alignment of complex 6 is obvious from the LD signal at 321 nm, this complex also absorbs at 243 and 206 nm; the same region as CT-DNA. The increase of the 260 nm LD peak upon addition of 6 could therefore be due to PC alignment only and not a result of DNA lengthening. To elucidate the cause of the signal change, the UV spectra of 6 and CT-DNA were compared to the induced LD signal of DNA+6 (Figure 3). In the induced LD spectrum, the peak at 247 nm has a higher relative intensity than the other
Figure 2. LD spectra of CT-DNA (150 μM) with increasing concentration of complex 6 (selected concentrations from 40 – 200 μM). Inset: The UV spectrum of 6. See Figure S1.6 for spectra of the full concentration range.
Figure 3. Top: The UV spectrum of CT-DNA (red line, 35μM) and complex 6
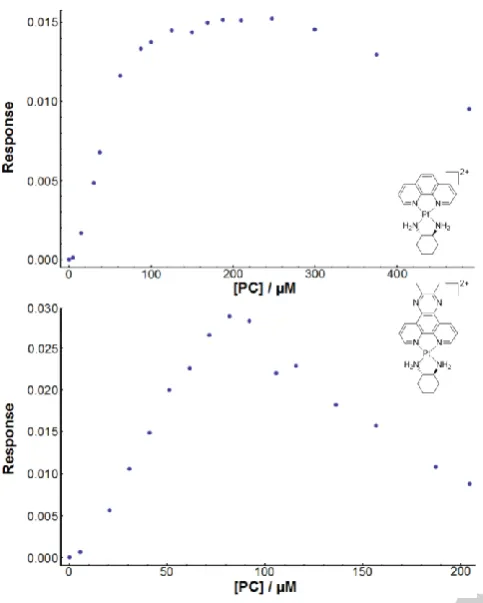
[image:3.595.304.550.84.230.2] [image:3.595.304.547.256.642.2]Figure 4. Plots of PC concentration against LD response of CT-DNA (150 μM) bound with increasing concentrations of complex 3 at 278 nm (4–488 μM, top) and 2 at 260 nm (5–205 μM, bottom).
two; this indicates that both the alignment of 6 and the lengthening of the DNA strand are both occurring, confirming that intercalation is the binding mode. Similar absorbance contributions were observed for each of complexes 1–5 as they all absorb in the same region as CT-DNA. For all PCs studied, there are two regions of the titration curve at which the signal in the CT-DNA region did not consistently increase with increasing PC concentration, despite the spectral evidence for DNA lengthening and/or stiffening. The first of these was a decrease or only very small increase of DNA signal intensity at 260 nm for PC concentrations between 5 and 30 μM. This may be indicative of a partial intercalation mode that hinges the DNA and bends it rather than full intercalation. The second point at which the LD signal did not increase was at high PC concentrations (85–100 μM); at this point a plateau was reached for complexes 1, 3, 5
and 6 before the signal began to decrease at ~250 μM (Figure 4). This suggests that the DNA reached saturation by intercalation before another binding mode occurred, which then caused the strand to lose its aspect ratio. An electrostatic groove binding mode of some kind is likely as the second one. The plateau allowed for a binding constant to be determined for the first or putative intercalative binding. For complexes 2 and 4, the signal loss began to occur before any plateau was reached (at approx. 80 and 100 μM, respectively), implying that the second binding mode occurred earlier for these complexes than for the others (Figure 4). This made binding constant calculation
impossible, and suggests that the difference in binding strength of the two modes is less for these complexes than it is for the others. KLD was determined for 1, 3, 5 and 6 using binding
curves from either one or two peaks in the induced spectrum; the average data is presented in Table 1 (see Table S1.2 for individual wavelength data). The points of the binding curve below 40 μM had to be removed in order to obtain a fit; this was due to the aforementioned DNA bending at these concentrations. The peak at ~320 nm for complexes 5 and 6 were not a result of DNA absorbance and so could be fitted with all points below 40 μM. Each complex was found to bind to DNA with high potency. The intercalative binding strength of these PCs is attributed to stabilised - stacking as well as the longer range charge-charge interactions of the platinum cations.[9] Complex 1 has the
largest aromatic surface area and a binding constant of ~106 M-1.
The other complexes had similar KLD values of 105 M-1. n
(number of base-pairs per PC) values were typically around 2–3, indicating that each PC could intercalate between every second or third base pair in a sequence. Despite the lack of some binding data for complexes 2 and 4, LD has provided useful information regarding the binding activity of the PCs in this study.
UV binding assays
UV spectroscopy is a common method used to determine binding mode and affinity of metal complex-DNA interactions.[10]
The addition of DNA to each of complexes 1-6 resulted in hypochromism, with a varying shift in wavelength between the PCs (Figure 5). The spectra of 3-6 were red-shifted with the effect being more subtle for 5 and 6, while the spectra of 1 and 2
experienced a blue-shift upon the addition of CT-DNA. Typically these shifting patterns can provide information regarding the DNA binding mode;[10a] however, each of 1-6 absorb in the same
region as DNA and so no definitive binding mode statements could be made from this data. Unlike the LD experiments, binding constant data was obtainable for all complexes in this instance, with no removal of binding curve points required (Figure 5). The possible secondary groove binding mode that limited the binding curves in LD had no effect here, and so the KUV values are likely reflective of an overall binding affinity rather
than just an intercalation-related one. Due to the differences in the UV spectra of each complex, different wavelengths were chosen for each KUV determination. Where applicable, up to
three wavelengths were chosen to facilitate a comparison between each value obtained; only minor differences were observed, and so the values in Table 1 are averages (see Table S2.2 for individual wavelength data). The KUV did not vary
considerably with aromatic surface area, with most binding constants close to 105 M-1. The only exception is complex 4,
which demonstrated higher DNA affinity with a KUV of ~106 M-1.
This suggests that the 56Me2phen ligand, despite possessing a
smaller aromatic surface than dpq or 23Me2dpq, is the optimum
DNA-binding PL. Despite the lack of binding mode information
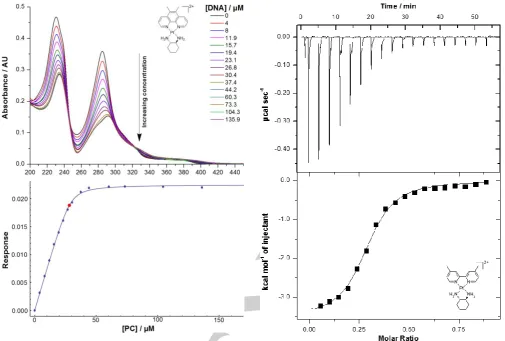
Figure 5. UV data for complex 4: spectra at various DNA concentrations (top), and fitted binding curve produced by the Mathematica script (bottom). The red dot indicates that the fit was successful.[11]
Isothermal titration calorimetry
ITC was employed here as it provides an overall picture of PC-DNA binding interaction from a calorimetric perspective.[12] The
titration of each of complexes 1–6 was exothermic in nature, with negative μcal sec-1 peaks present that represent DNA
binding events, followed by smaller peaks from the heat of dilution once the binding sites were exhausted (Figure 6). Many titrations resulted in the appearance of two peaks rather than one, or at least evidence of two merged peaks to give the appearance of one. This suggests that binding may be biphasic in nature; the second peak may result from the ejection of solvent or sodium from the DNA sites, or from a DNA conformational adjustment post-binding, or both. The calculated thermodynamic parameters for each of 1–6 were similar. The binding of each complex with CT-DNA was an exothermic event, with ΔH values ranging from -1000 to -6000 cal mol-1 and ΔS
values between 8 and 20 cal mol-1 deg-1 (Table 3). The positive
ΔS is likely due to the solvation entropy that results from the ejection of solvent molecules from the grooves of DNA during PC-DNA binding.[13] The calculated ΔG values ranged between
-7500 and -8500 cal mol-1. Complexes 3 and 5 exhibited the
lowest binding constants of ~2×10⁵ M-1,while the values for 1, 2
Figure 6. ITC trace and binding curve of the titration of complex 6 (650 μM) into CT-DNA (164 μM). Fits were obtained using a one-site binding model.
and 6 were ~ 3×10⁵ M-1. The only complex that appeared to bind
with a distinctly higher affinity was complex 4 with a KITC of (5.7 ±
0.5)×105 M-1. This again suggests that 56Me
2phen is of an
optimal size for DNA binding affinity. The number of PCs bound per base pair was between 0.25 and 0.3; converting that to n values reveals that approximately 3–4 binding sites are present per PC.
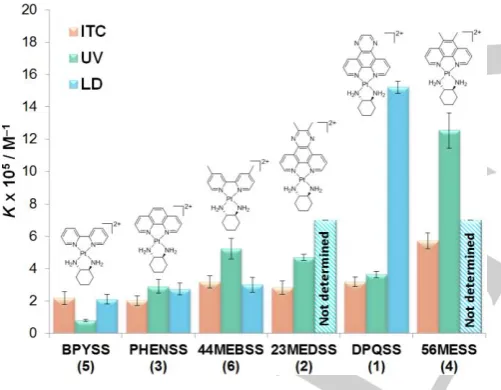
Binding constant data comparison
Table 1. Summary of binding constant data obtained from LD (150 μM CT-DNA + 40-200 μM PC), UV (15μM PC + 7-200 μM CT-DNA) and ITC (titration of 600-750 μM PC into 165 μM CT-DNA) experiments. Standard deviation values are included (1 sig. fig.).
LD Data UV Data ITC Data
No. 10-5KLD / M-1 n 10-5KUV / M-1 n 10-5K / M-1 n ΔH / kcal mol-1 TΔS / kcal mol-1 ΔG / kcal mol-1
1 15.2 ± 0.4 2.41 ± 0.06 3.6 ± 0.2 3.13 ± 0.09 3.2 ± 0.3 3.98 ± 0.06 -4.4 ± 0.1 3.4 ± 0.1 -7.8 ± 0.3
2[a]
- - 4.7 ± 0.1 2.52 ± 0.01 2.8 ± 0.4 3.51 ± 0.08 -4.5 ± 0.1 3.2 ± 0.3 -7.7 ± 0.8
3 2.8 ± 0.4 2.2 ± 0.2 2.9 ± 0.4 3.5 ± 0.3 2.0 ± 0.3 3.7 ± 0.1 -3.7 ± 0.1 3.9 ± 0.4 -7.5 ± 0.7
4[a]
- - 13 ± 1 2.32 ± 0.02 5.7 ± 0.5 3.00 ± 0.02 -5.6 ± 0.1 2.6 ± 0.2 -8.2 ± 0.6
5[b]
2.1 ± 0.3 3.1 ± 0.3 0.79 ± 0.06 4.4 ± 0.2 2.2 ± 0.4 3.4 ± 0.1 -1.3 ± 0.1 6.2 ± 0.2 -7.6 ± 0.4
6[b]
3.0 ± 0.5 2.1 ± 0.2 5.2 ± 0.6 2.87 ± 0.04 3.2 ± 0.4 3.57 ± 0.06 -3.6 ± 0.1 4.2 ± 0.1 -7.8 ± 0.2 [a] LD values could not be determined due to a decrease in LD signal at high concentrations
[image:6.595.37.556.130.279.2][b] LD values also reflect data in which binding data points below 40 μM could be fitted
Figure 7. Comparison of the binding constants of complexes 1-6 with CT-DNA, as determined by ITC (red), UV (green) and LD (blue). Where applicable, K
values over multiple wavelengths have been averaged for LD and UV data.
UV and ITC provided data that was representative of the overall interaction from a spectroscopic and calorimetric perspective, respectively. Therefore it is not surprising that there were some differences in the calculated binding data across each technique (Table 1). More importantly, trends in DNA affinity for complexes
1-6 are generally the same across all studies: 4 > 2 = 1 ≥ 6 = 3 ≥
5 (Figure 7). It is clear that these techniques are complementary and can each provide important information regarding PC-DNA binding.
Fluorescent intercalator displacement (FID) assays
The ability to displace competing ligands from a target is a crucial factor in the efficacy of a drug. To study the ability of complexes 1-6 to competitively displace other binders from CT-DNA, fluorescent intercalator displacement assays (FIDs) were utilised. Ethidium bromide (EtBr) was used here as it is fluorescent only when bound with DNA.[14] The peak of emission
for DNA-bound EtBr is at ~601 nm; upon the addition of each PC, the emission intensity decreased, indicating that some EtBr had been displaced from the DNA strand (Figure 8). EtBr is postulated to occupy several binding sites of DNA with an
[image:6.595.46.297.354.549.2] [image:6.595.305.547.484.675.2]overall KF of ~105 M.[15] Therefore, the determination of an
accurate displacement binding constant is a difficult task as there are several possible sites occupied by EtBr that can be displaced by groove binders and intercalators alike. The binding curves obtained in this study did not reach a plateau, even at [DNA]: [PC] ratios as low as 0.15; this indicates that some ethidium molecules could not be displaced from particular binding sites. The curves could subsequently not be fitted using the same processing method as the LD and UV data, and so a simplified processing method of a previous study of ours was used (see Experimental for details).[6b] The results are
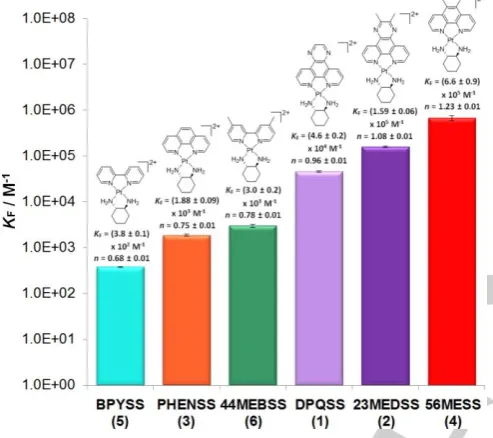
[image:7.595.46.293.239.458.2]summarised in Figure 9 and Table 2.
Figure 9. Comparison of the KF and n determined for each PC, expressed on a logarithmic scale. Standard deviations (first significant figure) are included.
Table 2. Fluorescence constants calculated for complexes 1–6, expressed with standard deviation (1 sig. fig.). No. 10-5 Kq / M–1 s–1 10-5KF / M-1 n
1 2.81 ± 0.03 0.46 ± 0.02 0.96 ± 0.01
2 3.41 ± 0.02 1.59 ± 0.06 1.08 ± 0.01
3 0.539 ± 0.009 0.019 ± 0.001 0.75 ± 0.01
4 3.7 ± 0.1 6.6 ± 0.9 1.23 ± 0.01
5 0.174 ± 0.004 0.0038 ± 0.0001 0.68 ± 0.01
6 0.67 ± 0.01 0.030 ± 0.002 0.78 ± 0.01
Each of the PCs studied was capable of displacing EtBr from the CT-DNA strand, with KF values between 102 and 107 M-1. The
simplified processing method means that KF is only an indication
of the ability of the complex to displace ethidium, and is not
quantitatively representative of the binding affinity. Similarly, the calculated n values are representative of the amount of EtBr each complex can replace, rather than the number of DNA binding sites, and so it is logical that n values increased with increasing KF. Each PC demonstrated Kqvalues above ~2 × 10¹⁰
M-1 s-1, indicating that EtBr displacement occurred prior to the
measurement of emission.[16] The trends between complexes
1-6 were still relatively consistent with the other data collected in this study; 4 and 5 demonstrated the highest and lowest affinity for CT-DNA, respectively. Greater differences were distinguishable between the rest of the complexes, suggesting that even the smallest differences in DNA affinity can result in large differences in competitive displacement ability that may be physiologically relevant.
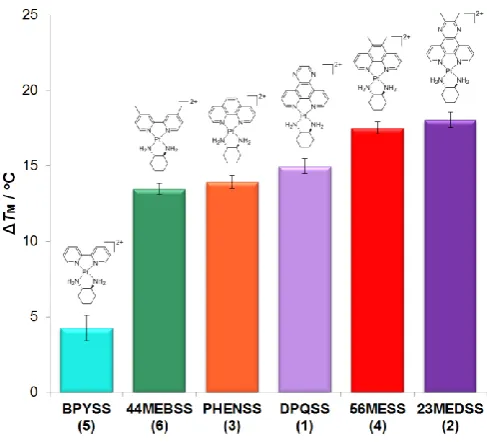
Synchrotron radiation circular dichroism
SRCD has been used here to determine the effect of the binding of complexes 1-6 on the stability of CT-DNA. This was achieved through the determination of TM, the temperature inflexion point
at which the CD signal is lost due to a loss of secondary structure.[17] The addition of each PC to CT-DNA resulted in
dramatic changes in the SRCD spectrum, presumably due to conformational changes that occurred upon binding. The wavelength maxima and minima chosen for melting analysis differed for each of 1–6 as each complex influenced the CT-DNA spectrum in different ways. For each DNA-PC combination, CD signal decreased with increasing temperature (Figure 10), with melting occurring at different points for each PC. For each melting curve, the TM did not vary significantly between the
wavelengths chosen. The binding of all complexes to DNA resulted in a higher TM than the average DNA value of 55 ± 1 oC
(Figure 11). An increase in TM is expected for intercalative
binders. It is important to note that the binding curves for
[image:7.595.303.548.488.687.2]Figure 11. Comparison of the SRCD ΔTM determined for CT-DNA bound with complexes 1–6. Standard deviations (error bars) are included.
complexes 2 and 4 (Section S5) barely reached completion as the hardware could not raise the temperature above ~79 oC;
however, ΔTM values were consistent between replicates. The
trends in TM for each complex were almost the same as the
trends of the fluorescence study; the order of DNA stabilisation was 2 ≅ 4 > 1 > 3 ≅ 6 > 5. Similarly to the FID assays, it appears that even minor differences in the DNA affinity of these PCs has led to large differences in their ability to stabilise helical DNA against melting.
Mass Spectrometry Binding Studies
Mass spectrometry is often used to probe ligand-biomolecule interactions at different stoichiometry.[18] The mass spectra of
each of the double complementary strands GCGCATGCGCATGCGC-3ʹ (“GC Strand” or GCS) and 5ʹ-GCATATGATATCATATGC-3ʹ (“AT Strand” or ATS) are characterised by several main peaks representing different charge states of the strand (Section S6). When binding to each strand individually, complexes 1-6 were found to bind to up to one in every two base-pairs. For example, for the solutions of 9:1 PC to ATS strand ratio, the mass spectra for complex 2
produced peaks corresponding to as high as [ATS+9PC], while those for 5 only produced peaks for up to [ATS+7PC]. Spectra and relative abundance information can be found in Section S6.2. To determine if there was any base-pair preference, a competitive assay was carried out in which each PC was added to a 1:1 solution of the GCS and ATS strands. All of complexes
1–6 demonstrated the same behaviour in these experiments and so the spectra of complex 2 will be used as an example (Figure 12). Immediate observation of the mass spectra of 1:1 GCS to ATS with one and three equivalents of complex 2 suggests that there is GC selectivity; in the 1:1:1 spectrum the peaks
Figure 12.
Mass spectra of a solution of complex
2, GCS (red symbols) and ATS (blue symbols) in the following ratios: 0:1:1 (bottom), 1:1:1 (middle) and 3:1:1 (top) (1 equivalent is 42 μM). Legend: square = [DNA], triangle = [DNA+1PC], circle = [DNA+2PC], star = [DNA+3PC], diamond = [DNA+4PC].corresponding to unbound GCS have dropped relative to the 0:1:1 spectrum while the ATS peaks are still at large. Supporting this, the peaks at 1482 and 1741 m/z in this spectrum correspond to [GCS+1PC]. There is evidence for [ATS+1PC] at ~1670 m/z, however this signal is also representative of unbound GCS and so the actual intensity would be quite low. The 3:1:1 spectrum further displays the GC selectivity of complex 2 as the ~1400 m/z peak representing unbound GCS at a charge of 7- has almost disappeared, while there is still some evidence of free ATS in the peaks at ~1660 and ~1800 m/z. Peaks corresponding to [ATS+1PC] (1666 and 1953 m/z) and [ATS+2PC] (1730 and 2050 m/z) are visible, however there are also peaks representative of [GCS+3PC] (1400 and 1870 m/z) and [GCS+4PC] (1950 m/z). GC selectivity is common for DNA intercalators,[19] and these experiments were conducted within
DNA:PC ratios in which only intercalation is occurring (in accordance with the LD experimental data). Abundances were not determined here as there are too many overlapping peaks; however it is clear that the PCs in this study selectively bind to GC base-pairs over AT ones.
In vitro cytotoxicity
As a continuation of the cytotoxicity assays performed in previous work with complexes 1–6 and 1ʹ-6ʹ in the L1210 murine leukaemia, HT29 human colon carcinoma and U87 human glioblastoma cell lines,[5b] the activity of these complexes was
assessed in a further ten cell lines: MCF-7 breast cancer, A2780 ovarian cancer, H460 lung cancer, A431 skin cancer, Du145 prostate cancer, BE2-C neuroblastoma, SJ-G2 human glioblastoma, MIA pancreas cancer, SMA murine glioblastoma and MCF10A breast (normal) (Table 3). These experiments were conducted to gain a greater understanding of the activity of
[image:8.595.304.551.83.236.2]Figure 13. Comparison of the cytotoxicity of complexes 1–6 and 1ʹ–6ʹ in the SJ-G2 human glioblastoma (blue), HT29 colon carcinoma (red) and Du145 prostate cancer (green) cell lines, expressed as nanomolar IC50 values with standard error. Carboplatin and BPYRR (5') values have been omitted for clarity.
with complexes 3-6 demonstrating very high cytotoxicity in the Du145 prostate cancer (some values previously published[20]),
SJ-G2 glioblastoma, and the previously published HT29 colon carcinoma[5b] lines (Figure 13). These cancer types are therefore
good targets for further therapeutic studies. The lowest point of activity was in the BE2-C neuroblastoma line, with only complexes 3 and 4 reaching sub-micromolar IC50 concentrations.
Also of note is the higher cytotoxicity of all PCs in the “normal” MCF10A breast cell line relative to the MCF-7 breast cancer line. This emphasises the importance of targeted delivery of these complexes to cancerous cells. Across the majority of cell lines, the same structure-activity trends are observed as previous studies: for PLs, 56Me2phen > phen ≥ 44Me2bpy > dpq > bpy ≅
23Me2dpq, and for ALs, SS-dach > RR-dach. The fact that these
trends were generally the same across all cell lines suggests that the in vitro mechanism of action of these PCs is largely independent of the cancer type, with minor differences between the mechanisms of individual complexes. A correlation between DNA affinity and cytotoxicity was observed for complexes 3–6; 4
and 5 were the most and least effective in both areas, respectively, while 3 and 6 were approximately equal in both DNA affinity and cytotoxicity. Interestingly, complexes 1 and 2
exhibited mid-low biological activity despite their relatively high DNA affinity. Additionally there were large differences in activity between R,R and S,S isomers, despite their similar DNA binding affinity as determined in our previous DNA study.[6b] This
reinforces the notion that the apoptotic mechanisms of these complexes involve much more than DNA binding alone.[4, 21]
Further studies of the in vitro interactions of these complexes are warranted.
Conclusions
The DNA binding of six anticancer PCs DPQSS, 23MEDSS, PHENSS, 56MESS, BPYSS and 44MEBSS has been studied in depth through the use of several biophysical techniques. Overall, each technique contributed unique information regarding binding behaviour; LD, UV and ITC provided PC-DNA binding constant values, as well as binding mode and thermodynamic parameters. From this data it is clear that complexes 1–6 are capable of binding to DNA with an affinity of ~105–106 M-1, with intercalation
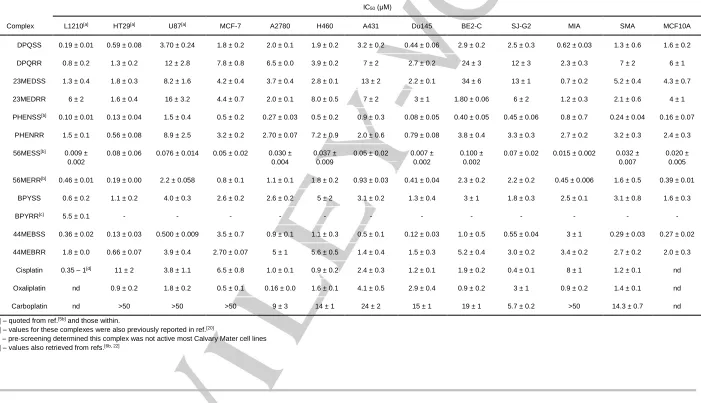
Table 3.Summary of the in vitro cytotoxicity of complexes 1–6 and 1ʹ–6ʹ in several cell lines, expressed as an IC50 value with standard error (1 sig. fig.). IC50 is the concentration at which cell growth is inhibited by 50% over 72 h. IC50 (μM)
Complex L1210[a] HT29[a] U87[a] MCF-7 A2780 H460 A431 Du145 BE2-C SJ-G2 MIA SMA MCF10A
1 DPQSS 0.19 ± 0.01 0.59 ± 0.08 3.70 ± 0.24 1.8 ± 0.2 2.0 ± 0.1 1.9 ± 0.2 3.2 ± 0.2 0.44 ± 0.06 2.9 ± 0.2 2.5 ± 0.3 0.62 ± 0.03 1.3 ± 0.6 1.6 ± 0.2
1ʹ DPQRR 0.8 ± 0.2 1.3 ± 0.2 12 ± 2.8 7.8 ± 0.8 6.5 ± 0.0 3.9 ± 0.2 7 ± 2 2.7 ± 0.2 24 ± 3 12 ± 3 2.3 ± 0.3 7 ± 2 6 ± 1
2 23MEDSS 1.3 ± 0.4 1.8 ± 0.3 8.2 ± 1.6 4.2 ± 0.4 3.7 ± 0.4 2.8 ± 0.1 13 ± 2 2.2 ± 0.1 34 ± 6 13 ± 1 0.7 ± 0.2 5.2 ± 0.4 4.3 ± 0.7
2ʹ 23MEDRR 6 ± 2 1.6 ± 0.4 16 ± 3.2 4.4 ± 0.7 2.0 ± 0.1 8.0 ± 0.5 7 ± 2 3 ± 1 1.80 ± 0.06 6 ± 2 1.2 ± 0.3 2.1 ± 0.6 4 ± 1
3 PHENSS[b] 0.10 ± 0.01 0.13 ± 0.04 1.5 ± 0.4 0.5 ± 0.2 0.27 ± 0.03 0.5 ± 0.2 0.9 ± 0.3 0.08 ± 0.05 0.40 ± 0.05 0.45 ± 0.06 0.8 ± 0.7 0.24 ± 0.04 0.16 ± 0.07
3ʹ PHENRR 1.5 ± 0.1 0.56 ± 0.08 8.9 ± 2.5 3.2 ± 0.2 2.70 ± 0.07 7.2 ± 0.9 2.0 ± 0.6 0.79 ± 0.08 3.8 ± 0.4 3.3 ± 0.3 2.7 ± 0.2 3.2 ± 0.3 2.4 ± 0.3
4 56MESS[b] 0.009 ± 0.002
0.08 ± 0.06 0.076 ± 0.014 0.05 ± 0.02 0.030 ± 0.004
0.037 ± 0.009
0.05 ± 0.02 0.007 ± 0.002
0.100 ± 0.002
0.07 ± 0.02 0.015 ± 0.002 0.032 ± 0.007
0.020 ± 0.005
4ʹ 56MERR[b] 0.46 ± 0.01 0.19 ± 0.00 2.2 ± 0.058 0.8 ± 0.1 1.1 ± 0.1 1.8 ± 0.2 0.93 ± 0.03 0.41 ± 0.04 2.3 ± 0.2 2.2 ± 0.2 0.45 ± 0.006 1.6 ± 0.5 0.39 ± 0.01
5 BPYSS 0.6 ± 0.2 1.1 ± 0.2 4.0 ± 0.3 2.6 ± 0.2 2.6 ± 0.2 5 ± 2 3.1 ± 0.2 1.3 ± 0.4 3 ± 1 1.8 ± 0.3 2.5 ± 0.1 3.1 ± 0.8 1.6 ± 0.3
5ʹ BPYRR[c] 5.5 ± 0.1 - - - - - - - - - - - -
6 44MEBSS 0.36 ± 0.02 0.13 ± 0.03 0.500 ± 0.009 3.5 ± 0.7 0.9 ± 0.1 1.1 ± 0.3 0.5 ± 0.1 0.12 ± 0.03 1.0 ± 0.5 0.55 ± 0.04 3 ± 1 0.29 ± 0.03 0.27 ± 0.02
6ʹ 44MEBRR 1.8 ± 0.0 0.66 ± 0.07 3.9 ± 0.4 2.70 ± 0.07 5 ± 1 5.6 ± 0.5 1.4 ± 0.4 1.5 ± 0.3 5.2 ± 0.4 3.0 ± 0.2 3.4 ± 0.2 2.7 ± 0.2 2.0 ± 0.3 Cisplatin 0.35 – 1[d] 11 ± 2 3.8 ± 1.1 6.5 ± 0.8 1.0 ± 0.1 0.9 ± 0.2 2.4 ± 0.3 1.2 ± 0.1 1.9 ± 0.2 0.4 ± 0.1 8 ± 1 1.2 ± 0.1 nd Oxaliplatin nd 0.9 ± 0.2 1.8 ± 0.2 0.5 ± 0.1 0.16 ± 0.0 1.6 ± 0.1 4.1 ± 0.5 2.9 ± 0.4 0.9 ± 0.2 3 ± 1 0.9 ± 0.2 1.4 ± 0.1 nd
Carboplatin nd >50 >50 >50 9 ± 3 14 ± 1 24 ± 2 15 ± 1 19 ± 1 5.7 ± 0.2 >50 14.3 ± 0.7 nd
[a] – quoted from ref.[5b]
and those within.
[b] – values for these complexes were also previously reported in ref.[20]
activity across a large range of human cancer cell lines with particularly high efficacy in Du145 prostate cancer and SJ-G2 glioblastoma cells. PCs of dpq and 23Me2dpq, despite
demonstrating relatively high DNA affinity, were among the least active biologically. For complexes of bpy, 44Me2bpy, phen and
56Me2phen, DNA affinity does appear to correlate with
cytotoxicity, suggesting that DNA binding plays a role in the apoptotic activity of these complexes. However, the large difference in activity between enantiomers suggests that further studies of other, non-DNA interactions are needed to determine the overall mechanism of action.
Experimental Section
Materials and Preparation
All reagents were used as received and all solvents used were of analytical grade or higher. Complexes 1–6 and 1ʹ–6ʹ were prepared as per previous publications.[5b, 6b, 22] Dipotassium hydrogen orthophosphate, potassium dihydrogen orthophosphate, ammonium acetate, sodium fluoride, sodium chloride, D-10-camphorsulfonic acid, calf-thymus DNA and ethidium bromide (EtBr) were obtained from Sigma-Aldrich chemicals. Pora-Pak™ Rxn CX cartridges (20cc, 2g) were obtained from
Waters. The HPLC-purified DNA oligonucleotides
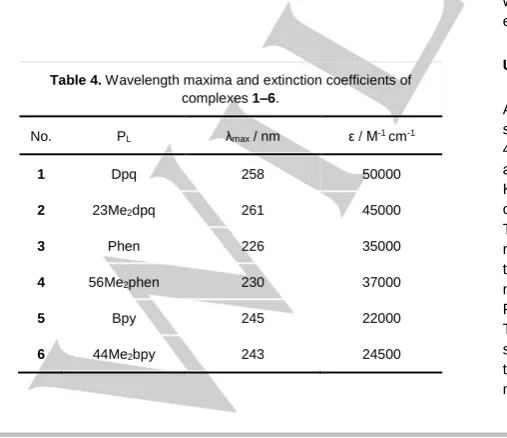
[image:11.595.308.519.323.367.2]GCGCATGCGCATGCGC-3ʹ (“GC Strand” or GCS) and 5ʹ-GCATATGATATCATATGC-3ʹ (“AT Strand or ATS”) were obtained from Integrated DNA Technologies (IDT). Further purification and ion exchange of each strand was achieved by dissolution in 150 mM ammonium acetate and elution through a Pora-Pak™ Rxn CX cartridge (20cc, 2g) followed by lyophilisation. Annealing was achieved by heating solutions of each oligo in 150 mM ammonium acetate to 95 oC in a water bath for 3 min before leaving the water bath to cool overnight. Oligo concentrations were determined through UV absorbance, using the IDT-provided extinction coefficients of 254000 and 283000 M-1cm-1per double strand at 260 nm for GCS and ATS, respectively. CT-DNA concentration was confirmed using the 260 nm extinction coefficient of 13200 M-1cm-1 per base pair.[23] Ethidium bromide concentration was determined using the extinction coefficient of ε476 = 5680 M-1cm-1,[24] and PC concentrations were determined using their respective extinction coefficients (Table 4).[5b, 6b, 25]
Table 4. Wavelength maxima and extinction coefficients of complexes 1–6.
No. PL λmax / nm ε / M-1 cm-1
1 Dpq 258 50000
2 23Me2dpq 261 45000
3 Phen 226 35000
4 56Me2phen 230 37000
5 Bpy 245 22000
6 44Me2bpy 243 24500
Linear dichroism
LD spectra were obtained using a Jasco 810 spectropolarimeter using a quartz capillary LD Couette flow cell built by Crystal Precision Optics. Experiments at temperatures close to physiological resulted in DNA shearing, and so experiments were performed at 20 oC rather than 37 oC. The instrument was allowed to equilibrate for 30 min prior to use, and nitrogen gas flow was kept at ~10 L min-1. A series of ~17 solutions consisting of CT-DNA (150 μM), K2HPO4/KH2PO4 (10 mM, pH 7.3), NaCl (10 mM) and various amounts of each PC were prepared according to Table S1.1. NaCl concentration was relatively low due to the strong absorption of chloride salts at low wavelengths.[26] For each solution, spectra were obtained over the range of 200–350 nm using a scan rate of 200 nm min-1, data pitch of 1 nm, response time of 1 s and rotation speed of 3000 rpm. Two accumulations were collected and a baseline non-rotating spectrum was subtracted from each data set. The change of the DNA signal in proportion to the PC concentration was used to elucidate PC-DNA binding information, and to determine the binding constant for LD (KLD). To determine the binding constants, the induced response of the LD signal was plotted against PC concentration, and fitted to the following equation using the published Wolfram Mathematica script,[11] which utilises the binding model of Ismail and Stootman et al:[11, 27]
where LT is the total PC concentration, BT is the total number of DNA bases, KLD is the binding constant and n is the number of base-pairs per PC. RB is the response of the instrument as a result of the binding of PC to DNA (whose concentration is denoted LB) and ε is an experimental measurement that relates to LB via:
KLDwas calculated for each wavelength peak in the induced spectrum of complexes 1, 3, 5 and 6. For all signals below 300 nm, the points of the binding curve corresponding to PC concentrations below 40 μM had to be removed in order to fit the data. The peak at ~320 nm for complexes 5 and 6 were not a result of DNA absorbance and so they could be fitted with all points below 40 μM. Experiments were performed in triplicate for each PC.
UV spectroscopy
[image:11.595.53.307.518.737.2]and so the script may not always be able to find a fit. Experiments were performed in triplicate for each PC.
Isothermal titration calorimetry assays
ITC traces were obtained using a MicroCal iTC 200 calorimeter operating at 37 oC. Each PC (600–750 μM) was titrated into a solution of CT-DNA (165 μM) in K2HPO4/KH2PO4 (10 mM, pH 7.3) and NaCl (50 mM) buffer. Each PC was also titrated into buffer without DNA for use as a baseline. The titration program consisted of one 0.4 μL addition followed by 18 titrations of 2 μL, with a spacing of 180 s, reference power of 6 μcal s-1 and stirring speed of 750 rpm. Data was analysed using Origin 7.0 (MicroCal version) using 200 iterations of a one-site binding model using the following equations. Experiments were performed in duplicate for each PC.
Fluorescent intercalator displacement assays
Emission spectra for the FIDs were collected using a Jasco FP-2500 fluorimeter operating at 37 oC. The wavelength range chosen was 550– 750 nm with an excitation wavelength of 480 nm, scan rate of 600 nm min-1, data interval of 1 nm and averaging time of 0.1 s. The emission and excitation slits were each set to 5 nm. A solution of EtBr (75 μM) and CT-DNA (150 μM) in K2HPO4/KH2PO4 (10 mM, pH 7.3) and NaCl (50 mM) buffer was initially measured, followed by the titration of PC (various concentrations) according to Tables S4.1 and S4.2. After each titration the solution was gently mixed and incubated for 3 min before measurement. The attenuation of signal at 601 nm from each successive titration was used to calculate the binding constant for fluorescence (KF). To determine the quenching mode, the Stern-Volmer equation was used: [28]
where F0 is the fluorescence of the binding site in the absence of quencher, F is the fluorescence of the site containing the PC, Kq is the bimolecular quenching constant, τ0 is the lifetime of the chromophore in the absence of the quencher (~22 × 10-9 s for ethidium-bound DNA),[29] and KSV is the Stern-Volmer quenching constant. A plot of F0/F against [PC] using experimental values allows for the determination of Kq and KSV from the slope. To determine KF, the double-logarithm expression derived in our previous work was used to determine a binding constant for the PC-DNA interaction:[6b]
where n is the number of ethidium compounds displaced per PC. It is important to note that this expression is a simplification of the true binding interaction as the effect of EtBr on the binding equilibrium is ignored;[30] however, the results obtained are still comparable between complexes of the same study.[6b] A plot of log10[(F0 – F)/F)] against
log10[PC] is used to determine KF and n from the intercept and slope, respectively. Experiments were performed in triplicate for each PC.
Synchrotron radiation circular dichroism
Experiments were performed at the AU-CD beamline on ASTRID2[31] at ISA, Aarhus University. ASTRID2 operates in top-up mode with a current of 120 mA. The AU-CD beam line operates in the wavelength range of 125 to 450 nm, with a bandwidth of 0.6 nm. The beam size on the sample is 2 (vert.) × 6 (horz.) mm, with, a sample to detector distance of 25 mm. All SRCD experiments were performed using a suprasil quartz cuvette with a 0.01 cm path length. Temperature control was achieved through the use of a Eurotherm temperature regulator. Calibration of the spectropolarimeter was assessed through daily measurement of the CD spectrum of D-10-camphorsulfonic acid. Each melting solution consisted of a PC (0.5 mM) and CT-DNA (1 mM) in K2HPO4/KH2PO4 (10 mM, pH 7.3) and NaF (50 mM) buffer. NaF was used due to the strong absorption of chloride salts at low wavelengths.[26] Solutions of CT-DNA with no PC present were also measured. Temperature scans were performed as follows: the cell temperature began at 25 oC, was raised to 45 oC in 10 oC increments and then raised from 45–90 oC in 5 oC increments. The heating rate was 1 oC.min-1. For each temperature increment, the cell was allowed to equibrilate for 5 min before a spectrum was recorded; these were collected from 350–170 nm with a 1 nm increment and three accumulations. Prior to each melting experiment, a baseline spectrum of the PC in phosphate buffer was obtained to partially eliminate the effects of PC chirality from the SRCD spectra. Experiments were performed in duplicate for each PC. For each wavelength, SRCD intensity was plotted against temperature, and a Boltzmann curve was fitted to the plot using Origin Pro 8.5 (Origin Labs) to determine the TM. The CT-DNA concentration used here was much higher than that for other biophysical assays due to the lower path length of the cell used. To prevent the chirality of the PCs from affecting the CD spectrum of DNA, the PCs were included in the baseline solutions and the DNA:PC ratio was consistently kept at 2:1 and no higher.
Electrospray Ionisation Mass Spectrometry
DNA-PC solutions were analysed via negative-mode ESIMS using a Waters XEVO QToF ESI mass spectrometer with a Z-spray ionisation source. Mass spectra were obtained with a MCP potential of 2400 V, a cone voltage of 25 V and a capillary tip potential of 2.4 kV. The desolvation gas flow was 300 L/h at a desolvation temperature of 150 oC with the source temperature at 70 oC. The collision energy was set to off. Spectra were obtained over a mass/charge (m/z) range of 50–4000. A Hamilton 250 µL model 1725RN gastight syringe was loaded with 25 µL of solution and infused into the mass spectrometer source using a KD Scientific model 100 syringe pump set to 5 µL min-1,achieving 5 minutes of data acquisition. Between each run the syringe was cleaned thoroughly and the mass spectrometer was flushed with MilliQ-purified water.
In-vitro cytotoxicity
Australia) supplemented with 10% foetal bovine serum, 10 mM sodium bicarbonate penicillin (100 IU mL-1), streptomycin (100 µg mL-1), and glutamine (4 mM). Cytotoxicity was determined by plating cells in duplicate in 100 mL medium at a density of 2,500–4,000 cells per well in 96 well plates. On day 0, (24 h after plating) when the cells were in logarithmic growth, 100 L medium with or without the test agent was added to each well. After 72 h drug exposure growth inhibitory effects were evaluated using the MTT (3-[4,5-dimethyltiazol-2-yl]-2,5-diphenyl-tetrazolium bromide) assay and absorbance read at 540 nm. An eight point dose response curve was produced from which the IC50 value was calculated, representing the drug concentration at which cell growth was inhibited by 50% based on the difference between the optical density values on day 0 and those at the end of drug exposure.[32]
Acknowledgements
The authors thank ISA, Aarhus University for synchrotron beam time and Australian Synchrotron for providing International Synchrotron Access project travel funds. We also thank Western Sydney University for its financial support through internal research grants. B.J.P. and D.L.A. were supported by an Australian Postgraduate Award and Western Sydney University Top-Up Award. B.J.P. was also supported by an Endeavour Fellowship.
Keywords: DNA • anticancer • spectroscopy • biophysical • platinum [1] a) B. H. Harper, F. Li, R. Beard, K. B. Garbutcheon-Singh, N. S. Ng, J. R.
Aldrich-Wright in Biomolecular Interactions of Platinum Complexes, (Ed. H. J. Schneider), Royal Society of Chemistry, Cambridge, UK,
2013.; b) A. Callejo, L. Sedó-Cabezón, I. D. Juan, J. Llorens, Toxics 2015, 3, 268-293.
[2] a) A. M. Krause-Heuer, R. Grünert, S. Kühne, M. Buczkowska, N. J. Wheate, D. D. Le Pevelen, L. R. Boag, D. M. Fisher, J. Kasparkova, J. Malina, P. J. Bednarski, V. Brabec, J. R. Aldrich-Wright, J. Med. Chem. 2009, 52, 5474-5484.; b) L. A. Graham, J. Suryadi, T. K. West, G. L. Kucera, U. Bierbach, J. Med. Chem. 2012, 55, 7817-7827.
[3] C. R. Brodie, J. G. Collins, J. R. Aldrich-Wright, Dalton Trans. 2004, 1145-1152.
[4] K. B. Garbutcheon-Singh, S. Myers, B. W. J. Harper, N. S. Ng, Q. Dong, C. Xie, J. R. Aldrich-Wright, Metallomics 2013, 5, 1061-1067.
[5] a) K. B. Garbutcheon-Singh, B. W. J. Harper, S. Myers, J. R. Aldrich-Wright,
Metallomics 2014, 6, 126-131.; b) B. J. Pages, Y. Zhang, F. Li, J. Sakoff, J. Gilbert, J. R. Aldrich-Wright, Eur. J. Inorg. Chem. 2015, 2015, 4167-4175.
[6] a) S. Kemp, N. J. Wheate, D. P. Buck, M. Nikac, J. G. Collins, J. R. Aldrich-Wright, J. Inorg. Biochem. 2007, 101, 1049-1058.; b) B. J. Pages, F. Li, P. Wormell, D. L. Ang, J. K. Clegg, C. J. Kepert, L. K. Spare, S. Danchaiwijit, J. R. Aldrich-Wright, Dalton Trans. 2014, 43, 15566-15575. [7] a) D. Z. M. Coggan, I. S. Haworth, P. J. Bates, A. Robinson, A. Rodger,
Inorg. Chem. 1999, 38, 4486-4497.; b) S. M. Kelly, T. J. Jess, N. C. Price, Biochim. Biophys. Acta, Proteins Proteomics 2005, 1751, 119-139.; c) N. Shahabadi, L. Heidari, Spectrochim. Acta A. 2014, 128, 377-385.
[8] B. J. Pages, D. L. Ang, E. P. Wright, J. R. Aldrich-Wright, Dalton Trans. 2015, 44, 3505-3526.
[9] B. Norden, A. Rodger, T. Dafforn, Linear dichroism and circular dichroism – A textbook on polarised-light spectroscopy, The Royal Society of Chemistry, London, 2010, p. 304.
[10] a) T. Biver, Appl. Spectrosc. Rev. 2012, 47, 272-325.; b) M. R. Gill, D. Cecchin, M. G. Walker, R. S. Mulla, G. Battaglia, C. Smythe, J. A. Thomas, Chem. Sci. 2013, 4, 4512-4519.
[11] D. L. Ang, N. C. Jones, F. Stootman, B. Ghadirian, J. R. Aldrich-Wright,
Analyst 2015, 140, 4162-4169.
[12] N. C. Garbett, J. B. Chaires, Expert Opin. Drug Discovery 2012, 7, 299-314.
[13] J. A. D'Aquino, E. Freire, L. M. Amzel, Proteins 2000, Suppl. 4, 93-107. [14] R. W. Sabnis, Handbook of Biological Dyes and Stains: Synthesis and
Industrial Applications, John Wiley & Sons, New Jersey, 2010, p. 544. [15] a) J. B. Lepecq, C. Paoletti, J. Mol. Biol. 1967, 27, 87-106.; b) R. R.
Monaco, J. Biomol. Struct. Dyn. 2007, 25, 119-125. [16] W. R. Ware, J. Phys. Chem. 1962, 66, 455-458.
[17] D. L. Ang, B. W. J. Harper, L. Cubo, O. Mendoza, R. Vilar, J. Aldrich-Wright, Chem. Eur. J. 2015, 2317-2325.
[18] a) S. M. Meier, M. Hanif, Z. Adhireksan, V. Pichler, M. Novak, E. Jirkovsky, M. A. Jakupec, V. B. Arion, C. A. Davey, B. K. Keppler, C. G. Hartinger,
Chem. Sci. 2013, 4, 1837-1846.; b) K. J. Davis, C. Richardson, J. L. Beck, B. M. Knowles, A. Guedin, J.-L. Mergny, A. C. Willis, S. F. Ralph,
Dalton Trans. 2015, 44, 3136-3150.
[19] a) K. X. Chen, N. Gresh, B. Pullman, FEBS Lett. 1987, 224, 361-364.; b) R. Nanjunda, W. D. Wilson in Binding to the DNA Minor Groove by Heterocyclic Dications: From AT Specific Monomers to GC Recognition with Dimers, John Wiley & Sons, Inc., New York, USA, 2012. [20] F. J. Macias, K. M. Deo, B. J. Pages, P. Wormell, J. K. Clegg, Y. Zhang, F.
Li, G. Zheng, J. Sakoff, J. Gilbert, J. R. Aldrich-Wright, Chem. Eur. J. 2015, 21, 16990-17001.
[21] a) S. Wang, M. J. Wu, V. J. Higgins, J. R. Aldrich-Wright, Metallomics 2012, 4, 950-959.; b) K. J. Davis, J. A. Carrall, B. Lai, J. R. Aldrich-Wright, S. F. Ralph, C. T. Dillon, Dalton Trans. 2012, 41, 9417-9426. [22] N. J. Wheate, R. I. Taleb, A. M. Krause-Heuer, R. L. Cook, S. Wang, V. J.
Higgins, J. R. Aldrich-Wright, Dalton Trans. 2007, 5055-5064. [23] T. Maniatis, E. F. Fritsch, J. Sambrook, Molecular Cloning: A Laboratory
Manual, Cold Spring Harbor Laboratory, NY, USA, 1982, p. 545. [24] C. Y. Lee, H.-W. Ryu, T.-S. Ko, Bull. Korean Chem. Soc. 2001, 22, 87-89. [25] K. B. Garbutcheon-Singh, P. Leverett, S. Myers, J. R. Aldrich-Wright,
Dalton Trans. 2013, 42, 918-926.
[26] S. M. Kelly, N. C. Price, Curr. Protein Pept. Sci. 2000, 1, 349-384. [27] a) M. A. Ismail, K. J. Sanders, G. C. Fennell, H. C. Latham, P. Wormell, A.
Rodger, Biopolymers 1998, 46, 127-143.; b) F. H. Stootman, D. M. Fisher, A. Rodger, J. R. Aldrich-Wright, Analyst 2006, 131, 1145-1151. [28] O. Stern, M. Volmer, Phys. Z. 1919, 20, 183-188.
[29] D. P. Heller, C. L. Greenstock, Biophys. Chem. 1994, 50, 305-312. [30] a) W. C. Tse, D. L. Boger, Acc. Chem. Res. 2003, 37, 61-69.; b) B. K. S.
Yeung, W. C. Tse, D. L. Boger, Bioorg. Med. Chem. Letters 2003, 13, 3801-3804.; c) S. P. Sau, P. Kumar, P. K. Sharma, P. J. Hrdlicka,
Nucleic Acids Res. 2012, 40, e162.
[31] a) A. J. Miles, S. V. Hoffmann, Y. Tao, R. W. Janes, B. A. Wallace,
Spectrosc. 2007, 21, 245-255.; b) A. J. Miles, R. W. Janes, A. Brown, D. T. Clarke, J. C. Sutherland, Y. Tao, B. A. Wallace, S. V. Hoffmann, J. Synchrotron Radiat. 2008, 15, 420-422.
[32] M. Tarleton, J. Gilbert, M. J. Robertson, A. McCluskey, J. A. Sakoff,
Layout 1:
FULL PAPER
DNA binding behaviour of six polyaromatic platinum anticancer complexes has been studied using six biophysical methods (linear dichroism pictured), resulting in a comparison of the merits of each technique and the establishment of trends in DNA affinity in relation to complex structure.In vitro cytotoxicity in a panel of human cells was determined, revealing sub-micromolar activity in Du145 and SJ-G2 cells. Correlations between activity and DNA affinity were determined.
Benjamin J. Pages,Jennette Sakoff, Jayne Gilbert, Alison Rodger, Nikola P. Chmel, Nykola C. Jones,Sharon M. Kelly,Dale L. Ang, Janice R. Aldrich-Wright.*
Page No. – Page No.
Multifaceted studies of the DNA interactions and in vitro cytotoxicity of anticancer polyaromatic