Abstract— In this paper a new approach to optimize nuclear power plant designs based on global risk reduction are described. In design the focus is on as components quality as redundancy levels. Meanwhile in maintenance and test tasks the focus is on as scheduling tasks as human reliability. The models based on probabilistic risk analysis are used to evaluate several designs and schedules proposed by an hybrid genetic algorithm. The best alternative is chosen to minimize the economical risk of down the production or of have an accident for all reasons considered.
This approach has resulted in a new methodology to assure the risk for complex industrial systems too in a global way. So, it is possible considering several aspects such as component qualities, redundancy levels, task schedules for maintenance or tests tasks, and reliability human as a whole.
Index Terms—Optimize, Design, Risk, Genetic Algorithm.
I. INTRODUCTION
The nuclear power plants are very complex systems and represent especial cases where faults not end with the production down (the same case occurs with the fossil power plants). Moreover, the faults may affect to the public when the energy provider is shutting down. From 60’s these cases were analyzed using several techniques and approaches. But in the last fifteen years new techniques was developed. The review in this point will be centered mainly in the nuclear area.
From design point of view the focus was paid on the redundancy levels [1]-[5]. In the cases of maintenance and test of systems the focus was paid on the schedules [6]-[13]. The aging effects on components was reviewed and updated [14]-[17] improves the models or the parameter estimation. By the other hand, the risk approach becomes in a relevant point of view [15], [18]-[21].
The improvements of computation power allowed face more complex models and try global approaches. This paper describe a global approaches based on probabilistic risk assessments and genetic algorithms.
The works was done on CAREM-25 NPP, an innovative project that will be built in Argentina in a few years.
Manuscript received March 22, 2007. This work was supported in part by the CEDIAC Institute, Engineering Faculty, National University of Cuyo.
J. E. Núñez Mc Leod, S. S. Rivera and J. H. Barón are with Engineering Faculty, National University of Cuyo, M5502KFA, Argentina (phone: +54 261 4135000 ext. 2135, fax: +54 261 4380120, emails: [email protected], [email protected] & [email protected]).
II. REGULATION
Nuclear area has a very stringent regulation. In Argentina the regulation is based on risk. For obtain a license of nuclear power plant construction the contractor must demonstrate that the design accomplish with mandatory bound. This requirement can be seen in Fig. 1
The Fig. 1 is an X-Y graph, the frequency [1/yr] vs. Individual doses [mSv] graph. In this, several points will represent several types of accidents in the installation. If those points are situated under the bound, the plant is acceptable from risk point of view (and in a simplified way). So, in this case the risk is related to accident in the plant.
III. MODELLING
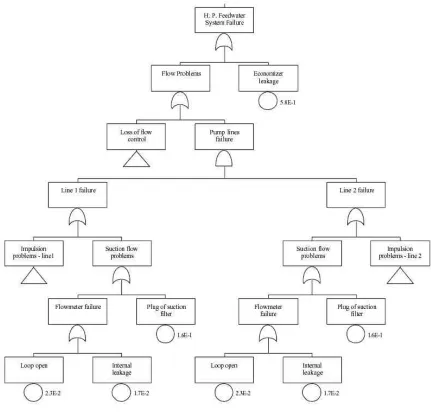
Several model types are needed to represent the possible faults that could conduct to an accidental o incidental situation in a power plant. One model type is needed to modelling the components faults and other to modelling the human error. For the first, Fault Tree Analysis [22] is used and for the human error, Human Event Trees [23]. In Fig. 2 a partial Fault Tree of a loss of main water supply in a Combined Cycle is shown.
The Fault Trees modeling the combination of root causes, by mean by Boolean gates that could produce an undesired fault (named Top event). The root causes are named basic event. When associate a quantitative model to basic event, we can compute the failure probability of the Top event. When modeling a basic event we taken into account a failure rate
Optimizing Designs based on Risk Approach
Jorge E. Núñez Mc Leod, Selva S. Rivera & Jorge H. Barón,
Universidad Nacional de Cuyo, Argentina
1,00E-12 1,00E-11 1,00E-10 1,00E-09 1,00E-08 1,00E-07 1,00E-06 1,00E-05 1,00E-04 1,00E-03 1,00E-02
1,00E-05 1,00E-04 1,00E-03 1,00E-02 1,00E-01 1,00E+00 1,00E+01 1,00E+02
DOSES [mSv]
FREQUENCY [1/Yr]
ACEPTABLE
REJECTED
[image:1.612.320.556.322.468.2]Figure 2. Fault Tree of the Emergency Flooding Systems in massive flooding regime. For clearness reason redundancy 1 was drawn only
model with aging, maintenance time interval and test time interval. When two o more basic event are related by something like a manufacturer or design or whatever an special common cause failures (CCF) model must be taken into account [24, 25]. The CCF is the weakness of the redundant components, systems or structures.
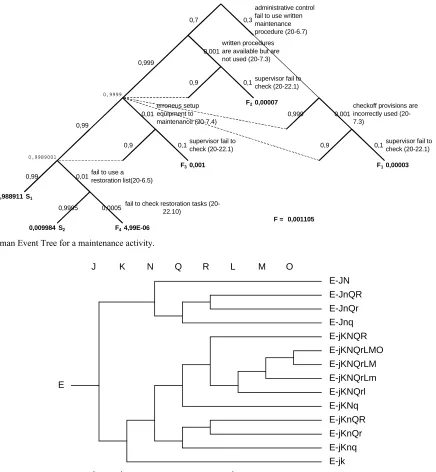
When some basic event is related to a human error a modeled using Human Event Trees (HET) is needed. In the Fig. 3 an example for a generic maintenance tasks is shown.
The quantification of HET is a very difficult task. The human error rate for each tasks is not known at first. In nuclear area several deep studies were done and a set of human error rate for several activities are available. A lot of these activities are very similar that in a fossil power plant and the extrapolation is straightforward. When the all basic human errors are quantified then the HET may be computed.
When the system faults were modeled the next step is model the accidental sequences (AS) with Event Trees (ET) [26]. In
AS several system performing their functions successful or unsuccessful. The combination of different systems performing their functions right or wrong drive the AS to different plant states. These may be totally successful, partially successful or unsuccessful. Each state may be separate into simpler states and grouped according to some criteria.
The ETs are computed and the plant states are quantified. In the Fig. 4 an ET are shown. On the right hand may be seen the different plant states obtained.
Above in the graph are located the different systems that perform their functions when the AS is developed.
In the case of fossil power plant we are near of the finish. The next paragraph is only applied to nuclear power plants.
Figure 3. Human Event Tree for a maintenance activity.
E
J K N Q R L M O
j k n q r l m o
E-JN E-JnQR E-JnQr E-Jnq E-jKNQR
E-jKNQrLM E-jKNQrLm E-jKNQrl E-jKNq E-jKnQR E-jKnQr E-jKnq E-jk
E-jKNQrLMO
Figure 4. An Event Tree for lost of heat sink. E is the initiating event (lost of heat sink) and headers (J, K, N, etc.) several emergency systems that they will act in time.
I. RISKS
In nuclear power plants the risk is formed with the frequency of AS and the individual doses due to the accident and the end plant state. The worst case include accidents with radiation on operator and public. This risk is inherently defined with the original design and increased with the maintenance and test tasks scheduled during the plant life.
Without design changes, the right maintenance and test tasks done adequacy. The personnel must be qualified and the procedures must be available. This is a truism nowadays. But the complex interaction between components quality, redundancies, time between maintenances, time between tests,
level of supervision in each task, interaction with emergency systems, and so on, reveal a new complex that need a new approach to optimize the new designs.
II. PROBLEM The variables are defined below:
Ce equipment cost,
Cm maintenance cost,
Ct test cost,
m number of subsystems,
n number of stages in each subsystem,
0,7 0,3
0,999
0,001
0,9999
0,9 0,1
0,99
0,01
F20,00007
0,999 0,001
0,9989001
0,9 0,1 0,9 0,1
0,99 0,01
F30,001 F10,00003
0,988911 S1
0,9995 0,0005
F = 0,001105 0,009984 S2 F44,99E-06
fail to check restoration tasks (20-22.10)
fail to use a restoration list(20-6.5)
erroneus setup equipment to maintenance (20-7.4)
supervisor fail to check (20-22.1)
checkoff provisions are incorrectly used (20-7.3)
supervisor fail to check (20-22.1) administrative control
fail to use written maintenance procedure (20-6.7)
x redundancies in each stage on each subsystem, cl release categories,
PD mean likelihood of doses,
D doses, P population, G punishment, e initiating event,
f(e) frequency of initiating event, qd unreliability on demand
N task number t time in standby
θ component life characteristic
µ aging factor
qM unreliability due to maintenance tasks
qP unreliability due to test tasks
ccf group common cause failure
a matrix initiate event – emergency system d initiate event doses
f(d) max freq. allowed for d (regulatory constraint) b redundancy
Tep time between tests
N maintenances by period
The problem to solve may be presented as follow: minimize
(
)
(
) (
)
+ × + +∑
∑∑
= = C C C x = P D P Gcl h g D m i n j ij kij t m
e * * *
1 1 1 (1) subject to
[
]
( ) ( ) 1 1 ) ( 1 1 1 ) / ( g m h a n j x j ccf k P k M N t N dg q q q f d
e f gh j < + + − + − ×
∏ ∑
= = +− θµ
l (2)
sup inf x b
b ≤ j≤ (3)
sup inf t Tep
Tep ≤ j≤ (4)
sup
inf N N
N ≤ j ≤ (5)
This problem can be reduce to the Lueker formulation [27] for demonstrate that is a NP-Complete problem.
The importance of this conclusion is that at the moment, all the algorithms known for NP-complete problems use exponential time with respect to the size of the input. It is not known if there are better algorithms, thus, to solve a NP-complete problem of arbitrary size is used one of the following approaches: approximation, probabilistic, special cases and heuristic. In this problem was decided to implement an Hybrid Evolutionary Algorithm. This algorithm should guarantee a correct exploration of the space search and a time of reasonable convergence.
III. HYBRID EVOLUTIONARY ALGORITHM
Genetic Algorithm (GA) [28] is a paradigm that emulate the natural selection like was expressed by Charles Darwin [29].
It was decided not to use a standard or predefined GA. The decision was based on that the generic algorithms do not incorporate information of the problem. This is not the recommendable thing for cases of extreme complexity (like NP-complete problems). The most algorithm will work with an excessive time of convergence and a large amount of used memory storing the generated populations of individuals.
Based on a set of previous works [30][31][32], a series of strategies was developed to incorporate specific knowledge of the problem to the EA. The sampling of the space were optimized developing a special technique. The method is named Stochastic Stratified Tournament Sampling (SSTS) [33]. This method obtains a sample that allows to adequately handling the genetic diversity (alternative diversity). This is an important issue on the searching for the best alternative.
In the Stochastic Tournament Sampling (STS) method, by using a simple sampling, a competing pair of individuals is obtained. For example, they compete by its ability to fit an objective function, or stochastically weighted by the adjustment function of each one. One limitation of this scheme is that certain portions of the population space may not be sampled. An improvement over this scheme is the SSTS, where the population is stratified (e.g. in groups of 5 individuals) and the sampling is con-ducted in each group, looking for proper pairs. Then a competence (tournament) is performed, based on a weighted adjustment of both chromosomes. The se-lection can be conducted in such a way that a stable population of solutions is maintained, or increasing the population of solutions.
The goal of the SSTS technique is to maintain a high diversity of alternatives as long as possible, by the share of portions of relevant information to the new generations, as a faster way to obtain the quasi optimum of the solutions.
Based as well on these previous works the design to a Hybrid Evolutionary Algorithm was oriented that combines the properties of the Evolutionary Strategies [34] and the Genetic Algorithms.
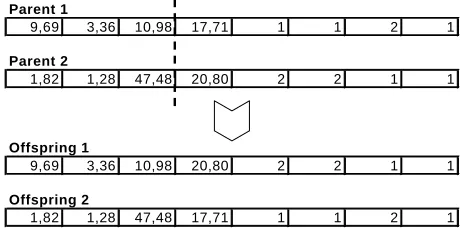
[image:4.612.59.298.368.522.2]In GA in general the values needed to solve a problem are sort in an array named chromosome for its similarity with the natural counterpart. Normally, a set of chromosome generates in a random way form a population. Randomly two individuals are selected from the population for breed two new individuals. In this moment a cross point is chosen randomly on the chromosome and then the genetic material are exchanged. The Fig. 5 shows the process. This is known as a crossover operator.
Figure 5. Crossover process
crossover point Parent 1
9,69 3,36 10,98 17,71 1 1 2 1
Parent 2
1,82 1,28 47,48 20,80 2 2 1 1
Offspring 1
9,69 3,36 10,98 20,80 2 2 1 1
Offspring 2
[image:4.612.323.553.597.711.2]individual ranges
1,82 1 2 real values
1,28 1 2 real values
47,48 1 110 real values
20,80 1 25 real values
2 1 3 integer values
2 1 2 integer values
1 1 3 integer values
[image:5.612.46.270.50.157.2]1 1 2 integer values
Figure 6. Table of ranges
The mutation operator is other key in this hybrid genetic algorithm. The idea is that this operator generates offspring feasible always. In that sense, each gen has appended some of the schemas shown in the figure 6.
Note that there are two groups well defined. This is necessary to simplify the operator implementation. The mutation is expressed in a mathematical form as:
λ
λ
I
I
m
pm:
→
(6)The application of this operator is:
)
(
)
,...,
(
)
,...,
(
´
a
1a
m
a
1a
m
a
a
=
′
l′
=
pm l=
pm (7)according to
(
∀
i
∈
{
1
,...,
l
}
)
:
≥
∧
≤
<
∧
≤
>
=
′
q
i
pm
if
up
lr
q
i
pm
if
up
lr
pm
if
a
a
i i i i i i i i i i iχ
χ
χ
χ
χ
)),
,
(
int(
,
)
,
(
,
(8)Where ai represents the ith gen and pm is the mutation probability. χi denotes an uniform random variable sampled anew for each gen. lri and upi represent the variable lower bound and upper bound respectively and q is the first integer value gen in the chromosome.
The chromosome contains the information about component quality, redundancy level, maintenance interval, test interval and so on.
IV. RESULTS
The resolution of each individual consumed 1.39 seconds. It were made different executions of the program with 50 and 100 individuals by generation and of 50 from 1,000 generations. For all the cases the quasioptimum solution was found before the 50 generations, nevertheless were proved sizes of generations like 1,000 to confirm that one was not in the presence of quasioptimum that could be improved with the evolution processes. This process consumed 3 hours and 50 minutes approximately.
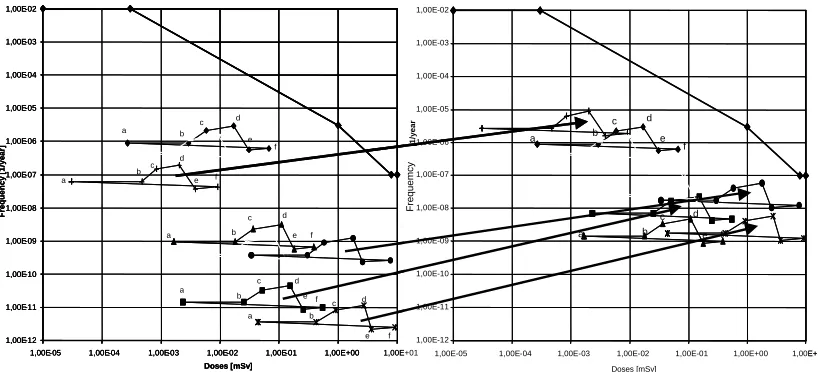
[image:5.612.48.297.265.397.2]Results were compared with the original design. The best optimized design allocate in several cases a double redundancy where three was allowed. A right supervision level was assigned to reduce the human error and none over supervision was assigned. The maintenance interval over mechanical components was found to be shorter than for electronic components and the test interval over electronic components was found to be shorter than for mechanical components. But the most important result was to obtain a balanced design with their future maintenance and test schedules established from a risk point of view, and for the minimum total cost.
Fig. 7 shows a comparison results without optimization (on left) and results with optimization (on right). In this graphics the points joined with lines appertain to the same release category. Some sets with the optimization are moved up but they always stay under the regulatory bound. These displacements represents a decrease in the total cost of the plant.
V. CONCLUSION
The approach to optimize design, maintenance tasks and test tasks was robust and their results can be replicated. The use of Probabilistic Risk Assessment techniques resulted in detailed and flexible methodology to modeling. The use of genetic algorithm to optimize a complex problem resulted efficient and fast having into account the size of the search space.
Figure 7. Results comparison. On Y-axis represent frequency (1/year) and X-axis represent doses (mSv).
AR 10.1.1 CL1 CL2 CL3 CL4 CL5 CL6 CL7 CL8 1,00E-12 1,00E-11 1,00E-10 1,00E-09 1,00E-08 1,00E-07 1,00E-06 1,00E-05 1,00E-04 1,00E-03 1,00E-02
1,00E-05 1,00E-04 1,00E-03 1,00E-02 1,00E-01 1,00E+00 1,00E+01 Doses [mSv]
Frequemcy
[1/
year a b
c d e f a b c d e f 1,00E+01 1,00E-12 1,00E-11 1,00E-10 1,00E-09 1,00E-08 1,00E-07 1,00E-06 1,00E-05 1,00E-04 1,00E-03 1,00E-02
1,00E-05 1,00E-04 1,00E-03 1,00E-02 1,00E-01 1,00E+00 a b c d e f a b c d e f a b c d e f a b c d e f a b c d e f Doses [mSv] Frequency [1/ year ] AR 10.1.1 CL1 CL2 CL3 CL4 CL5 CL6 CL7 CL8 1,00E-12 1,00E-11 1,00E-10 1,00E-09 1,00E-08 1,00E-07 1,00E-06 1,00E-05 1,00E-04 1,00E-03 1,00E-02
1,00E-05 1,00E-04 1,00E-03 1,00E-02 1,00E-01 1,00E+00 1,00E+01 Doses [mSv]
Frequemcy
[1/
year a b
c d e f a b c d e f 1,00E+01 1,00E-12 1,00E-11 1,00E-10 1,00E-09 1,00E-08 1,00E-07 1,00E-06 1,00E-05 1,00E-04 1,00E-03 1,00E-02
1,00E-05 1,00E-04 1,00E-03 1,00E-02 1,00E-01 1,00E+00 a b c d e f a b c d e f a b c d e f a b c d e f a b c d e f Doses [mSv] Frequency [1/ year ] 1,00E-12 1,00E-11 1,00E-10 1,00E-09 1,00E-08 1,00E-07 1,00E-06 1,00E-05 1,00E-04 1,00E-03 1,00E-02
[image:5.612.103.512.519.705.2]REFERENCES
[1] R. Luus, “Optimization of System Reliability by a New Nonlinear Integer Programming Procedure,” IEEE Transactions on Reliability, 1975,
24(1): p. 14-16.
[2] A.K.Dhingra, “Optimal Apportionment of Reliability & Redundancy in Series Systems Under Multiple Objectives,” IEEE Transactions on Reliability, 1992, 41(4): p. 576-582.
[3] Z.Xu, W. Kuo, and H.-H. Lin, “Optimization limits in improving system reliability,” IEEE Transactions on Reliability, 1990. 39(1): p. 51-60.
[4] D.W. Coitand A.E. Smith, “Reliability optimization of series-parallel systems using a genetic algorithm,” IEEE Transactions on Reliability,
1996, 45(2): p. 254-260.
[5] M.Cantoni, M. Marseguerra, and E. Zio, “Genetic algorithms and Monte Carlo simulation for optimal plant design,” Reliability Engineering and
System Safety, 2000(68): p. 29-38.
[6] Y.A. Choi and M.A. Feltus, “Application of reliability-centered maintenance to boiling water reactor emergency core cooling systems fault-tree analysis,” Nuclear Technology, 1995, 111: p. 115-121.
[7] R.Dekker, “Applications of maintenance optimization models: a review and analysis,” Reliability Engineering and System Safety, 1996(51): p.
229-240.
[8] M. Harunuzzaman and T. Aldemir, “Optimization of standby safety system maintenance schedules in nuclear power plants,” Nuclear
Technology, 1996, 113: p. 354-367.
[9] C.M.F. Lapa, C.M.N.A. Pereira, and A.C.d.A. Mol, “Maximization of a nuclear system availability through maintenance scheduling optimization using a genetic algorithm,” Nuclear Engineering and Design, 2000, 196:
p. 219-231.
[10] M. Marseguerra and E. Zio, “Optimizing maintenance and repair policies via a combination of genetic algorithms and Monte Carlo simulation,”
Reliability Engineering and System Safety, 2000(68): p. 69-83.
[11] S. Martorell, et al., “Constrained optimization of test intervals using a steady-state genetic algorithm,” Reliability Engineering and System
Safety, 2000(67): p. 215-232.
[12] C.M. Rocco, et al., “Sensitivity and uncertainty analysis in optimization programs using an evolutionary approach: a maintenance application,”
Reliability Engineering and System Safety, 2000(67): p. 249-256.
[13] Y.-T. Tsai, K.-S. Wang, and H.-Y. Teng, “Optimizing preventive maintenance for mechanical components using genetic algorithms,”
Reliability Engineering and System Safety, 2001(74): p. 89-97.
[14] R.D. Radulovich, W.E. Vesely, and T. Aldemir, “Aging effects on time-dependent nuclear plant component unavailability: an investigation of variations from static calculations,” Nuclear Technology, 1995, 112:
p. 21-41.
[15] J.C. Duthie, et al., “Risk-based approaches to ageing and maintenance management,” Nuclear Engineering and Design, 1998, 184: p. 27-38.
[16] J. Crocker and U.D. Kumar, “Age-related maintenance versus reliability centred maintenance: a case study on aero-engines,” Reliability
Engineering and System Safety, 2000(67): p. 113-118.
[17] Phillips, J.H., et al., “Incorporation of passive components aging into PRAs,” Nuclear Engineering and Design, 1993(142): p. 167-177.
[18] P. Kafka, “Probabilistic safety assessment: quantitative process to balance design, manufacturing and operation for safety of plant structures and systems,” Nuclear Engineering and Design, 1996, 165: p. 333-350.
[19] R.J. Rohrer and C.F. Nierode, “Simple method for risk assessment of nuclear power plant refueling outages,” Nuclear Engineering and
Design, 1996, 167: p. 193-201.
[20] M. Richner and S. Zimmermann. “Applications of simplified and of detailed PSA models,” Probabilistic Safety Assessment and
Management, 1998, Springer Verlag.
[21] A.Muñoz, S. Martorell, and V. Serradell. “Numerical absolute & constrained optimization of maintenance based on risk and cost criteria using genetic algorithms,” European Safety and Reliability Conference.
Vol. 3, 1997. Portugal: Pergamon, pp 1749-1756.
[22] W. Vesely, et al., Fault Tree Handbook, NUREG-0492, ed. NRC. 1981,
Washington.
[23] A. Swain and H. Guttman, Handbook on Human Reliability Analysis
with Emphasis on Nuclear Power Plant Applications.
NUREG/CR-1278, ed. N.R. Commission. 1983, Washington, USA. [24] R.R. Fullwood, Probabilistic Safety Assessment in the Chemical and
Nuclear Industries, 2000, Boston, USA: Butterworth-Heinemann.
[25] J. Barón,, J. Núñez Mc Leod, and S. Rivera “Human reliability analysis to consider common cause failures for a research reactor during its design phase,” Probabilistic Safety Assessment and Management, Vol. 1, 2002,
Ed. USA: Elsevier, pp 47-52
[26] Nuclear Regulatory Commission, PRA Procedures Guide: A guide to the performance of probabilistic risk assessments for nuclear power plants
review. NUREG/CR 2300, ed. NRC. 1983, Washington: NRC.
[27] G.S. Lueker, “Two NP-complete problems in nonnegative integer programming,” Technical Report TR-178, Computer Science Laboratory,
Princeton University, Princeton, NJ, 1975.
[28] D. Goldberg, Genetic Algorithms in Search, Optimization & Machine
Learning, 1989, Reading, Massachusetts, USA: Addison-Wesley Co.
[29] C. Darwin, On the origin of species by means of natural selection, or the
preservation of favoured races in the struggle for life. 1859: England.
[30] J. E. Núñez Mc Leod, “Selección Óptima de Componentes de un Sistema Tecnológico Complejo,” Métodos Numéricos en Ingeniería y Ciencias
Aplicadas, Ed. SVMNI, 2000, pp OP41-OP46.
[31] J. Barón y J. Núñez Mc Leod. “Generación Escalable de Muestras. Simulación con Métodos Numéricos,” Nuevas Tendencias y
Aplicaciones. Ed. SVMNI, 1998, pp VA1-VA8.
[32] J. Barón, J. Núñez Mc Leod y S. Rivera, “Muestreo Montecarlo e Hipercubo Latino versus Hipercubo Latino Escalable,” Métodos
Numéricos en Ingeniería, Ed. SEMNI, 1999, España. p 63 (resumen).
[33] J. Núñez Mc Leod, “Chapter 3: Sampling Methods in Evolutionary Computation Assuring Genetic Diversity and Stochastic Selections,”
Evolutionary Algorithms and Intelligent Tools in Engineering
Optimization, Annicchiarico, W. et al. (eds.), Ed. CIMNE -Wit Press,
Southampton, Boston, UK, 2005, pp 52-71.
[34] T. Bäck, U. Hammel, and H.-P. Schwefel, “Evolutionary computation: comments on the history and current state,” IEEE Transactions on