Abstract— The level of competition has reached the limits in cellular phone market and the cellular phone manufacturers started to focus their solution in user interface. Design issues with controllability led the development and renovation of such products to the use of touch-screen phone. Touch-screen phones enhanced controllability through the instinctive use and differentiated the design by remarkable change of form factors. In this research, the controllability was dealt in regard to various grip postures, in order to improve menu layout which fits for using a thumb. Regression models were found to suggest the IDA (Iso-Discomfort Area) applying for the thumb of both hands and that of single hand. IDA indicated the level of preference (Optimum, Preferred and Acceptable) during the control of touch-screen phone. This study will allow examining the appropriateness of interface and figure out the improvement of previous touch-screen phones.
Index Terms— Touch-screen phone, controllability, grip posture
I. INTRODUCTION
As the digital industry’s competitive paradigm shifts from producer-oriented to user-oriented, usability became an important factor which determined not the fad but the direction of product innovation [2]. Touch-screen phones enhanced usability through the instinctive use and met the requirements of a large display according to increasing multi-media’s needs [5]. Moreover, it differentiated the design by remarkable change of form factors after bar, folder and slide types [6].
The sales of touch-screen phone are expected to increase 193,000,000 in 2010 [3]. Because a touch-screen phone is more intuitive than the previous method which users push buttons according to menu. In addition, it offers the simple image representing the relevant status and the tactile feedback that provides realism and users’ affective experience, unlike the feeling from the previous button types. The previous studies that improved usability focused on complex hierarchical structure based on menu-driven
Manuscript received December 17, 2009.
Youngjae Im is with the Department of Information Management and Security, Korea University, Seoul, South Korea (corresponding author to provide phone: 82-2-3290-3902; e-mail: [email protected]).
Sungil Cho is with the Design Corporate Consumer Experience Design, LG Electronics, Seoul, South Korea (e-mail: [email protected]).
Sungjoon Park is with the Department of Industrial Management Engineering, Namseoul University, Cheonan, South Korea (e-mail: [email protected]).
Eui S. Jung is with the Division of Information Management Engineering, Korea University, Seoul, South Korea (e-mail: [email protected]).
Junsoo Park is with the Department of Information Management and Security, Korea University, Seoul, South Korea (e-mail: [email protected]).
interface and reduction of a human error generated from complicated function. Helle et al. [8] and Han [7] conducted a modeling about users’ menu selection on mobile devices and Liu et al. [12] developed an adaptive user interface which can change the menu interface according to the individual requirements. That is, the objective of these studies was the demonstration of an optimal interface by revealing the improvement which is much close to the mental model of users and reviewing the structure of previous menu.
However, as the trend of mobile phone transfers to touch-screen, there are few research areas that can be found despite the importance of study about the interaction between users and touch-screen devices, and the direct access which is sensible to feedback. The control of touch-screen phone needs to be similar to actual movement and select the object directly on the menu display. For those reasons it is necessary to investigate the menu layout including controllability and function arrangement.
Therefore, this study firstly conducts a customer survey about a matter of various grip postures and uncomfortable use of a touch-screen phone. Secondly, the study analyzes the influence of human anthropometric characteristics and form factors on the control discomfort. Thirdly, the study derives prediction models of discomfort area and CFRE (Comfort Finger-tip Reach Envelope) that is possible to control setting for users’ intention without failure. Lastly, the study elicits the definition of IDA (Iso-Discomfort Area) applying for various grip postures (right hand, left hand, and both hands) by using a verbal scale of the subject. It is expected that uncomfortable use of a touch-screen will be improved during menu selection task. Furthermore, a guideline which provides an easy and universal control pattern will be suggested.
II. SURVEY OF UNCOMFORTABLE USE OF TOUCH-SCREEN PHONES
The control of existing phones gets accomplished by using a thumb. But the latest touch-screen phone is operated by using an index finger more [9]. The survey of 13 graduate students who have an experience of using touch-screen phones, aged between 25 and 29 years, found that they prefer index finger control (8 people) to thumb control (5 people).
One of the main reasons is the frequent malfunction in case of thumb control and the other is the motion restrictions of using too remote or near icons. Also, using a thumb caused low accuracy of task completion and high level of fatigue. Some index finger users responded that they tend to use both hands due to the aforementioned problems even if they can control the phone by one hand. Thus, it’s necessary to understand uncomfortable factors of thumb control for using touch-screen phones.
Controllability of Touch-screen Phones
based on Various Grip Postures
III. SELECTION OF MAIN FACTORS INFLUENCING CONTROLLABILITY
A. Characteristic of human variables
As mentioned above, controllability of the thumb is one of the critical factors for using a touch-screen phone. It needs to be analyzed whether or not differences in the thumb length in percentiles has an effect on the controllability. However, the recent Korean anthropometric survey (Size Korea, 2005) omitted data of the thumb length. For this reason, the thumb length was estimated based on the correlation with the length of another finger.
First of all, it was assumed that if the thumb is longer the hand is also longer. And then a correlation test was conducted between the length of index finger and hand length using anthropometric data from 19 to 69 year old males. A significant result (p < 0.01) was obtained that the length of index finger was positively related with hand length. Consequently, the index finger was substituted for the thumb, which serves as a classification criterion of percentiles.
TABLE 1.CORRELATION COEFFICIENT
FOR ANTHROPOMETRIC VARIABLES RELATED TO HAND Hand
length
Length of index finger
Hand length
Pearson’s
r 1.00 0.64
p-value 0.00
n 2856 2853
B. Characteristic of physical user interface
Recently, customers want products that meet usability and physical user interface beyond functional design. Physical user interface includes elements of interaction between human and machine such as button, knob and lever, etc [10]. According to the guideline of standard touch devices, the optimal button size and space of buttons were 20mm and 3mm respectively [13]. Another research indicated that the proper button size was 9mm in terms of smart touch devices [14].
The number of menu icons and arrangement of the touch-screen phones are usually determined on a basis of button size and space of buttons. Because of this reason, these factors are considered to assess the controllability of the touch-screen phone. Therefore, experimental design for choosing main factors in this study was planned based on the previous research.
C. Method
1) Subject
Ten participants took part in the experiment, aged between 26 and 35 years. They were graduate students of the Korea University and all of them were regular users of a mobile phone. All subjects were male without any musculoskeletal diseases to minimize anthropometric differences.
2) Experimental design
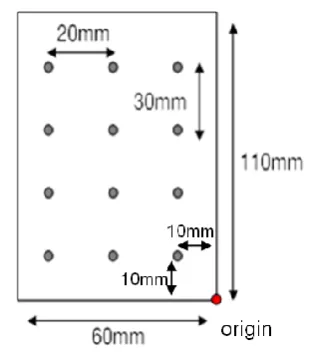
A 2 x 3 x 4 mixed-subject design was employed in the experiment. The length of index finger and row and column distances, which could affect controllability, were selected as three independent variables. The length of index finger was varied at two levels: below 50th percentile, over 50th percentile. The row distance was manipulated at three levels: 10, 30, and 50mm from the origin. The column distance included four levels: 10, 40, 70 and 100mm from the origin presented in Fig. 1.
[image:2.595.352.508.169.351.2]
Fig. 1. Condition of the experiment
The discomfort scores were collected on a scale of 0 (most preferred) to 100 (least preferred), and they were used as the dependent variables. Also, each participant was randomly assigned to one of the 12 experimental conditions.
3) Environment and procedure
A prototype was manufactured through a market research of the newest touch-screen phone. To minimize low fidelity of the prototype, all subjects are acquainted with the control of the real touch-screen phone prior to the experiment. When the experiment begins, each subject was asked to first find the most comfortable position primarily and then perform the relevant treatment following a test order. At this time a grip type of the prototype is controlled by a right handed posture.
4) Results
A three-way ANOVA, aided by SPSS version 12.0 statistical program, was carried out on the discomfort of controllability. The analysis revealed no effect for two levels of percentile (p > 0.05). As for usability, controllability of the thumb itself was pointed out to be a major factor which resulted from the customer survey. Nevertheless, it was not sensitive enough to discern the difference in percentiles.
[image:2.595.65.272.311.395.2]TABLE 2.THE ANOVA RESULT OF THE EACH FACTORS
Source df SS F Pr > F
RD 2 14334.82 30.28 0.00
RD*Percentile 2 806.40 1.70 0.19
CD 3 21554.08 79.03 0.00
CD*Percentile 3 312.75 1.15 0.34 RD*CD 6 14134.18 43.57 0.00 Percentile 1 3326.43 2.19 0.18 RD: Row Distance, CD: Column Distance
IV. CONSTRUCTION OF PREDICTION MODEL OF THE DISCOMFORT AREA
The additional experiment was performed to enhance usability and controllability of thumb and elicit CFRE (Comfort Finger-tip Reach Envelope). Row and column distances that were previously proved significant were planned as entry variables in the prediction model.
A. Method 1) Subject
Subjects consisted of 15 healthy individuals (all males) whose ages range from 25 to 34 years. The subjects were independently recruited through an advertisement in the website. They were selected regardless of percentile of thumb length and represented target population of the touch-screen phone.
2) Experimental design
[image:3.595.59.281.69.159.2]The independent variables of this experiment were row and column distances. To obtain a regression model with statistical validity, the level of row and column distances need to be more departmentalized as shown in Fig. 2.
Fig. 2. Condition of the experiment
A market survey found that the size of menu icon of the touch-screen phone in common use was 10mm wide and 15mm long. Thus, row distance had 5 levels: 10, 20, 30, 40 and 50 mm and column distance had 7 levels: 10, 25, 40, 55, 70, 85 and 100 mm from the origin.
Also, the grip posture was determined as an independent variable because of the diversity in possible grip postures when using a touch-screen phone. Grip posture included
three levels: right hand, left hand and both hands.
A 5 x 7 x 3 within-subject (row distance x column distance x grip posture) design was performed in the experiment. Participants rated the discomfort of control that they perceived using a 100-point rating scale (0 - not felt at all to 100 - felt very much).
3) Environment and procedure
The experiment was conducted in a quiet room at the lab setting in Korea University. Each participant was required to perform the task alone with no other participants. They were instructed on how to use a touch-screen phone. The purpose and procedure of the study were explained in detail and the subjects gave their informed consents. The participants performed three types of grip postures and 35 trials on all such types. To avoid an error caused by fatigue, they took a short break after each grip posture.
4) Results
RSM (Response Surface Method) aims to find the optimal setting for a set of design features that maximize (or minimize) a response [1]. In this study, RSM methodology was applied to describe the relationship between respective independent variables and discomfort scores.
Minitab Release 13.0 was used to analyze the data. As a result, the model equation in RSM was defined as a distance function of different grip types. This will allow designers to predict discomfort area and CFRE with specific grip posture.
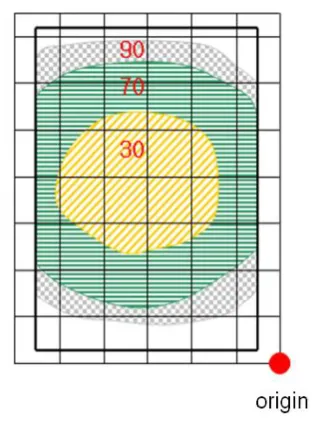
Designers of touch-screen phones must consider various types of grip posture reflecting user’s needs. Thus, it was calculated as a commonly overlapped area that named IDA (Iso-Discomfort Area) through an intersection among the discomfort areas of right, left and both hands. IDA means a set of positions which causes identical discomfort when touch-screen phone is used.
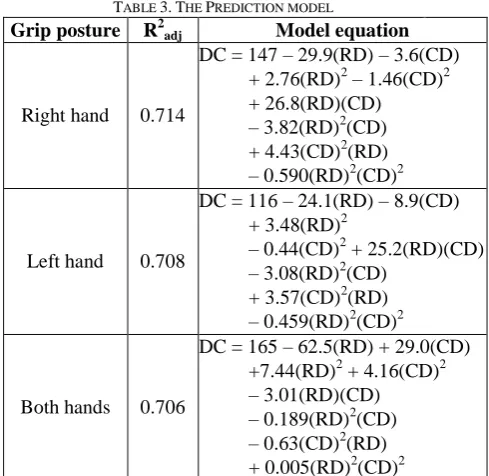
TABLE 3.THE PREDICTION MODEL
Grip posture R2adj Model equation
Right hand 0.714
DC = 147 – 29.9(RD) – 3.6(CD) + 2.76(RD)2 – 1.46(CD)2 + 26.8(RD)(CD) – 3.82(RD)2(CD) + 4.43(CD)2(RD) – 0.590(RD)2
(CD)2
Left hand 0.708
DC = 116 – 24.1(RD) – 8.9(CD) + 3.48(RD)2
– 0.44(CD)2
+ 25.2(RD)(CD) – 3.08(RD)2(CD)
+ 3.57(CD)2(RD) – 0.459(RD)2(CD)2
Both hands 0.706
DC = 165 – 62.5(RD) + 29.0(CD) +7.44(RD)2 + 4.16(CD)2 – 3.01(RD)(CD)
– 0.189(RD)2(CD) – 0.63(CD)2
[image:3.595.304.549.423.661.2] [image:3.595.97.251.493.674.2]Fig. 3. Iso-Discomfort Area
Inspecting on the score distribution (from 20 to 90) of IDA, discomfort interval of vertical direction was narrower when compared to that of horizontal direction. This indicates the discomfort of vertical direction was more sensitive while users were experiencing the device. Therefore, the arrangement of menu-icons which moved upward and downward would give higher priority for improving the controllability.
[image:4.595.92.257.489.700.2]Meanwhile, it is necessary to give a practical and user-centered interpretation regarding discomfort score of the IDA. After the experiment was completed, subjects responded on marginal scores of the discomfort with all three levels (uncomfortable, normal and comfortable). As a result, the verbal scale that included level of control was defined (Table 4) and IDA was reconstructed by the verbal scale (Fig. 4).
Fig. 4. The revised form of IDA
V. DISCUSSION AND CONCLUSION
As the use of mobile phone which is equipped with the touch-screen has increased, the necessity of research on finger control-based user interface has also risen lately [11]. According to a survey, users preferred an index finger to a thumb when they control a touch screen phone. Because of the restrictions on motion, the control using a thumb caused more difficulties about the reach of relevant objects [4]. Hence, more studies on the controllability of touch-screen phone and menu layout considering various grip postures are in great need.
In the experiment to select the factors affecting the controllability, the length of index finger that presents one of the human variables did not show any significant effect. For the verification of this, the optimal position on the prototype was measured by each subject. As a result, more than 90% of the subjects’ optimal positions were similarly distributed about 67mm from the origin. On the other hand, row and column distances determining the form factors of a touch-screen phone had an effect on discomfort of control. Therefore, design factors of physical user interface need to be investigated continuously when the display size becomes a main issue in the market.
The CFRE that classifies each grip posture and common IDA were derived through the experiment on discomfort. When users stretch out their thumb too far or severely bend inside their thumb, the discomfort score was increased and malfunctions frequently occurred. That is, the most preferable functions have to be located inside the optimal area of IDA. A particular point is that the sensitivity of vertical direction gets higher than that of horizontal direction. Thus, functions which had the clear priority need to be arranged along the vertical direction.
As a further study, a comparative evaluation between recommended models and existing products needs to be performed by mapping the results of function survey and IDA. This will allow examining the appropriateness of interface and figuring out the improvement of previous touch-screen phones. Furthermore, it is expected that this study be used for an initial study of the thumb control which can be applied to various hand-held devices.
REFERENCES
[1] Box, G.E.P. and Draper, N.R., Empirical Model-Building and
Response Surfaces. Hoboken, NJ: Wiley, 1987.
[2] Choi, B.S., “Usability has appeared an important topic in electronics industry,” SERI economic focus, vol. 182, 2008, pp. 1-3.
[3] Display Bank, “Touch Screen Panel: Applications & Technologies,” 2008, unpublished.
[4] Gerd, W. and Ulrich, K., “User-Centered Evaluation of the Responsiveness of Applications,” Proc. of 12th Int. Conf. on Interact, 2009, pp. 239-242.
[5] Gerstheimer, O. and Lupp, C., “Needs versus technology-The challenge to design third-generation mobile applications,” Journal of
Business Research, vol. 57(12), 2004, pp. 1409-1415.
[6] Han, E.S., Shin, Y.H. and Jeong, D.H., “Trends and outlooks of mobile handset on convergence,” Trend analysis of electronics and
communication, vol. 23(2), 2008, pp. 74-76.
[7] Han, S.Y., “Design of Menu Driven Interface using Error Analysis,”
Journal of the Ergonomics Society of Korea, vol. 23(4), 2004, pp. 9-21.
[8] Helle, S., Leplatre, G., Marila, J. and Laine, P., “Menu sonification in a mobile phone-a prototype study,” Proc. of Int. Conf. on Auditory
Display, 2001, pp. 112-115.
[9] Henry, P., Why There is No Perfect Design. New York: Random House, 2005.
TABLE 4.DEFINITION OF THE VERBAL SCALE
Verbal scale Level of control Definition
[image:4.595.54.273.733.787.2][10] Jin, B.S, Ko, S.M., Mun, J.S. and Ji, Y.G., “A Study for Usability Risk Level in Physical User Interface of Mobile Phone,” HCII LNCS, vol. 4559, 2007, pp. 327-335.
[11] Kim, K.S. and Lee, S.S., “A Guideline on Finger-operated Touch screen Interface in a Small Size Display,” Proc. of a spring symposium
on Korean Society of Design Science, 2006, pp. 10-11.
[12] Liu, K., Wong, C.K. and Hui, K.K., “An Adaptive User Interface based on Personalized Learning,” IEEE Intelligent Systems, vol. 18(2), 2003, pp. 52-57.
[13] Mayhew, D.J., Principle and Guidelines in Software User Interface
Design. Upper Saddle River, NJ: Prentice Hall, 1992.