Load Balancing and Rate Limiting Based
Algorithms for Improving Cloud Computing
Performance
Joseph Doyle
A thesis submitted for the degree of
Doctor of Philosophy in Computer Science
University of Dublin, Trinity College
School of Computer Science and Statistics
Supervisor: Prof Donal O’Mahony
Declaration
I declare that the work in this thesis has not been submitted for a degree at any other university,
and that the work is entirely my own.
Signature
Joseph Doyle
Permission to Lend and/or Copy
I agree that the Library in Trinity College may lend or copy this thesis upon request.
Signature
Joseph Doyle
Acknowledgements
Firstly I would like to thank Professor Donal O’Mahony and Professor Robert Shorten for their
wisdom and guidance throughout my postgraduate work. This work would be a pale shadow
of itself without their knowledge and advice.
Many thanks to Rade Stanojevi´c and Florian Knorn for their discussions about
algo-rithms in communication networks which greatly influenced this work. I thanks Dimitris
Kala-matianos for his discussions about conjugate gradient algorithms.
I thank Andreas Simon-Kajda and Dirk Niemeier for their help with the computational
fluid dynamics simulations.
Hearty thanks to all my colleagues in CTVR for their encouragement and for providing
such a pleasant working atmosphere. Thanks to all my friends for preventing me from constantly
looking at a monitor screen.
I am deeply indebted to my family for their understanding and support. I especially
thank Matthew, Lisa and Joe for their help with the enclosure construction. I also thank
Pauline for proofreading this work.
Finally, I thank my girlfriend Laura for her immense support and understanding when
Abstract
The cloud computing paradigm has recently become an increasing popular method for the
delivery of internet services. While the increased utilisation of the cloud has made it easier
for cloud operators to recover their capital investment further work can be done to maximise
profits. The cost of constructing a cloud is considerable (hundreds of millions of Euro) and
the operating cost is also significant (tens of millions of Euro annually). Cloud operators can
attempt to ensure that their capital investments are recovered by lowering operating costs and
using mechanisms which endeavour to maintain high utilisation.
In this dissertation we begin by examining methods which cloud operators can use to
control bandwidth utilisation to ensure high utilisation. Fixed cost pricing is more desirable to
enterprises and we examine the use of distributed rate limiting to achieve this in the cloud. In
addition, some clouds are public environments and as such mechanisms that ensure that each
user receives a fair share of the bandwidth available are useful in maintaining quality of service
levels. We propose the use of a dropping mechanism to achieve this and compare it with the
established token bucket mechanism.
We then shift our attention to investigate methods which cloud operators can use to
lower the operational costs. Firstly we propose algorithms to lower cooling costs while ensuring
all demand is serviced. Data centres generate a lot of heat and this must be removed to prevent
damage to equipment. Some data centres are excessively cooled to cater for worst-case airflows.
By equalising the inlet temperature of server racks within a data centre we attempt to lower
the cooling cost. Secondly we examine algorithms to lower carbon emissions while maintaining
a reasonable Quality of Service (QoS) level. The carbon intensity of electricity suppliers, which
is the carbon emitted to produce a given amount of electricity, varies in different geographical
regions. Our work formulates the operation of the cloud as an optimisation problem and
applies the subgradient method to minimise the combination of average service request time and
carbon emissions. Finally we propose an algorithm which uses Voronoi partitions to minimise
a function which encompases the electricity cost, carbon emissions and average service request
time. Both the electricity cost and carbon emissions are affected by the cooling design used
at the data centre and we also incorporate this in our simulations in this section. We gather
carbon intensity, electricity price and latency data for a cloud which has data centres in USA
and Europe (similar to a popular commercial cloud). Our work then utilises this data and
examines how this algorithm can be used to achieve a variety of goals such as minimising
Contents
Declaration ii
Permission to Lend and/or Copy iii
Acknowledgements iv
Abstract v
1 Introduction 1
1.1 Key Contributions . . . 3
1.2 Disertation Outline . . . 3
1.3 Publications arising from this work . . . 4
2 Background 5 2.1 Introduction . . . 5
2.2 Cloud Computing . . . 7
2.2.1 Models . . . 7
2.3 Hardware . . . 8
2.3.1 Data Centre Architecture . . . 9
2.3.2 Cooling . . . 12
2.3.3 Bandwidth Management . . . 15
2.3.4 Data Centre Costs . . . 18
2.4 Applicable Theory . . . 20
2.4.1 Consensus Algorithms . . . 20
2.4.2 Voronoi Paritions . . . 21
2.5.1 Current Methods . . . 23
2.5.2 Current Research . . . 27
2.6 Rate Limiting . . . 28
2.6.1 Distributed Rate Limiting . . . 28
2.7 Summary . . . 30
3 DRL Pricing 32 3.1 Abstract . . . 32
3.2 Introduction . . . 32
3.3 Mathematical Framework . . . 34
3.3.1 Cloud Control With Constant Probabilities (C3P) . . . 34
3.3.2 Distributed Deficit Round Robin (D2R2) . . . 35
3.3.3 Improving Resilience to Failure . . . 37
3.3.4 Updating Aggregate Capacity . . . 38
3.4 Experimental Setup . . . 39
3.5 Experimental Results . . . 40
3.5.1 Comparison with Simulation . . . 41
3.5.2 Failure Tolerance . . . 44
3.5.3 Changing Aggregate Capacity . . . 48
3.6 Summary . . . 49
4 Bandwidth Management in Data Centres 52 4.1 Abstract . . . 52
4.2 Introduction . . . 52
4.3 “Fair-share” Dropping Mechanism . . . 54
4.4 Experimental Setup . . . 55
4.5 Experimental Results . . . 56
4.6 Summary . . . 57
5 Thermal Management of Data Centres 59 5.1 Abstract . . . 59
5.2 Introduction . . . 59
5.3.1 Problem setting . . . 61
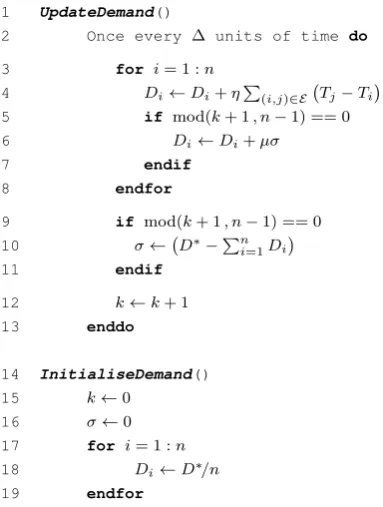
5.3.2 Global Demand and Local Temperature Exchange (GDLTE) . . . 63
5.3.3 Local Demand and Local Temperature Exchange(LDLTE) . . . 65
5.4 Simulation Setup . . . 67
5.5 Simulation Results . . . 72
5.5.1 Simulation 1 . . . 73
5.5.2 Simulation 2 . . . 75
5.5.3 Simulation 3 . . . 77
5.6 Experimental Setup using Real Hardware . . . 78
5.7 Experimental Results . . . 80
5.8 Summary . . . 81
6 Carbon Emissions Control 82 6.1 Abstract . . . 82
6.2 Introduction . . . 82
6.3 Mathematical Preliminaries . . . 83
6.3.1 Problem Formulation . . . 83
6.3.2 Algorithm . . . 84
6.4 Simulation Setup . . . 85
6.5 Simulation Results . . . 89
6.6 Summary . . . 91
7 Unified Global Load Balancing 92 7.1 Abstract . . . 92
7.2 Introduction . . . 92
7.3 Mathematical Preliminaries . . . 93
7.3.1 Problem Formulation . . . 93
7.3.2 Pairwise Partitioning Rule . . . 95
7.4 Analysis . . . 95
7.4.1 Electricity Cost . . . 96
7.4.2 Carbon Emissions . . . 97
7.4.3 Cooling Cost . . . 99
7.5 Simulation Setup . . . 105
7.6 Simulation Results . . . 108
7.6.1 Overall Performance . . . 109
7.6.2 Request Distribution . . . 110
7.6.3 Performance Variance . . . 111
7.6.4 Balanced Performance . . . 113
7.7 Summary . . . 114
8 Conclusions and Future Work 117
List of Tables
2.1 Percentage breakdown of cost of cloud [57]. . . 20
3.1 Mean and Standard deviation of aggregate forwarding rates in C3P and D2R2. . 42
3.2 Jain’s Fairness index [73] for C3P and D2R2. . . 44
7.1 Average round trip time between data centres and sources of requests, carbon
intensity of data centres and sources of requests and daily number of requests at
source . . . 100
7.2 Average Service Request time, Daily Carbon Emission and Number of Requests
List of Figures
2.1 Illustration of a parties involved in public cloud computing and the products and
services that the parties provide. . . 7
2.2 A conventional data centre network architecture. . . 9
2.3 Diagram of raised floor plenum CRAC unit cooling. . . 13
2.4 Example of how sources of requests are partitioned between two data centres. Colour indicates that the node is part of a particular partition and numbers on the edges are weights. . . 22
2.5 Example of how NetScaler functions in a cloud with two data centres. . . 24
2.6 Simple example of DRL. . . 29
3.1 Pseudo Code of C3P [143]. . . 34
3.2 Pseudo Code of D2R2 [143]. . . 36
3.3 Topology of Experiment. . . 39
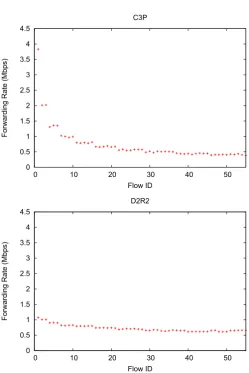
3.4 Forwarding rates achieved by 55 concurrent flows. . . 42
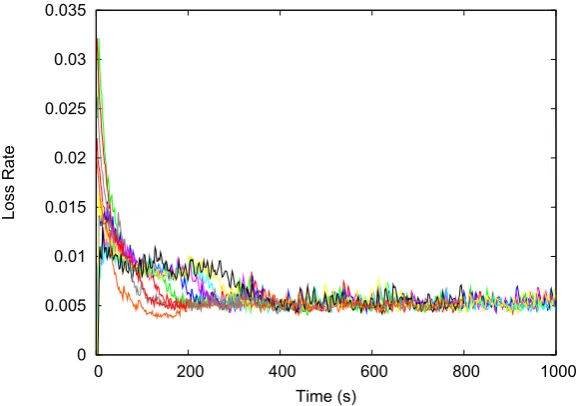
3.5 Loss Rate of C3P. . . 43
3.6 Aggregate forwarding rate during limiter failure withoutgood-neighbours. . . 45
3.7 Loss rates of operating C3P limiters during limiter failure withoutgood-neighbours. 45 3.8 Augment “fair-share” of operating C3P limiters withoutgood-neighbours. . . 46
3.9 Augmented “fair-share” of operating D2R2 limiters during limiter failure with good-neighbours. . . 46
3.10 Loss Rate of C3P limiters during limiter failure with good-neighbours. . . 46
3.11 Aggregate forwarding during failure of limiters withgood-neighbours. . . 47
3.13 Aggregate forwarding rate with varying aggregate capacity. The specified
aggre-gate capacity begins at 40Mbps and changes to 60Mbps at 250s, 15Mbps at 500s
and 30Mbps at 750s. . . 50
3.14 Augmented “fair-share” of D2R2 limiters with changing aggregate capacity. . . . 50
4.1 Pseudo Code of “fair-share” dropping mechanism. . . 54
4.2 Diagram of the experimental setup. . . 55
4.3 The forwarding rates of the individual TCP flows using (a) “fair-share” and (b) token bucket. . . 56
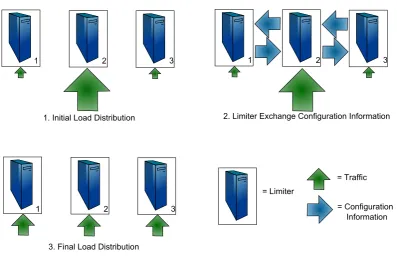
5.1 Illustration of how the thermal management algorithms operate. . . 61
5.2 Pseudocode for GDLTE. . . 65
5.3 Pseudocode for LDLTE. . . 66
5.4 Optional caption for list of figures . . . 68
5.5 Layout of simulation setup. To illustrate the communication graphs used in simulation 3, the dotted lines indicate which other machines the racks 1 and 13 from the left cold aisle can exchange temperature information with. Server racks in adjacent aisles are connected to lower temperature differences between aisles. . 70
5.6 Utility functions. . . 71
5.7 Performance of GDLTE at three demand levels D∗ ={40%,55%,25%}, which are indicated by the dashed line in the top plot, usingη= 0.1,µ= 1/3. . . 73
5.8 Performance of GDLTE with demand varying in a periodic fashion, usingη= 0.1, µ= 1/3. . . 74
5.9 Performance of LDLTE with constant demand of 40%, usingη= 0.1. . . 75
5.10 Performance of LDLTE with a single broken link and constant demand of 40%, usingη= 0.1. . . 76
5.11 η= 13. The temperature of inlets of the server racks at each iteration of LDLTE inside a modular data centre. . . 77
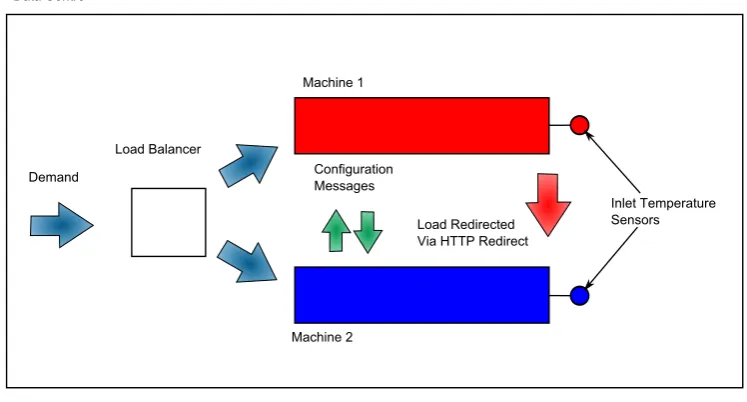
5.12 Diagram for the experimental setup used to evaluate LDLTE. . . 78
5.13 Utility function for machines in experiment. . . 80
5.14 Temperature of machines while LDLTE is operating. . . 81
6.2 Average Job Time with various Demand. . . 86
6.3 Power with various Demand. . . 87
6.4 Overall cost function for different numbers of servers at the two DCs. . . 88
6.5 Close-up of optimal point of overall cost function for different numbers of servers
at the two DCs. . . 88
6.6 Number of servers at the DCs with ak = √k||g1(k)||
2
. The number of servers at
each data centre moves steadily from the initial conditions to the optimal point. 90
6.7 Number of servers at the DCs withak=−
0.1(C(n∗)−C(n))
||g(k)||2+1 . . . 91 7.1 Pseudocode for pairwise partitioning rule . . . 94
7.2 Peak Daily price of electricity for suppliers in the regions of the three data centres
studied. . . 95
7.3 Price of electricity for suppliers in the regions of the three data centres studied. . 96
7.4 Daily peak carbon intensity of electricity supplier in the region of the Ireland
data centre studied. . . 97
7.5 Carbon intensity and generated wind power of electricity supplier in the region
of the Ireland data centre studied. . . 98
7.6 Layout of cooling cost simulations with (a) cold aisle containment and (b) no
cold aisle containment. . . 99
7.7 Typical model of the Coefficient of Performance (COP) curve for a chilled water
CRAC unit. . . 102
7.8 Cooling cost of various data centre cooling systems at various levels of demand . 103
7.9 Latency between California and different geographical regions at fifteen minute
intervals. . . 104
7.10 Latency between Ireland and different geographical regions at fifteen minute
intervals. . . 104
7.11 Latency between Virginia and different geographical regions at fifteen minute
intervals. . . 104
7.12 Diagram of the simulation setup. The colour of the node indicates that the node
is part of a particular partition. . . 105
7.13 Number of requests serviced at each data centre when the “Time Focused”
7.14 Number of requests serviced at each data centre when the “Carbon Focused”
scenario is used. It shows the UTC+0 time zone. . . 110
7.15 Number of requests serviced at each data centre when the “Electricity Focused” scenario is used. It shows the UTC+0 time zone. . . 111
7.16 Carbon Emitted at each time interval under a variety of scenarios. It shows the UTC+0 time zone. . . 112
7.17 Electricity Cost at each time interval under a variety of scenarios. It shows the UTC+0 time zone. . . 113
7.18 Average service request time at each time interval under a variety of scenarios. It shows the UTC+0 time zone. . . 114
7.19 Total carbon output with varying relative price functions. . . 115
7.20 Total electricity cost with varying relative price functions. . . 115
Chapter 1
Introduction
Recently the cloud computing paradigm has become an increasingly popular method for the
delivery of internet services. Of particular interest is the establishment of large public clouds
with data centres in different geographical locations. A cloud service which services a globally
distributed user base and operates in different geographical regions has numerous advantages
such as reduced latency, increased data transmission rates and improved redundancy. The
de-sign of cloud computing architectures gives rise to a number of relatively new research questions
which are the subject of attention in the research community. The objective of this work is to
consider and provide solutions to some of these.
In order to function economically the cloud operator must ensure that cloud users are
receiving a reasonable quality of service (QoS). A basic question is how QoS can be delivered
while at the same time keeping costs low. Tuning knobs which are at the disposal of the designer
include: bandwidth allocation; geographical distribution of load; cooling; and many others, all
of which can be adjusted to keep costs low, subject to meeting a minimum QoS requirement.
Two basic tools which can aid the cloud operator to control the cloud are rate limiting and
load balancing. Rate limiting is the imposition of an artificial limit on the bandwidth of a user.
Rate limiting can be used to offer a fixed cost price for traffic by placing an artificial limit on
the rate of traffic. Load balancing is used to determine how to distribute load across multiple
resources to achieve various goals. In the following chapters we attempt to show how these
tools can be used with mathematical analysis to maintain a reasonable QoS, enforce desirable
pricing schemes and lower operational costs to allow the cloud to function economically.
internet traffic. To do this we consider a recently proposed form of rate limiting known as
dis-tributed rate limiting (DRL) [143]. This is the imposition of an artificial limit on the bandwidth
of users at distributed locations. An algorithm which uses DRL to enforce a fixed-cost traffic
service must fairly distribute the fixed bandwidth to the distributed elements. It should also be
resilient to failure and able to adapt to the dynamic environment of the cloud. Our work details
the experimental evaluation of two DRL algorithms which are Cloud Control Constant
Proba-bilities (C3P) and Distributed Deficit Round Robin (D2R2), thegood-neighbours enhancement
to improve performance in the event of failure and a method for augmenting the performance
of the algorithms with a dynamic bandwidth limit. Rate limiting is also an important concept
in the maintenance of a reasonable QoS inside the data centre. Some clouds are public
environ-ments and as such there is the potential for service interference between users, both malicious
and unintentional. We evaluate the dropping mechanism used in a recent proposed rate
lim-iting algorithm as part of a bandwidth management system to fairly distribute bandwidth to
the flows of cloud users.
In the second part of the thesis we consider how physical operational costs can be lowered
while sustaining a reasonable QoS. Firstly we consider thermal management inside a data centre.
Data centres generate a lot of heat and this must be removed to prevent damage to equipment.
The rate of equipment failure for servers increases as the temperature rises and as such most
data centres attempt to maintain the server inlet temperature below a certain “redline” value
to prevent unnecessary equipment failure. In this context we apply recent results of consensus
algorithms to develop a distributed control algorithm for heat balancing in certain types of data
centres.
In the final part of the thesis we consider electricity costs and carbon costs associated
with data centres. In the context of carbon we develop a subgradient algorithm to minimise a
combination of average service request time (QoS) and carbon emissions with a relative price
function used to reflect the relative importance of the factors to the cloud user. In the context
of electricity cost we develop a geographical load balancing tool based on Voronoi Partitioning
that allocates load, so as to minimise a combination of electricity price, carbon emissions and
1.1
Key Contributions
The most significant contributions of our work are as follows:
• We design, build, and deploy, an implementation of recently proposed DRL algorithms
on a testbed. Some enhancements are also suggested.
• We extend a dropping mechanism in a DRL scheme for use in a data centre network
management system and compare its performance to previously applied schemes.
• We develop and evaluate a distributed algorithm to equalise the temperature of data
centre components while servicing the total demand of the data centre.
• We develop a framework which balances the trade-off between the carbon emissions and
QoS in a distributed manner for application in geographically distributed data centres.
• We detail a model which considers the carbon emissions, electricity price, and time
re-quired for the computational and networking components of a service request. We then
develop a distributed algorithm which minimizes the combination of average request time,
electricity cost and carbon emissions. We present data for the carbon intensity and
elec-tricity price of various geographical regions and experimentally determine the round trip
time between various geographical regions. We evaluate the performance of the distributed
algorithm using the obtained data.
1.2
Disertation Outline
The dissertation is structured as follows.
Chapter 2 presents an overall background on cloud computing, describing the models
which can be employed and the hardware of which the cloud is comprised.
Chapter 3 describes the operation of two DRL algorithms used to offer predictable,
incremental, fixed cost pricing policies, as well as enhancements to ensure their performance in
the dynamic environment of the cloud and in the event of hardware failure.
Chapter 4 details the use of the “fair-share” dropping mechanism for bandwidth
man-agement in data centres.
Chapter 5 reports on the use of implicit consensus algorithms to equalise the temperature
Chapter 6 describes an algorithm to minimise a cost function which represents trade-off
between carbon emissions and average service request time.
Chapter 7 presents the Stratus system which uses Voronoi partitions and a pairwise
partitioning rule to control a number of factors in the operation of cloud.
1.3
Publications arising from this work
• Joseph Doyle, Robert Shorten and Donal O’Mahony. ““Fair-Share” for Fair Bandwidth
Allocation in Cloud Computing”. IEEE Communications Letters, Vol. 16, No. 4, pp
550-553, 2012.
• Joseph Doyle, Florian Knorn, Donal O’Mahony, Robert Shorten. “ Distributed Thermal
Aware Load Balancing for Cooling of Modular Data Centres”. Accepted by IET Journal
of Control Theory and Applications, 2011.
• Joseph Doyle, Robert Shorten, Donal O’Mahony. “Stratus: Load Balancing the Cloud
for Carbon Emissions Control”. Submitted to Elseiver Computer Communications, 2012.
• Joseph Doyle, Donal O’Mahony and Robert Shorten. “Server Selection for Carbon
Emis-sion Control”. In Proceedings of ACM SIGCOMM Workshop on Green Networking, pp
1-6, Toronto, 19 August 2011
• Joseph Doyle, Robert Shorten and Donal O’Mahony.“An experimental evaluation of
dis-tributed rate limiting for cloud computing applications”. In proceedings of ACM ANCS,
Chapter 2
Background
2.1
Introduction
Cloud computing is a new paradigm for the delivery of internet services. It refers to both the
hardware and software used in a data centre to provide a service and the actual program that
delivers the service across the internet. One central idea to a user in cloud computing is that
computational resources are offered as a utility. Resources can be used for a short period of time
and then released. This reduces the need for cloud users to obtain large amounts of capital to
launch internet services as computational resources are paid for on a usage basis. In addition,
it allows users of the cloud to dynamically alter the level of computational resources they are
using to react to the demand for the service, thereby eliminating a large portion of the financial
risk associated with launching an internet service. The owners of the cloud are therefore able
to provide a cheaper service and make a profit due to economies of scale and more efficient use
of resources. In terms of hardware, there are three key aspects to cloud computing [9] namely:
1. An illusion of on-demand infinite resources . A user of the cloud should be able to have
as much computational, networking and storage resources as they desire. A user should
be able to access these resources on-demand so that provisioning plans are not required.
2. The elimination of fixed cost investment in computational resources. This allows users of
the cloud to start with a small amount of resources and increase as their requirements
grow.
storage by the day). Users of the cloud can then use and release the resources as needed
allowing them to save on operational costs. This aspect rewards conservation.
The control of a cloud is challenging task as the cloud owner must adhere to the three key
aspects while also considering other important factors such as latency, fairness among cloud
users, operating costs and the carbon emissions associated with the cloud. When attempting
to achieve these goals an understanding of the limitations of the hardware and the tools that
can be used to control the cloud are necessary.
In the next sections we further elaborate on the operation of the cloud, the hardware
involved, the load balancing and the rate limiting tools used to control the cloud.
In Section 2.2 we discuss the standard model of cloud computing. We then expand upon
this to discuss the varieties of cloud computing that can be found and the manner in which
their models work.
We describe the most common network architecture used in data centres and the problems
that are associated with it in section 2.3. We will then examine proposals which have been
published to tackle the problems associated with traditional data centre architecture and routing
protocols. Cooling is a significant portion of the operational cost of a data centre. Thus we
discuss the various types of cooling hardware and some of the proposals that have been made
to lower cooling costs. We then examine the manner in which cloud users can impinge upon
each other and the security techniques that are required to ensure that cloud users receive a
reasonable Quality of Service (QoS). Finally, we describe the various costs of constructing and
running a data centre so that importance of lowering the operational cost is highlighted.
We discuss the mathematical techniques that our work uses to improve the performance
of the data centre in Section 2.4. Firstly, we detail consensus algorithms and describe some
of the other applications of these techniques. We then examine Voronoi partitions and discuss
some of the other areas in which this technique has been used.
In Section 2.5 we describe the current techniques that are used in load balancing for
this application. We then detail some of the proposals which have been made to improve the
performance of the cloud using load balancing.
We examine the reasons that rate limiting is utilised and some of the techniques used
in rate limiting in section 2.6. We then discuss DRL and various algorithms which are used in
Cloud Based Service Provider
root@webserver root@webserver
root@webserver
Cloud User
Service User
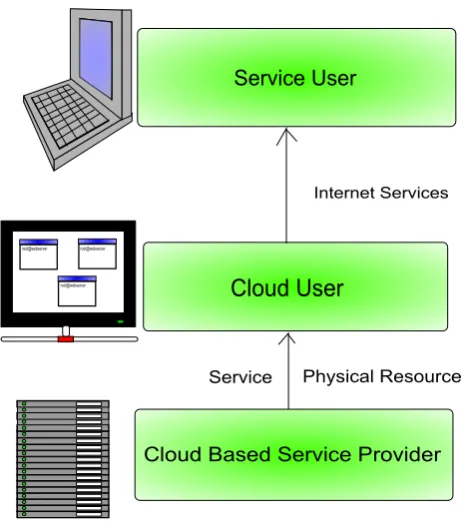
[image:21.595.203.435.111.373.2]Service Physical Resource Internet Services
Figure 2.1: Illustration of a parties involved in public cloud computing and the products and services that the parties provide.
2.2
Cloud Computing
2.2.1
Models
The first thing to consider in the cloud computing paradigm is whether the cloud is public or
private. A public cloud is one where the resource are sold to the general public on a usage
basis. A private cloud is the internal data centre of an organisation or business. In this work
we will deal primarily with public clouds but some of the techniques discussed could equally
be applied to private clouds. In addition, the barriers between public and private clouds are
blurring as some organisations are beginning to use hybrid clouds which consist of at least one
private cloud and at least one public cloud. Usually there are three parties involved in the
public cloud: namely, the cloud based service provider (CBSP), the cloud user and the service
user. The standard cloud service works as follows. A CBSP furnishes the cloud user with the
software and hardware so the cloud user can provide the service user with a particular service.
This is illustrated in Figure 2.1.
Software as a Service (SaaS), (2) Platform as a Service (PaaS) and (3) Infrastructure as a Service
(IaaS). In SaaS a service is hosted on the cloud and it is accessed through an interface, usually
delivered via a web browser. This reduces the complexity of software installation, upgrades,
maintenance, and of patching, as all of these tasks can be handled at a central location with
the overall goal of reducing the total cost of ownership (TCO).
In PaaS the CBSP offers a software platform on which cloud users can build services [140].
Google’s commercial offering (known as “AppEngine” [54]) is an example of PaaS. It is designed
as an engine to execute web services, and as such, the specifics of the hardware are abstracted
from the cloud user. Services must be written in specific languages, but the scaling of the
application is hidden from the user and dealt with by Google. Microsoft’s commercial offering
known as Azure [97] is another PaaS service which can be used to offer web services. This
product offers more freedom when compared with Google’s “AppEngine”. The application can
be written in any language but it must use the Microsoft .NET libraries. The use of a specific
language, or application program interface (API), makes it difficult to migrate services into the
cloud. PaaS, however, allows a greater degree of control than SaaS for the cloud user.
In IaaS the CBSP offers direct access to a Virtual Machine (VM) that is very similar to
physical hardware [140]. Amazon’s Elastic Compute Cloud (EC2) [6] is an example of an IaaS
service. This provides a lot of control to the cloud user at the cost of increased complexity.
For instance an additional tool is required for automatic scaling. This means that without the
use of additional software, a service hosted on EC2 cannot quickly alter the level of resources
(servers, storage etc) to react to a change in the demand. There is a potential problem that a
service could be under-provisioned, or over-provisioned.
2.3
Hardware
One of the focal points of this work is the reduction of operational costs and associated carbon
emissions. The specifics of electricity costs and carbon emissions are very dependant on the
hardware used in the cloud. In this section we will examine the various aspects of cloud
hard-ware that affect the operation of the cloud. We will examine current data centre architectures.
We also examine the limitations of conventional architectures and some new proposed cloud
architectures. Secondly, we will consider the cooling hardware used in data centres.
Internet
CR
AR
AS
S
ToR
Servers
CR
AR
AR
AR
AS
AS
AS
S
S
S
S
S
S
S
S
ToR ToR ToR ToR ToR ToR ToR
Servers
Servers
Servers
Servers
Servers
Servers
Servers
Layer 2 Domain 1 Layer 2 Domain 2
Internet
Data Center
Layer 3
Layer 2
Key
CR = Level 3 Core Router
AR = Level 3 Access Router
AS = Level 2 Aggregate Switch
S = Level 2 Switch
ToR = Top-of-Rack Switch
...
...
[image:23.595.110.544.111.402.2]...
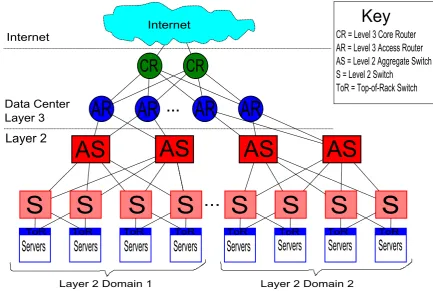
Figure 2.2: A conventional data centre network architecture.
costs. Thirdly, we examine schemes currently used for bandwidth management as bad
man-agement of resources can lower QoS. This could discourage utilisation of the cloud and make it
difficult for cloud operators to recover capital costs.
2.3.1
Data Centre Architecture
In order to provide cloud services the CBSP creates facilities where huge numbers of computers
are concentrated in a single geographical location. There are data centres currently being built
with 400,000 to 500,000 physical servers in a single facility [100]. The size of these facilities
strains the conventional data centre network (DCN) architecture. An examination of data
centre network topology as well as current Routing and Data Link protocols; namely IP, and
Ethernet respectively, shows that several performance problems emerge as the number of servers
in the DCN increases.
The first of these problem is that the most commonly used topology of current DCNs
is such that the interconnective bandwidth between servers is insufficient. This is extremely
the DCN. The conventional topology consists of a tree like network illustrated in Figure 2.2 with
the highest parts of the tree requiring high cost hardware. The data centre network consists
of racks with 20 to 40 servers each connected to a Top of Rack (ToR) switch. ToRs are then
connected to aggregation switches. They are usually connected to more than one for redundancy
purposes. The aggregation switches then connect to access routers. The final connection is
between the access routers and the core routers which control traffic in and out of the data centre
and route traffic between access routers so that all communication is possible. In
all-to-all communication, such as traffic which occurs in MapReduce applications [36], each server
must communicate with every other server in the DCN. When there is insufficient bandwidth
oversubscription occurs. The term oversubscription is used to describe situation when the
desired level of traffic across a link is greater than the level that can be physically sent across
the link. There is no oversubscription in all-to-all communication between servers in the same
rack [58] as there are no bottlenecks for traffic. There can, however, be oversubscription of up
to 1:20 in all-to-all communication between servers using the same aggregate switch on the links
between the ToR switch and the aggregate switch [58]. The level of oversubscription increases
as the traffic moves up the hierarchy where it can reach levels of 1:240 at the paths connecting
to the core routers [58]. This would mean that a server is only obtaining 1
240 of its desired level
of traffic.
Another problem is that Ethernet will not function properly in today’s very large DCNs
for the following reasons:
• Ethernet bridges learn about the network topology by establishing entries for medium
access control (MAC) addresses in forwarding tables. These tables can grow very large.
The number of entries in a table is proportional to the number of hosts in the DCN as
flat addressing is used. By this we mean that each individual address must be stored
in the table with an associated port rather than a range of addresses being associated
with a port. This can result in the network bridges running out of memory and dropping
hosts from the tables. Missing entries give rise to unnecessary broadcasts as the address
resolution protocol (ARP) must be used to determine which port should be utilised.
• Ethernet creates a spanning tree between two network nodes to prevent loops in the
network [122]. This works well for small networks but introduces latency and availability
available on links when selecting a path from a source to a destination. As a result some
paths might be underused and thus bandwidth inefficiencies are introduced. Equal-cost
Multi-path (ECMP) can be used to alleviate these but there can be significant problems
in its deployment in practice [151].
• Other protocols associated with Ethernet such as the ARP and the Dynamic Host
Con-figuration Protocol (DHCP) use broadcasting which cause significant traffic in networks
of this size [76].
These problems can be alleviated somewhat by dividing the DCN into IP subnets and
thus achieving scale by assigning each server an IP addresses based on this logical topology.
The DCN is divided into smaller networks that are connected together to avoid the problem
of scale. VMs which are software implementations of physical machines are now being used
in some data centres. The use of virtualisation technology creates a problem with the subnet
division approach as virtual machines cannot migrate out of their original IP subnet while
maintaining the same IP address. VM Migration, which is the movement of a VM to a different
physical machine, can be viewed as a form of load balancing and consequently the subnet
division approach is somewhat limited as it constrains how load can be dynamically shared.
Further, the setup and maintenance of the subnets can be a long and laborious task. This is
sometimes referred to as the “Ethernet scaling” problem as the performance of Ethernet will
not scale to the number of hosts required in a large DCN.
Thirdly, there is nothing to prevent one service inflicting damage on other services which
share the same resources in a DCN. Users can attempt to consume all the bandwidth on shared
resources and current data centre architectures do not have a mechanism to prevent this [58].
This is referred to as the “Traffic flood” problem.
Lastly, the cost of the most oversubscribed parts of the DCN tree accounts for a large
portion of the cost of the DCN networking equipment. The reason for the high cost is that
these switches use highly specialised application specific integrated circuit (ASIC) hardware
with high development costs.
There have been a number of proposals to counteract the problems associated with
con-ventional data centre architecture and routing protocols [3, 58, 63, 62, 76, 107, 59, 48] and it is
these new architectures and associated protocols is advantageous in large data centre
manage-ment as any new control schemes implemanage-mented will have to adapt to these new architectures
and protocols to be useful in the near future.
2.3.2
Cooling
Cooling is crucial to the operation of a data centre and can represent a significant operational
cost to the cloud operator. Insufficient cooling can result in equipment failure which will lead to
further expense for the cloud operators. It has been reported that every 10◦C increase above 21◦C decreases the long-term reliability of electronics by 50% [148, 120]. In addition, it has been shown that a 15◦C rise increases the failure rates of hard disk drives by a factor of two [7], although recent studies suggest that the increase in the rate of failure may not be as severe
as this [42]. To prevent equipment damage, the inlets of all servers in the data centre must be
maintained in a safe operating range below the “redline” value of approximately 25◦C. There
is considerable debate over what exactly this “redline” value should be [11] as some proponents
suggest it should be considerably higher than current guidelines. The fact remains that there
is an upper limit to the safe operating range for the temperature of inlets to servers.
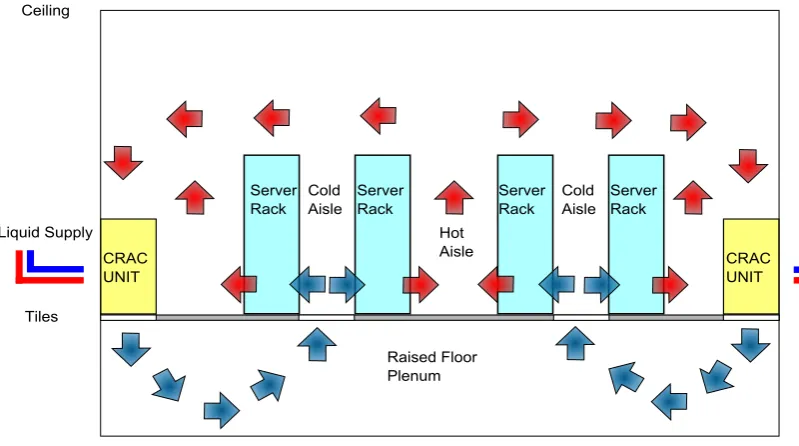
Cooling systems take a number of forms. The most popular is the use of computer room
air conditioning (CRAC) units and a raised floor plenum. In this system cold air is blown into
the plenum by CRAC units pressurising the plenum. Cold air exits through perforated tiles
that are placed in front of server racks. The cold air then flows through the server cooling the
components. As the cold air passes through the server it is warmed. This warm air exits the
back of the server where it is recirculated back to the intakes of the CRAC unit to cool the air.
The cycle then repeats. This is illustrated in Figure 2.3. Each CRAC unit consists of a number
of coils through which liquid coolant is pushed and a fan which pushes air through the coils
cooling the air. A pump circulates the coolant to a chiller which removes the heat from the
coolant so that the supply temperature of the CRAC unit is maintained at a constant level.
In this setup some of the hot air generated from the server outlets can mix with the cold
air from the CRAC units which causes complex air flow patterns leading to hotspots. This is
problematic as it requires the entire data centre be cooled sufficiently to prevent equipment
damage at the hotspots. This leads to a large portion of the data centre being over-cooled. A
variation of the previous system known as aisle containment is used to alleviate some of these
CRAC UNIT
CRAC UNIT Server
Rack
Server Rack
Server Rack
Server Rack
Raised Floor Plenum Tiles
Ceiling
Liquid Supply
Cold Aisle
Cold Aisle Hot
[image:27.595.114.514.111.334.2]Aisle
Figure 2.3: Diagram of raised floor plenum CRAC unit cooling.
the data centre which prevents the airflows from mixing and consequently prevents hot spots.
The containment is constructed using physical barriers such as PVC curtains and Plexiglas [17].
There are two main variations of aisle containment namely “hot aisle containment” and “cold
aisle containment”. There is evidence that “hot aisle containment” may be a more efficient
design but it is recognised [121] that there are difficulties in retrofitting this solution which may
make “cold aisle containment” the more popular design in the short-term. In the models we
use in Chapters 5 and 7, we examine how the variation in cooling systems affect the cooling
costs.
Another variation is the use of air economizers instead of CRAC units [12, 17] or “Free Air
Cooling”. Air economizers draw in cool air from outside the data centre and expel hot air from
the servers back into the environment. It is also possible to use “Water-based Free Cooling”.
In this case the coolant supplied to the CRAC units also runs through a heat exchanger where
water absorbs heat from the coolant. Both of these methods depend on the ambient temperature
being sufficiently cold so that the supply temperature of the air entering the inlet of the servers
is below the “redline” value. In addition “Water-based Free Cooling” is difficult to use in very
cold climates as additional steps must be taken to prevent the formation of ice on the storage
towers. “Free Air Cooling” on has been shown to function for extended periods of time at
by CRAC units and chillers if there is a chance that the ambient temperature will exceed the
“redline” value as the data centre cannot operate without cooling for more than a few minutes.
While it is possible to redirect load to another data centre and shutdown the data centre during
peaks of ambient temperature this is a challenging prospect for most cloud operators.
Liquid based cooling [130, 5] can also be used to provide cooling for data centres. In this
method a heat exchanger is typically attached to the back of the rack so that hot air from the
server outlet flows over coils that are cooled by water. Essentially this method involves placing
a small heat exchanger at the back of each server rack. This form of cooling can be used as the
only source of cooling or in conjunction with the larger CRACs where only some of the heat is
removed by the liquid based cooling solution. In the former case it must completely remove all
the heat from the server outlets and thereby replace the large CRACs. In addition, it is also
possible to liquid cool the Central Processing Unit (CPU) directly and greater efficiencies can
be achieved through this method [130]. All forms of liquid cooling increase the cost of plumbing
as coolant must be brought to each rack and cause concern over the risk of leaks.
In additional to hardware, software can also have a large effect on cooling costs. There
has been some recent research which quantify this effect and we will examine their work in
further detail here. Sharmaet al. [134] presents an algorithm to lower the difference between
the outlet temperature of the server racks to prevent hot spots. This was done by adjusting the
power that the server rack consumes (by adjusting the number of requests the server services)
so that it is inversely proportional to the difference between the exhaust temperature and a
reference temperature (i.e. the supply temperature of the air). This techniques results in server
racks with hot exhausts being given less work which will cool the exhaust of these servers and
prevent hot spots.
Moore et al. [103] use a calibration phase to determine which server racks cause the
most recirculation. In this calibration phase the power consumed by the servers and cooling
equipment is recorded. The power for a pod (a group of servers) is adjusted and the power
consumed by the servers and cooling equipment is recorded. This is repeated for each server
rack. A Heat Recirculation Factor (HRF) is then calculated for each server. The HRF is then
used to determine where to assign load to minimise the cooling costs. Moore et al. [102] also
propose a method for determining the temperature of a server inlet without a sensor to allow
this software to function without further instrumentation.
the power state of the servers and assignment of jobs to servers as a Markov decision process
(MDP) with the goal of minimising the integrated weighted sum of the power consumption
and computational performance . The power states of the servers can be adjusted using the
TEAPC [155] system. Paroliniet al. also consider the problem of excessive cooling as a cyber
physical problem [117]. These problems consider cyber resources (the computational resources)
and physical resources (the cooling resources) which are joined via a network model. A control
strategy to lower cooling costs while considering load distribution is also presented.
Weisselet al. propose a system which determines the temperature of servers using
infor-mation from event monitors which are embedded in modern processors and throttles requests
to meet the thermal requirements of the system [161]. Das et al. consider controlling the fan
speed of CRAC units in order to control a utility function which incorporates the energy
con-sumed and the temperature of the inlets of the rack servers [35]. There are also a number of
tools [28, 67, 34] which have been proposed to simulate the performance of these algorithms
and examine how the layout of a room affects the temperature of the inlets of servers. Heath
et al. propose the Freon tool to prevents equipment damage by shutting off hot servers in the
event that they cross the “redline” value [67]. Farazet al. [47] considers a combination of the
cooling power for CRAC units and the idle and dynamic power of servers in a load balancing
scheme to lower overall energy costs.
2.3.3
Bandwidth Management
A public cloud is an environment where resources are shared by multiple users. If these resources
are not carefully managed, service interference (both malicious and unintentional) can occur
between cloud users. Service interference is already affecting cloud users on current clouds.
The throughput of mediuminstances on Amazon’s EC2 can vary by 66% [87, 159] and it has
been postulated, based on anecdotal evidence, that the cause of this is a lack of bandwidth
management algorithms between users [136].
There are numerous techniques for the control and management of computational,
mem-ory and disk resources [27, 61]. It is, however, generally accepted that current techniques for
network management cannot prevent “service interference”. We define “service interference” as
the actions of one user on the cloud negatively affecting another user. One of the most widely
deployed network management techniques is Transmission Control Protocol (TCP) congestion
other functions. It manages the bandwidth of all flows passing through networking equipment.
A malicious user can circumvent this to prevent the “fair” allocation of network resources and
cause “service interference” by using non-compliant protocol implementations or by opening
more flows than normal. For example, attacks could be carried out that are similar to Denial
of Service (DoS) by malicious users. By seeking out a server on the same switch as the server
they wish to attack, flooding the link with traffic thereby blocking traffic from other sources,
malicious users can carry out attacks on victim’s servers. This attack is difficult to detect as
no traffic is sent to the victim’s server.
The utilisation of non-compliant protocol implementations can be defined as
manipula-tion attacks [80]. The aim of these attacks is to improve the performance experienced by a
malicious user to the detriment of honest users. There are a variety of manipulation attacks
which can be employed. Three of these attacks are described by Savage et al. [131]. The first
type is ACK division. In this attack the receiver of a data segment of N bytes divides the
resulting acknowledgements intoM acknowledgements, whereM ≤N. Each acknowledgement
is a distinct piece of the received data segment. The congestion window increases in size upon
receipt of an acknowledgement and ACK division results in the sender growing their congestion
window at a rate that isM times faster than usual and the congestion window of honest users
is smaller as packet loss occurs faster than normal. M can be set to an arbitrary level by
the receiver up to one acknowledgement per byte received (M =N) allowing the congestion
window to grow extremely quickly.
The second type of attack is DupACK spoofing. Some TCP congestion control algorithms
such as TCP Reno [81] usefast retransmit. Fast retransmit is used to retransmit the missing
segment only if loss is detected. Thus, everything from the last correctly received packet
does not have to be retransmitted. When a TCP receiver acknowledges a packet it sends the
sequence number of the package it expects to receive. If it receives a packet with a different
sequence number it sends a duplicate acknowledgement requesting the correct packet again.
Loss is detected by observing three duplicate acknowledgements. Fast retransmit operates
by controlling the congestion windows. Upon detection of loss the control window is set to
the threshold of the congestion avoidance stage plus three times the maximum segment size.
Fast retransmit then increases the congestion window by the maximum segment size for each
additional acknowledgement packet received. The DupACK spoofing attack exploits this by
of a data segment thereby artificially increasing the congestion window. This attack allows the
receiver to dictate the speed at which the sender transmits as the rate at which the receiver
sends acknowledgements is direct proportional to this.
The final type of attack described by Savageet al. [131] is optimistic ACKing. In this
attack the receiver acknowledges data it has not yet received. Normally the growth of the
TCP congestion window is dictated by the round trip between the sender and the receiver. The
receiver emulates a shorter round-trip time and increases the data transfer rate by optimistically
acknowledging data it has not received. This attack allows the receiver to increase the congestion
window to the bottleneck rate immediately and hold it there in spite of losses. It can then use
other application layer retransmissions available in the HTTP-1.1 protocol [50] to obtain lost
segments. These attacks are detrimental to honest users as the sum of the rates can be no
greater than the limits of the physical medium and if one flow rate is disproportionately large,
segments from other flows will be dropped earlier and their transfer rate will be less than it
should be.
There have been a number of proposals to prevent manipulation attacks which we will
discuss here. One of these by Shieh et al. at Microsoft Research is Seawall [136]. In this
system local entities (VMs, processes, etc) are assigned a network weight and each local entity
receives a share of the bandwidth proportional to its network weight along all network links.
The network weight functions as a metric for the priority rating of the traffic of the local entity.
A local entity with a higher network weight will obtain a greater bandwidth. The Seawall
system uses a rate limiting tool known as token bucket to ensure that each local entity obtains
a fair allocation of bandwidth.
Another proposal is Gatekeeper [128] by Rodrigueset al.. It is similar to Seawall but in
Gatekeeper the bandwidth of a link is divided among the tenants of the link rather than among
local entities which wish to send traffic across the link. We define the tenants of a switch as
the servers which are connected to the switch by a single link. A local entity can be anywhere
in the data centre while a tenant must be connected to a switch by a single link. Gatekeeper
divides bandwidth among tenants rather than local entities so that it prevents users with a
large number of VMs in the cloud from obtaining an unfair proportion of the bandwidth by
having a large number of servers send data to a specific tenant on a switch.
Wilsonet al. proposed theD3 system [166]. In this proposal deadlines are assigned to
level agreement (SLA) would be given a deadline. The rate required to reach the deadline
is calculated by the sender and this is sent with the packets. A greedy algorithm is used by
switches to assign rates to the flows. The router will also divide any remaining bandwidth fairly
among the flows. In the event that the router does not have enough bandwidth available to
meet a deadline it assigns all that remains to the request when the next flow is received.
Ghowdhury et al. proposed a system called Orchestra [29]. In this, the operation of
MapReduce [36] and similar systems is improved by considering the length of data transfer and
assigning more TCP connections to longer data transfers. In doing this all transfers complete
simultaneously. Another proposal is Oktopus by Ballani et al. [16]. In this system a greedy
algorithm is used to attempt to find the smallest number of links required to form a virtual
network ofN nodes with bandwidth B connecting all the nodes in a tree structure. Kothari
et al. proposed a tool which examines a protocol implementation to check if it is vulnerable to
manipulation attacks [80].
There are a number of ways non-compliant protocols can be used to exploit the underlying
hardware and obtain an unfair share of bandwidth. There have also been a number of proposals
to prevent this. Each of these proposals is designed to prevent a specific type of “service
interference” and each has its advantages. For example Orchestra is particularly useful if
MapReduce type applications are the focus of the cloud while it is not as strong if content
delivery is the focus. Some of these programs will use dropping mechanisms to ensure a fair
share of bandwidth is received by users. It is important that the dropping mechanism used
also ensure that the fair share of bandwidth is divided reasonably among the flows that use
this share. In Chapter 4 we will propose a mechanism which builds upon the Seawall system
[136] by ensuring fairness between the flows of the local entities and lowering the overhead cost
associated with the system.
2.3.4
Data Centre Costs
Throughout this work we propose algorithms which lower the operational costs and increase the
utilisation of the cloud. In this section the breakdown of the cost of the cloud will be examined.
We will illustrate the importance of optimising the operational cost of the cloud so owners can
recover their capital investment. Greenberg et al. present such a breakdown [57]. The first
interesting thing to note about this breakdown is that operational staff costs are so low (<5%
enterprises [57]. The breakdown assumes that the cloud consists of a data centre with 50,000
servers. Each server costs $3,000. At a 5% cost of money and a 3 year amortisation regime
servers have an annual cost of $52.5 million dollars. The data centre requires facilities for power
delivery and evacuating heat. This requires investment in large scale generators, transformers,
uninterruptible power supply (UPS) systems and cooling equipment. The breakdown assumes
a cost of $200 million for these facilities. At a 5% cost of money and a 15 year amortisation
regime the facilities have an annual cost of $18.4 million. The capital cost of networking is
significant as a large number of switches, routers and load balancers need to be purchased for
the data centre network to function effectively. In addition to the capital expenditure, there
are additional networking costs such as peering where traffic is handed off to internet service
providers (ISPs), inter-data centre links which carry traffic between geographically distributed
data centres and regional facilities needed to reach wide area network interconnection sites.
These costs are difficult to calculate as they vary from site to site and with time, but we
can assume an annual networking cost of approximately $9.3 million [57]. This includes the
amortised cost of the capital equipment such as switches, routers and load balancers.
Finally a cloud needs power to operate. A metric to describe the total power required
for the facility is the relation between the power required for the faculty and power required
for the IT equipment is provided by the Green Grid [56]. Power Usage Efficiency (PUE) is
calculated as (Total Facility Power)/(IT Equipment Usage). The PUE of inefficient enterprise
facilities ranges from 2.0 to 3.0 [152]. A state of the art facility typically attains a PUE of∼1.7
and leading facilities such as Facebook data centres can obtain a PUE of 1.08 as of 2012 [44].
To estimate the cost of power the breakdown we assume a PUE of 1.7, a reasonable electricity
price of $.07/kWh and that each server draws an average of 180 W. This results in an annual
electricity cost of $9.3 million which coincidentally is the same as the network cost.
The percentage breakdown of the cost of the cloud is depicted in Table 2.1. From this
breakdown we can establish that the greatest cost is the capital cost of the servers. This
illustrates the need to encourage utilisation as substantial revenue must be obtained to recover
the capital investment. There are high capital costs that need to be covered and running costs
are relatively low as servers have a high idle power which is between 60% and 75% of the peak
power [25, 45]. Owners are therefore motivated to keep the system running in order to generate
Component Annual Cost over Lifetime
Servers ∼45%
Infrastructure ∼25%
Network ∼15%
Power ∼15%
Table 2.1: Percentage breakdown of cost of cloud [57].
2.4
Applicable Theory
In this section we discuss the mathematical techniques we will use to control the operation of
the cloud. In the Section 2.4.1 we examine various consensus algorithm and how they are used.
In Section 2.4.2 we examine Voronoi partitions and the applications of this technique.
2.4.1
Consensus Algorithms
We use two types of consensus algorithms and the particulars of the systems are described in
Chapters 3 and 5. In consensus algorithms a group of distributed nodes attempt to reach a
common goal by exchanging information with their neighbouring nodes and adjusting their state
according to an algorithm. This can be represented as a graph where edges exist between nodes
if the nodes exchange information. Consensus and agreement algorithms were first examined
in the context of management science and statistics [41, 108, 167, 37]. While they have been
applied in a number of disciplines such as the fusion of sensor data [92, 20, 43, 114], medicine
[162], decentralised estimation [85, 106, 111], simulation of flocking behaviour [127, 158] and
clock synchronisation [132, 24], it is the application of these ideas to dynamic networked systems
that is of primary interest to us.
The initial work in this area [22, 154, 127, 158] had a variety of goals and focused on
a system in which bi-directional information exchange between neighbouring nodes occured
(leading to undirected communication graphs). Rigourous convergence proofs for such systems
were given in [71]. This work was then extended to consider variations on these problems which
include whether the topology of the graph representing node communication remains fixed or
changes over time, whether there are delays in the information exchange and if all nodes update
in a synchronous fashion or if nodes update at their own pace. Other variation include if the
graph is directed or undirected, if the node’s state is scalar or multidimensional, whether the
node can manipulate the state directly or only implicitly and if the node can manipulate the
directed communication graphs is examined in [19, 113, 104, 126, 46]. The effect of asynchronous
updates, where each node does not have to update its state at the same time, is examined in
[113, 66, 21, 46, 23]. A changing graph topology is considered in [71, 149, 19, 126, 110].
Generalisations of the problem which allow the inclusion of node dynamics in the consensus
problem are investigated in [150, 149, 112, 110]. A system where the state of a node can only
be changed implicitly is examined in [143, 144]. In Chapters 3 and 5 we examine the use of
such algorithms in the context of controlling the resources of the cloud.
In addition to this work, which focuses on unconstrained consensus applications, there
has been much research in applications of consensus to systems which should fulfil external
conditions. By this it is meant that the goal the distributed nodes are attempting to achieve
is constrained in some way. An example of such a system can be found in behaviour based
animation. A group of nodes (birds in a flock) should have a common heading and the heading
must also be in a particular direction. There are three approaches which are usually taken in
such a system namely, leader-following [160, 96, 137, 49, 74], virtual structure based [86, 18, 135]
and behaviour based [14, 8, 82, 115, 26, 157]. In the leader-following approach one of the nodes
is designated the “leader” node and other nodes adjust their state to follow this “leader” node.
In the virtual structure based method the graph of nodes is treated as a single structure and the
desired behaviour is assigned to the virtual structure relative to each node which controls its
own behaviour. In the behaviour approach the node’s behaviour is based on a combination (e.g.
weighted sum) of desired behaviours. In Chapter 5 we investigate the application of a behaviour
based consensus algorithm [77] to the thermal management of the data centres that contain
cloud resources. Consensus algorithms can be used to represent a large variety of systems and
the related work described in this section allows us to analyse the various systems described in
Chapters 3 and 5.
2.4.2
Voronoi Paritions
Voronoi partitions are the decomposition of a set of points into subsets. These subsets are
centred around points known as sites, generators or seeds. Each point in the set is added to
a subset consisting of a site and all other points associated with this site. An abstract notion
of distance between a point and the sites is used to determine with which subset a point is
associated. A point is assigned to a subset if the distance to the site is less than or equal to
Legend
1
1 2 1
2
2 2
2
2 1
1
2
1 1
1 1
1
1
= Source of Requests = Data Centre
Figure 2.4: Example of how sources of requests are partitioned between two data centres. Colour indicates that the node is part of a particular partition and numbers on the edges are weights.
for cloud services and data centres which service these. Voronoi partitions are then used to
determine where requests are serviced. A subset represents which sources of requests a data
centre is servicing at a given time. An example of a group of sources of requests which have been
partitioned between two data centres can be seen in Figure 2.4. In this figure each source of
requests has a path to both data centres. The partition that the source of requests is a part of,
depends on the paths to the two data centres. The partitions are made up of sources of requests,
which have paths available to them with lower distances than the paths available to the other
data centre. Voronoi partitions also known as Voronoi Diagrams or Dirichlet tessellations, are
used in a variety of areas. While there was some early work in Voronoi diagrams by Gauss
[13] and Dirichlet [13] which used quadratic forms, the generalization to higher dimensions was
provided by Voronoi [13] in 1908. The earliest application of Voronoi partitions was in the fields
of crystallography and more specifically geometric crystallography [13, 129]. It has also been
applied to metallurgy [165, 51], precipitation estimation [153, 69], urban planning [13, 138],
cartography [10] and recently robotics [39] (other applications are discussed in [13]).
Voronoi diagrams also have a number of applications in the field of computer science.
Shamos [133] proposed applying Voronoi diagrams to the associative file searching problem (or
post-office problem) [78]. The goal in the problem, given a subset of points, is to find the closest
of these to a given query point. This is analogous to determining which partition the query
which dividing the data into subsets which have similar in-class members and dissimilar
cross-class member [65]. Voronoi partitions can also be used in scheduling record access to retrieve a
batch of records in the minimum time. An exact solution has been shown to be NP-complete but
a satisfactory approximation can be obtained quickly using Voronoi diagrams [83]. In Chapter
7 we use Voronoi partitions to control various aspects of the operation of the cloud.
2.5
Load Balancing
The final area in this chapter concerns the tools which cloud operators can use to control the
operation of the cloud. The goal of these sections is to examine the state-of-the-art in control
technology so that it can be compared with our work. Load balancing is the distribution of a
workload among multiple resources to achieve various goals. It is a critical tool in the operation
of the cloud and our work in Chapters 5, 6 and 7 are forms of load balancing. In this section
we examine the current schemes available to a commercial load balancer and recent proposals
which have been made to use load balancing to achieve new goals such as lower electricity cost
or carbon emissions.
2.5.1
Current Methods
We will now examine the capabilities of a popular commercial load balancer known as the Citrix
NetScaler [31] to investigate the options available to a state-of-the-art load balancing system.
This service is capable of balancing load at the local level, where it assigns connections to servers
in a data centre, and also at the global level, where it assigns connections to data centres in the
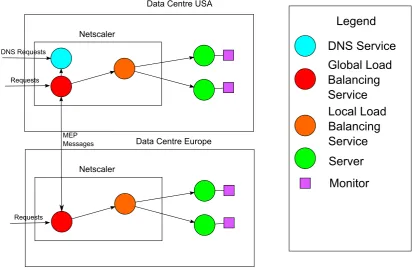
cloud. Firstly, we examine the overall operation of the NetScaler. This is depicted in Figure
2.5. Clients request services which generate Domain Name System (DNS) requests if their local
DNS does not contain a record of the service. The NetScaler can function as a DNS server
and responds to the request. The response is controlled by the global load balancing service
which exchanges metrics with other NetScalers via the proprietary metrics exchange protocol
(MEP). A request is then generated by the client and sent to the assigned data centre. This
request is sometimes recorded by the global load balancing service so that metrics are updated
and is forwarded to the local load balancing where it is recorded and sent to a server. Monitor
programs sometimes examine various aspects of the server and send this information to the
DNS Service
Global Load
Balancing
Service
Local Load
Balancing
Service
Server
Monitor
Legend
DNS Requests
Requests
Requests
Data Centre USA
Data Centre Europe Netscaler
Netscaler
[image:38.595.112.525.112.382.2]MEP Messages
Figure 2.5: Example of how NetScaler functions in a cloud with two data centres.
Next we examine the load balancing mechanisms which are available at the local level.
Least Connection Method: In this method connections are sent to the servers with the
smallest numbers of active connections. The NetScaler maintains a record of the number
of active connections at each server and alters this as connections are opened or closed.
This method can be modified with weights so that more powerful servers receive more
connections.
Round Robin Method: This is the simplest method of load balancing and it is frequently
used by other load balancing methods if the metric used is tied between two servers or
when the NetScaler is starting operation. Servers are ordered in a list and a pointer which
starts at the top of the list is used to determine which server an incoming connection will
be sent to. After the incoming connection is sent the pointer is moved to the next server
in the list and the process continues. If the pointer reaches the end of the list, it returns
to the start of the list. This method can also be modified with weights.
Least Response Time Method: This method uses a combination of the response time and