A Generative Model for User Simulation in a Spatial Navigation Domain
Aciel Eshky1, Ben Allison2, Subramanian Ramamoorthy1, and Mark Steedman1 1School of Informatics, University of Edinburgh, UK
2Actual Analytics Ltd., Edinburgh, UK
{a.eshky,s.ramamoorthy,steedman}@ed.ac.uk [email protected]
Abstract
We propose the use of a generative model to simulate user behaviour in a novel task-oriented dialog domain, where user goals are spatial routes across artificial land-scapes. We show how to derive an effi-cient feature-based representation of spa-tial goals, admitting exact inference and generalising to new routes. The use of a generative model allows us to capture a range of plausible behaviour given the same underlying goal. We evaluate intrin-sically using held-out probability and per-plexity, and find a substantial reduction in uncertainty brought by our spatial repre-sentation. We evaluate extrinsically in a human judgement task and find that our model’s behaviour does not differ signif-icantly from the behaviour of real users.
1 Introduction
Automated dialog management is an area of re-search that has undergone rapid advancement in the last decade. The driving force of this innova-tion has been the rise of the statistical paradigm for monitoring dialog state, reasoning about the effects of possible dialog moves, and planning fu-ture actions (Young et al., 2013). Statistical di-alog management treats conversations as Markov Decision Processes, where dialog moves are as-sociated with a utility, estimated online by inter-acting with a simulated user (Levin et al., 1998; Roy et al., 2000; Singh et al., 2002; Williams and Young, 2007; Henderson and Lemon, 2008). Slot-filling domains have been the subject of most of this research, with the exception of work on trou-bleshooting domains (Williams, 2007) and rela-tional domains (Lison, 2013).
Although navigational dialogs have received much attention in studies of human conversational
behaviour (Anderson et al., 1991; Thompson et al., 1993; Reitter and Moore, 2007), they have not been the subject of statistical dialog management research, and existing systems addressing naviga-tional domains remain largely hand crafted (Ja-narthanam et al., 2013). Navigational domains present an interesting challenge, due to the dispar-ity between the spatial goals and their grounding as utterances. This disparity renders much of the statistical management literature inapplicable. In this paper, we address this deficiency.
We focus on the task of simulating user be-haviour, both because of the important role sim-ulators plays in the induction of dialog managers, and because it provides a self-contained means of developing the domain representations which fa-cilitate dialog reasoning. We show how a genera-tive model of user behaviour can be induced from data, alleviating the manual effort typically in-volved in the development of simulators, and pro-viding an elegant mechanism for reproducing the natural variability observed in human behaviour.
1.1 Spatial Goals of Users
Users in task-oriented domains are goal-directed, with a persistent notion of what they wish to ac-complish from the dialog. In slot-filling domains, goals are comprised of a group of categorical tities, represented as slot-value pairs. These en-tities can be placed directly into the user’s utter-ance. For example, in a flight booking domain, if a user’s goal is to fly to London from New York on the 3rd of November, then the goal takes the
form: {origin=“New York”, dest=“London”, de-part date=“03-11-13”}, and expressing the desti-nation takes the form:Providedest=“London”.
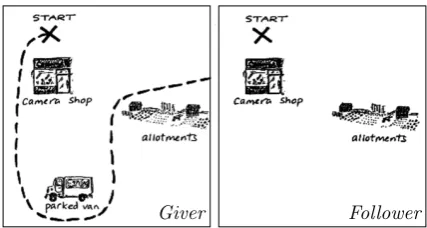
In contrast, consider the task of navigating somebody across a landscape. Figure 1 shows a pair of maps taken from a spatial navigation do-main, the Map Task. Because the Giver aims to communicate their route, one can view the route
Natural Language Semantic Representation G: you are above the camera shop InstructPOSITION(ABOVE, LM)
F: yeah Acknowledge
G: go left jus– just to the side of the paper,? InstructMOVE(TO, PAGE LEFT)?
then south, InstructMOVE(TOWARDS, ABSOLUTE SOUTH)
under the parked van InstructMOVE(UNDER, LM)
you have a parked van? Query-yn
F: a parked van no Reply-n
G: you go– you just go west,? ClarifyMOVE(TOWARDS, ABSOLUTE WEST)?
and down, ClarifyMOVE(TOWARDS, ABSOLUTE SOUTH)
and then you go along to the– you go east ClarifyMOVE(TOWARDS, ABSOLUTE EAST)
F: south then east Check
[image:2.595.77.520.62.243.2]G: yeah Reply-y
Table 1: A Giver (G) and a Follower (F) alternating turns in a dialog concerning the maps in Figure 1. The utterances are shown in natural language (left), and the semantic equivalent (right), which is com-posed ofDialog Actsand SEMANTICUNITS. Utterances marked?demonstrate a plausible variability in expressing the same part of the route on the Giver’s map, and similarly those marked. We model the Giver’s behaviour, conditioned on the Follower’s, at the semantic level.
as the Giver’s goal for the dialog. However, unlike goals in slot-filling domains, it is unclear whether the route can be represented categorically in a form that would allow the giver to communicate it by placing it directly into an utterance. As raw data, a specific route is represented numerically as a series of pixel coordinates. Before modelling in-terlocutors in this domain, we must derive a mean-ingful representation for the spatial goals, and then devise a mechanism that takes us from the spatial goals to the utterances which express them.
1.2 Utterance Variability for the Same Goal
In addition to making sensible utterances, a con-cern for user simulation is providing plausible variability in utterances, to provide dialog man-agers with realistic training scenarios. Consider the dialog in Table 1, resulting from the maps in Figure 1. Utterances marked?(and similarly those marked ) illustrate how the same route can be described in different ways, not only at the natu-ral language level, but also at the semantic level1.
A model providing a 1-to-1 mapping from spatial routes to semantic utterances would fail to capture this phenomenon. Instead, we need to be able to account for plausible variability in expressing the underlying spatial route as semantic utterances.
1Route descriptor TOWARDSindicates a movement in the
direction of the referent ABSWEST, whereas TOindicates a movement until the referent is reached.
Giver Follower
Figure 1: In the Map Task, the instruction Giver’s task is to communicate a route to a Follower, whose map may differ. The route can be seen as the Giver’s goal which the Follower tries to infer. A corresponding dialog is shown in Table 1.
1.3 Overview of Approach
In order to perform efficient reasoning, we pro-pose a new feature-based representation of spatial goals, transforming them from coordinate space to a low-dimensional feature space. This groups sim-ilar routes together intelligently, permitting exact inference, and generalising to new routes. To ad-dress the problem of variability of utterances given the same underlying route, we learn a distribution over possible utterances given the feature vector derived from a route, with probability proportional to the plausibility of the utterance.
[image:2.595.309.523.339.453.2]evalu-ations to validate our model. We first use intrinsic information theoretic measures, which compute the extent of the reduction in uncertainty brought by our feature-based representation of the spatial goals. We then evaluate extrinsically by gener-ating utterances from our model, and comparing them to held-out utterance of real humans in the test data. We also utilise human judgements for the task, where the judges score the output of the different models and the human utterances based on their suitability to a particular route.
2 Related Work
2.1 Related Work on the Map Task
To our knowledge, there are no attempts to model instruction Givers as users in the Map Task do-main. Two studies model the Follower, in the con-text of understanding natural language instructions and interpreting them by drawing a route (Levit and Roy, 2007; Vogel and Jurafsky, 2010). Both studies exclude dialog from their modelling. Al-though their work is not directly comparable to ours, they provide a corpus suitable for our task.
2.2 Related Work on User Simulation
Early user simulation techniques are based on N-grams (Eckert et al., 1997; Levin and Pieraccini, 2000; Georgila et al., 2005; Georgila et al., 2006), ensuring that simulator responses to a machine ut-terance are sensible locally. However, they do not enforce user consistency throughout the dialog.
Deterministic simulators with trainable parame-ters mitigate the lack of consistency using rules in conjunction with explicit goals or agendas (Schef-fler and Young, 2002; Rieser and Lemon, 2006; Pietquin, 2006; Ai and Litman, 2007; Schatzmann and Young, 2009). However, they require large amounts of hand crafting and restrict the variabil-ity in user responses, which by extension restricts the access of the dialog manager to potentially in-teresting states. An alternative approach to dealing with the lack of consistency is to extend N-grams to explicitly model user goals and condition utter-ances on them (Pietquin, 2004; Cuay´ahuitl et al., 2005; Pietquin and Dutoit, 2006; Rossignol et al., 2010; Rossignol et al., 2011; Eshky et al., 2012).
3 The Model
Our task is to model the Giver’s utterances in re-sponse to the Follower’s, at the semantic level. A
Giver’s utterance takes the form:
g=Instruct, u=MOVE(UNDER,LM) consisting of a dialog actgand a semantic unitu2.
Aligned withu, is an ordered set of waypointsW, corresponding only to part of the routeudescribes. Figure 2(a) shows an example of such a sub-route. The point-setW can be seen as the Giver’s current goal on which they base their behaviour. Because the routes are drawn on the Giver’s maps, we treat
W as observed.
To model some of the interaction between the Giver and the Follower, we additionally consider in our model the previous dialog act of the Fol-lower, which could for example be:
f =Acknowledge
Given point-setW and preceding Follower act
f, as the giver, we need to determine a procedure for choosing which dialog actgand semantic unit
uto produce. In other words, we are interested in the following distribution:
p(g, u|f, W) (1) which says that, as the Giver, we select our utter-ances on the basis of what the Follower says, and on the set of waypoints we next wish to describe.
To formalise this idea into a generative model, we assume that the Giver actg depends only on the Follower actf. We further assume that the se-mantic unitudepends on the set of waypointsW
which it describes, and on the Giver’s choice of dialog actg. Thus, uandf are conditionally in-dependent giveng. This provides a simple way of incorporating the different sources of information into a complete generative model3. Using Bayes’
theorem, we can rewrite Equation (1) as:
p(g, u|f, W) =
p(u)p(g|u)p(f|g)p(W|u)
P
g0u0 p(u0)p(g0|u0)p(f|g0)p(W|u0) (2)
requiring four distributions: p(u),p(g|u),p(f|g), andp(W|u). The first three become the seman-tic component of our model, to which we dedi-cate Section 3.1. The fourth is the spatio-semantic component, to which we dedicate Sections 3.2– 3.4.
2We alignganduin a preprocessing step, and store the
names of landmarks which the units abstract away from.
3Further advancements to this work would investigate the
3.1 The Semantic Component
The semantic component concerns only the cate-gorical variables, f, g, andu, and addresses how the Giver selects their semantic utterances based on what the Follower says. We model the distri-butionsu,g|u, andf|gfrom Equation (2) as cate-gorical distributions with uniform Dirichlet priors:
u∼Cat(α) α ∼Dir() (3a)
g|u∼Cat(β) β ∼Dir(κ) (3b)
f|g∼Cat(γ) γ ∼Dir(λ) (3c) We use point estimates forα,βandγ, fixing them at their posterior means in the following manner:
ˆ
βgu=p(g|u) = PCount(g, u) + 1
g0Count(g0, u) +L (4) and similarly forαˆandˆγ(L=size of vectorβ).
3.2 Spatial Goal Abstraction
Each ordered point-setW on some given map can be seen as the Giver’s current goal, on which they base their behaviour. LetW = {wi; 0≤i < n}, wherewi = (xi, yi)is a waypoint, and xi, yi are pixel coordinates on the map, typically obtained through a vision processing step.
Given this goal formulation, from Equation (2) we require p(W|u), i.e. the probability of a set of waypoints given a semantic unit. However, there are two problems with deriving a generative model directly over W. Firstly, the length of W
varies from one point-set to the next, making it hard to compare probabilities with different num-bers of observations. Secondly, deriving a model directly over x, y coordinates introduces sparsity problems, as we are highly unlikely to encounter the same set of coordinates multiple times. We thus require an abstraction away from the space of pixel coordinates.
Our approach is to extract feature vectors of fixed length from the point-sets, and then derive a generative model over the feature vectors instead of the sets. Feature extraction allows point-sets with similar characteristics, rather than exact pixel values, to give rise to similar distributions over units, thus enabling the model to reason given previously unseen point-sets. The features we ex-tract are detailed in Section 3.4.
3.3 The Multivariate Normal Distribution
LetM be an unordered point-set describing map elements, such as landmark locations and map
boundary information. M = {mj; 0≤j < k}, wheremj = (xj, yj)is a map element with pixel coordinatesxj andyj. We define a spatial feature functionψ:W, M → Rnwhich captures, as fea-ture values, the characteristics of the point-setW
in relation to elements inM. Let the spatial fea-ture vector, extracted from the point-setW and the map elementsM, be:
v =ψ(W, M) (5)
Figure 2(b) illustrates the feature extraction pro-cess. We now define a distribution over the feature vectorvgiven the semantic unitu. We modelv|u
as a multivariate normal distribution (recall thatv
is inRn):
v|u∼N(µu,Σu) (6) whereµ andΣ are the mean vectors and covari-ance matrices respectively. Subscriptu indicates that there is one such parameter for each unitu.
Since the alignments between unitsuand point-sets W are fully observed, parameter estimation is a question of estimating the mean vectors µu0 and the covariance matrices Σu0 from the point-sets co-occuring with unitu0. We use maximum likelihood estimators. To avoid issues with de-generate covariance matrices resulting from small amounts of data, we consider diagonal covariance matrices. Becausev|uis normally distributed, in-ference, both for parameters and conditional distri-butions over units, can be performed exactly, and so the model is exceptionally quick to learn and perform inference.
3.4 The Spatial Feature Sets
We derive four feature sets from the ordered point-setW, while considering the map elements in the unordered point-setM:
1. Absolute featurescapture directions and dis-tances of movement. We compute the distance between the first and last points inW, and com-pute the angle between unit vector<0,-1>and the line connecting first and last points inW
2. Polynomial featurescapture shapes of move-ments as straight lines or curves. We compute the mean residual of a degree one polynomial fit to the points inW (linear), and a degree two polynomial (quadratic)4
4These features are computed quickly and efficiently,
u
g v
f μu Σu
γ λ
κ
ε β
α
u = MOVE(UNDER,LM)
w6
w0 w6
w0
M= W=
v = w0
w1
: wn
m0
m1
: mk
(a) sub-route aligned with u (b) spatial feature extraction (c) the model
Figure 2: (a) At training time, a Giver’s semantic unituis aligned with an ordered point-set W, repre-senting a sub-route. (b) We extract a spatial feature vectorvof fixed length, from point-setsW andM
of varying lengths. (c) We define a generative model of the Giver, over Giver actgand semantic unitu, preceding Follower actf, and spatial feature vectorv. Latent parameters and priors are shown.
3. Landmark features capture how close the route takes the Follower to the nearest land-mark. We compute the distance between the end-point inW and the nearest landmark inM, and compute the angle between the route taken inW and the line connecting the start point in to the nearest landmark
4. Edge featurescapture the relationship between the movement and the map edges. We compute the distance from the start-point in W to the nearest edge and corner inM, and similarly for the end-point inW
3.5 The Complete Generative Model
Our complete generative model of the Giver is a distribution over Giver actgand semantic unitu, given the preceding Follower actf and the spatial feature vectorv. Vectorv is the result of apply-ing the feature extraction functionψoverW and
M, where W is the ordered point-set describing the sub-route aligned withu, andM is the point-set describing landmark locations and map edge information. We rewrite Equation (2) as:
p(g, u|f, v) =
p(u)p(g|u)p(f|g)p(v|u)
P
g0u0 p(u0)p(g0|u0)p(f|g0)p(v|u0) (7)
We call our model the Spatio-Semantic Model,
SSM, and depict it in Figure 2(c).
4 Corpus Statistics and State Space
We conduct our experiments on the Map Task cor-pus (Anderson et al., 1991), a collection of cooper-ative human-human dialogs arising from the task explained in Figure 1 and Table 1. The original corpus was labelled with dialog acts, such as Ac-knowledge andInstruct. The semantic units can
be obtained through a semantic parse of the nat-ural language utterances, while the spatial infor-mation can be obtained through vision processing of the maps. We use an existing extension of the corpus by Levit and Roy (2007), which is seman-tically and spatially annotated. The spatial anno-tation arex, ypixel coordinates of landmark loca-tions and evenly spaces points on the routes. All 15 maps were annotated. The semantic units take the predicates MOVE, TURN, POSITION, or ORI -ENTATION, and two arguments: a route descrip-tor and a referent. The semantic annotations were restricted to the Giver’sInstruct, Clarify, and Ex-plainacts. Out of the original 128 dialogs, 25 were semantically annotated.
For our experiments, we use all 15 pairs of maps, and all 25 semantically annotated dialogs. A dialog on average contain 57.5 instances, where an instance is an occurrence of f, g, u, and W. We find 87 unique semantic units u in our data, however, according to the semantic representation, there can be 456 distinct possible values for u5.
As for the rest of the variables,f takes 15 values,
g takes 4, andv is a real-valued vector of length 10, extracted from the real valued setsW andM
of varying lengths. We thus reason in a semantic state space of87×15×4 = 5220, and an infinite spatial state space.
5 Intrinsic Evaluation
Our first evaluation metric is an information theo-retic one, based on notion that better models find new instances of data (not used to train them) to be more predictable. One such metric is the probabil-ity a model assigns to the data, (higher is better). A
520×2 for TURN and ORIENTATION, + 208×2 for
[image:5.595.92.513.62.173.2]second metric is perplexity, which computes how surprising a model finds the data (lower is better). Both metrics have been used to evaluate user simu-lators in the literature (Georgila et al., 2005; Eshky et al., 2012; Pietquin and Hastie, 2013). We com-pute the per-utterance probability of held-out data, instead of the per-dialog probability, since the lat-ter was deemed incompatible across dialogs of dif-ferent lengths by Pietquin and Hastie (2013). Per-plexity is2−log2(d)wheredis the probability of the
instance in question. We evaluate using leave-one-out validation, which estimates the model from all but one dialog, then evaluates the probability of that dialog. We repeat this process until all dialogs have been evaluated as the unseen dialog.
Because we evaluate on held-out dialogs, we need to be able to assign probabilities to pre-viously unseen instances. We therefore smooth our models (at training time) by learning a back-ground model which we estimate from all the training data. This results in high variance in the distribution over features and a flat overall dis-tribution. Where no model can be estimated for a particular semantic unit, we use that semantic unit’s smoothed prior probability combined with the background model for its likelihood.
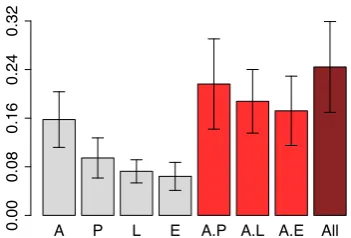
We first consider the suitability of the differ-ent feature sets for predicting utterances. Fig-ure 4 shows the mean per-utterance probability our model assigns to held-out data when using differ-ent sets. The more predictable the model finds the data, the higher the probability. Note that the tar-get metric here isnot1, as there is no single cor-rect answer. It can be seen that the most success-ful features in order of predictiveness are: Abso-lute, then Polynomial, then Landmark, and finally Edge. The combination of all buys us further im-provement. Perplexity is shown in Table 2.
Secondly, we consider two baselines inspired by similar approaches of comparison in the literature (Eckert et al., 1997; Levin and Pieraccini, 2000; Georgila et al., 2005). Both are variants of our model that lack the spatial component, i.e. they are not goal-based. Although the baselines are weak, they allow us to measure the reduction in uncer-tainty brought by the introduction of the spatial componenet to our model, which is the purpose of this comparison. Baseline 1 is p(g, u) while
Baseline 2is(g, u|f). The first tells us how pre-dictable giver utterances are (in the held-out data), based only on the normalised frequencies. The
A P L E A.P A.L A.E All
0.00
0.08
0.16
0.24
0.32
Figure 3: Mean per-utterance probability, as-signed to held-out data by our model, when de-fined over the four feature sets and their combina-tions, estimated through leave-one-out validation. A=Absolute, P=Polynomial, L=Landmark, and E=Edge. Error bars are standard deviations.
Feature Set Perplexity
Absolute (A) 7.26±4.08
Polynomial (P) 12.86±8.39
Landmark (L) 15.16±6.27
Edge (E) 17.92±8.47
[image:6.595.328.504.60.179.2]All 4.66±2.22
Table 2: Perplexity scores (and standard devia-tions) of our model, computed over the four fea-ture sets and their combination, estimated through leave-one-out validation. (A) outperforms all indi-vidual sets, while the combination performs best.
second tells us how predictable they become when we condition on the previous follower act. Details of the baselines are similar to Section 3.1.
Figure 4 shows the mean per-utterance prob-ability our model assigns to held-out data when compared to the two baselines. Baseline 2 slightly improves our predictions over Baseline 1, al-though not reliably so, when considering the small increase in perplexity in Table 3. SSM demon-strates a much larger relative improvement across both metrics. The results demonstrate that our spatial component enables substantial reduction in uncertainty, brought by the transfer of information from the maps to the utterances.
[image:6.595.342.492.285.371.2]Baseline1 Baseline2 SSM
0.00
0.08
0.16
0.24
[image:7.595.93.271.61.178.2]0.32
Figure 4: Mean per-utterance probability, assigned to held-out data by our model (SSM), compared to two baselines which lack the spatial componenet, estimated through leave-one-out validation. Error bars are standard deviations.
Model Perplexity
Baseline1 24.95±4.05
Baseline2 25.06±12.02
SSM 4.66±2.22
Table 3: Perplexity scores of our model (SSM), compared to the two baselines, estimated through leave-one-out validation. SSM finds the held-out data to be least surprising.
information about the relative strengths of differ-ent models rather than their absolute utility. In the next section, we explore methods for determining the utility of the models when applied to tasks.
6 Extrinsic Evaluation
In this section, we undertake a task-based evalu-ation of model output. We train on 22 of the di-alogs, holding out 3 at random for testing. The task is to then generate, for each sub-route in the test dialogs, the most probable unit to describe it6.
Figure 5 shows some examples of sub-routes taken from the test dialogs, and shows the the most prob-able unit to describe each under our model,SSM.
We first explore a naive notion of accuracy: the percentage of model-generated units matching
Real Giverunits observed in the test dialogs. We compute the same for Baseline1 from Section 5 as a lower bound. A quick glance at the results in Table 4 might suggest that both models have lit-tle utility: SSM is “correct” only 33% of the time. However, the extent to which this conclusion fol-lows depends on the suitability of accuracy as a
6The models can generate 1 of the 87 units observed in
the training set, but are made to output the most probable in this experiment.
Baseline SSM Match to Real Giver 7.69% 33.08%
Table 4: Percentage of model-generated units that match Real Giver units in the test set. The models output the most probable unit to describe a given sub-route. We argue that this metric is unsuitable as it assumes one correct answer.
Mismatch Baseline SSM Real Giver
1.45 3.04 5.27 5.11
Table 5: Average scores assigned by human judges to model-generated units on a 7-level Likert scale. Mismatch is judged to be the worst, followed by Baseline. SSM and Real Giver are scored well, and are judged to be of similar quality.
means of evaluating dialog. In most situations, there is not a single correct description and a host of incorrect ones, but rather a gradient of descrip-tions from the highly informative and appropriate to the nonsensical and confusing. Such subtleties are not captured by an accuracy test (or the closely related recall and precision). In demonstration of this point, we next conduct qualitative evaluation of model output.
We ask humans to rate, on a Likert scale of 7, the degree to which a given unit provides a suitable description of a given sub-route. Sub-routes are taken from the test dialogs, and are marked simi-larly to Figure 5 but on the complete map. Units are generated from SSM, Baseline, Real Giver, and a control condition: a deliberate Mismatch
to the sub-route. The Mismatch is generated au-tomatically by taking the least probable unit under SSM, of the form MOVE(TOWARD,x) wherexis one of the four compass directions. We collect 5 judgements for each sub-route-unit combinations on Mechanical Turk, and randomise so that no judge sees the same order of pairs. Test dialogs contained 94 distinct sub-routes.
We analyse the results with a two-way ANOVA, with the first factor being model, and the second being the sub-route, for a 4×94 design. Themeans
[image:7.595.117.247.269.327.2]fac-(c) (d) (e) (a) (b)
Figure 5: Given a sub-route marked with start-point ◦ and end-point ×(in red), SSM generates the following u: (a) MOVE(TOWARDS, ABS NORTHEAST) (b) TURN(ABS WEST) (c) MOVE(FOLLOW -BOUNDARY, LM) (d) MOVE(AROUND, LM) (e) MOVE(TOWARDS, ABS SOUTHWEST)
Factor S Sq Df F Pr(>F)
Model 4845.3 3 783.93 <0.001
Sub-route 1140.0 93 5.95 <0.001
M:S 2208.7 279 3.84 <0.001
Residuals 3263.5 1584
Table 6: Two way ANOVA with factors model (4 possibilities), and sub-route (94 possibilities). Re-sults show a model effect accounting for most of the variance. Meaning that the scores assigned to the units by human judges are significantly influ-enced by the model used to generate the units.
Model Comparison t value Pr(>|t|)
Mismatch : Baseline -16.974 <0.001 SSM : Baseline 23.882 <0.001 Real Giver : Baseline 23.192 <0.001 SSM : Mismatch 40.857 <0.001 Real Giver : Mismatch 40.507 <0.001
[image:8.595.84.516.62.135.2]SSM : Real Giver 1.171 0.646
Table 7: Tukey HSD shows that all models are assigned significantly different scores by judges, apart from SSM and Real Giver. This asserts that, although only 33% of SSM units match Real Giver units (as shown in Table 4), the quality of the units are not judged to be significantly different.
tor is present, meaning that the scores assigned by human judges to the units are significantly influ-enced by which model was used to generate the units. Additionally, a significant effect for the route factor can be seen, which is due to some sub-routes being harder to describe than others. An in-teraction effect is also present, which is expected given such a large number of examples. Note how the model factor accounts for the largest amount of variance of all the factors.
Having confirmed the presence of a model ef-fect, we conduct a post-hoc analysis of the model factors. Table 7 shows a Tukey HSD test, demon-strating that all models are significantly different
from one another, except Real Giver and SSM. Re-sults show that, despite the large number of judge-ments collected, we are unable to separate the quality of our model’s unit from that in the origi-nal data, against which accuracy was being judged in Table 4. This demonstrates that when many an-swers are feasible, scoring correctness against the original human units is unsuitable. It also firmly demonstrates the suitability of our spatial repre-sentation, and the strength of the generative model we have induced for the task.
7 Conclusion and Discussion
We have shown how to represent spatial goals in a navigational domain, and have validated our rep-resentation by inducing (fully from data) a gen-erative model of the Giver’s semantic utterances conditioned on the spatial goal and the previous Follower act. Intrinsic and extrinsic evaluation demonstrate the strength of our model.
A direct application of this work is robot guid-ance, by using the Giver’s simulator to induce an optimal Follower: an MDP-based dialog manager that interprets and follows navigational instruc-tions. Another variation would be to learn a gen-erative model of the Follower, by extracting fea-tures from Follower maps (labelled with routes drawn by real Followers). Finally, this work has broader applications beyond simulation, in partic-ular for systems that describe routes to users (spa-tial goal representation and model dependencies would hold). Decisions about which part of the route to describe next is one extension to that end.
Acknowledgements
References
Hua Ai and Diane J. Litman. 2007. Knowledge con-sistent user simulations for dialog systems. In Inter-Speech 2007, pages 2697–2700.
Anne H. Anderson, Miles Bader, Ellen Gurman Bard, Elizabeth Boyle, Gwyneth Doherty, Simon Garrod, Stephen Isard, Jacqueline Kowtko, Jan McAllister, Jim Miller, Catherine Sotillo, Henry S. Thompson, and Regina Weinert. 1991. The hcrc map task cor-pus. Language and Speech, 34(4):351–366. Heriberto Cuay´ahuitl, Steve Renals, Oliver Lemon, and
Hiroshi Shimodaira. 2005. Human-computer dia-logue simulation using hidden markov models. In
ASRU 2005, pages 290–295.
Wieland Eckert, Esther Levin, and Roberto Pieraccini. 1997. User modeling for spoken dialogue system evaluation. In Proceedings of IEEE Workshop on Automatic Speech Recognition and Understanding. Aciel Eshky, Ben Allison, and Mark Steedman. 2012.
Generative goal-driven user simulation for dialog management. In EMNLP-CoNLL 2012, pages 71– 81, Jeju Island, Korea, July. Association for Compu-tational Linguistics.
Kallirroi Georgila, James Henderson, and Oliver Lemon. 2005. Learning user simulations for in-formation state update dialogue systems. In Inter-Speech 2005.
Kallirroi Georgila, James Henderson, and Oliver Lemon. 2006. User Simulation for Spoken Dia-logue Systems: Learning and Evaluation. In Inter-Speech 2006.
James Henderson and Oliver Lemon. 2008. Mixture model pomdps for efficient handling of uncertainty in dialogue management. In ACL, HLT-Short ’08, pages 73–76, Stroudsburg, PA, USA. Association for Computational Linguistics.
Srinivasan Janarthanam, Oliver Lemon, Phil Bartie, Tiphaine Dalmas, Anna Dickinson, Xingkun Liu, William Mackaness, and Bonnie Webber. 2013. Evaluating a city exploration dialogue system with integrated question-answering and pedestrian navi-gation. InACL.
Esther Levin and Roberto Pieraccini. 2000. A stochas-tic model of human-machine interaction for learning dialog strategies. In IEEE Transactions on Speech and Audio Processing.
Esther Levin, Roberto Pieraccini, and Wieland Eckert. 1998. Using markov decision process for learning dialogue strategies. In Proc. ICASSP, pages 201– 204.
M. Levit and D. Roy. 2007. Interpretation of spatial language in a map navigation task. IEEE Trans-actions on Systems, Man, and Cybernetics, Part A, 37(3):667–679.
Pierre Lison. 2013. Model-based bayesian reinforce-ment learning for dialogue managereinforce-ment. In Inter-speech 2013.
Olivier Pietquin and Thierry Dutoit. 2006. A prob-abilistic framework for dialog simulation and opti-mal strategy learning.Audio, Speech, and Language Processing, IEEE Transactions on, 14(2):589–599, march.
Olivier Pietquin and Helen Hastie. 2013. A survey on metrics for the evaluation of user simulations.
Knowledge Eng. Review, 28(1):59–73.
Olivier Pietquin. 2004. A Framework for Unsuper-vised Learning of Dialogue Strategies. Ph.D. thesis, Facult´e Polytechnique de Mons, TCTS Lab (Bel-gique), apr.
Olivier Pietquin. 2006. Consistent goal-directed user model for realisitc man-machine task-oriented spo-ken dialogue simulation. InMultimedia and Expo, 2006 IEEE International Conference on, pages 425– 428. IEEE.
David Reitter and Johanna D. Moore. 2007. Predicting success in dialogue. InACL.
Verena Rieser and Oliver Lemon. 2006. Cluster-based user simulations for learning dialogue strate-gies. InINTERSPEECH 2006 - ICSLP, Ninth Inter-national Conference on Spoken Language Process-ing, September.
St´ephane Rossignol, Olivier Pietquin, and Michel Ian-otto. 2010. Simulation of the grounding process in spoken dialog systems with bayesian networks. In
IWSDS, pages 110–121.
St´ephane Rossignol, Olivier Pietquin, and Michel Ian-otto. 2011. Training a bn-based user model for di-alogue simulation with missing data. In IJCNLP, pages 598–604.
Nicholas Roy, Joelle Pineau, and Sebastian Thrun. 2000. Spoken dialogue management using proba-bilistic reasoning. In Proceedings of the 38th An-nual Meeting on Association for Computational Lin-guistics, ACL ’00, pages 93–100, Stroudsburg, PA, USA. Association for Computational Linguistics. Jost Schatzmann and Steve Young. 2009. The
hid-den agenda user simulation model. Audio, Speech, and Language Processing, IEEE Transactions on, 17(4):733–747.
Konrad Scheffler and Steve Young. 2002. Automatic learning of dialogue strategy using dialogue simula-tion and reinforcement learning. InProceedings of HLT 2002.
Henry S. Thompson, Anne Anderson, Ellen G. Bard, Gwyneth D. Sneddon, Alison Newlands, and Cathy Sotillo. 1993. The HCRC Map Task corpus: natu-ral dialogue for speech recognition. InProceedings of the workshop on Human Language Technology, HLT ’93, pages 25–30, Stroudsburg, PA, USA. As-sociation for Computational Linguistics.
Adam Vogel and Daniel Jurafsky. 2010. Learning to follow navigational directions. InACL 2010, Pro-ceedings of the 48th Annual Meeting of the Asso-ciation for Computational Linguistics, July 11-16, 2010, Uppsala, Sweden, pages 806–814. The Asso-ciation for Computer Linguistics.
Jason D. Williams and Steve Young. 2007. Partially observable markov decision processes for spoken dialog systems. Computer Speech and Language, 21(2):393–422.
Jason D. Williams. 2007. Applying pomdps to dia-log systems in the troubleshooting domain. In Pro-ceedings of the Workshop on Bridging the Gap: Aca-demic and Industrial Research in Dialog Technolo-gies, NAACL-HLT ’07, pages 1–8, Morristown, NJ, USA. Association for Computational Linguistics. Steve Young, Milica Gasic, Blaise Thomson, and