Abstract—This article utilizes CFD software to investigate the smoke
control system of the safety reliability for the underground Mass Rapid Transit (MRT) system. The purpose of this research is to simulate the fire occurring in the tunnel region where the smoke control system designs are corresponding to the National Federation of Paralegal Associations 130 (NFPA130). The smoke control mode of the tunnel includes the Tunnel Ventilation Fan (TVF) and Jet Air Fan (JAF) in the station. The control strategies of the TVF, JAF, and the flow phenomenon of the smoke in the fire environment are simulated by commercial software, PHOENICS. In the numerical simulation, the results show that under the conditions of turning on the TVF and JAF in 3 minutes later, if the fire in the tunnel region attains the criterion of temperature field (<60℃), the concentration of carbon monoxide (<1500ppm), radiation intensity (<6.3kW/m2) and visibility (
≥
10m),passengers can evacuate from these safe passages. The smoke control system in this paper is very useful for fire accidents of the tunnels. The study verifies that simulation result is in good agreement with the standard of NFPA130.
Index Terms—System control system, Tunnel ventilation fan (TVF),
Jet air fan (JAF), PHOENICS.
I. INTRODUCTION
The aim of this research is to simulate the fire taken place in thepocket track tunnel of the underground Mass Rapid Transit (MRT) system. Besides, proceed to analyze the distributions of the temperature and the smoke concentration in pocket track region when turn on the Tunnel Ventilation Fan (TVF) and the Jet Air Fan (JAF). Afterward employ the simulation results to verify the tunnel ventilation systems are functional. This article examines the escape routes with the National Federation of Paralegal Associations 130 (NFPA130) and validates whether passengers can be evacuated from these safe passages or not.
The first investigation of smoke ventilation control presented in 1958 [1]. Jones [2] supposed there were two air chambers (Two–Zone Model) in the fire field and utilized computer to simulate the fire behavior which were included with predicting the average temperature distributions and the smoke motion. Kumar and Cox [3] used numerical analysis to simulate the tunnel fire and in the combustion processes with One-Step Reaction model. Gonzalez and Danziger [4] studied how much air flow can exhaust the soot more effectively. Chow and Leung [5] employed 3-D numerical analysis to find the critical ventilation velocity. Kumar [6] proposed full-scale models and tests. The Field Model in the full-scale fire tests had better predictability [7]. Chasse [8] applied commercial software, FLOW-3D, to simulate the tunnel fire in different physics models which are compared to experiment data. Tewarson [9] discovered that the carbon monoxide concentration increases with increase of the air oxygen content when fire occurs. The influences of ventilation velocity, heat release rate, and turbulent model in the fire field could be calculated by computational fluid dynamics (CFD) [10]. McGrattan [11] utilized large eddy simulation (LES) to simulate the fire behavior. Wei et al. [12] presented the development and integration of a
Muscript received February 11, 2009.
Ying-Che Weng is with the Department of Mechanical Engineering, National Taiwan University, Taipei, CO 10617 Taiwan.
Ming-Tsun Ke is with the Department of Energy and Refrigerating Air Conditioning Engineering, National Taipei University of Technology Taipei, CO 10608 Taiwan.
Sih-Li Chen is with the Department of Mechanical Engineering, National Taiwan University, CO 10617 Taiwan. (corresponding author to provide phone:886-2-23621808;fax:886-2-23631755;e-mail:[email protected])
smoke detector activation algorithm (known as the SDAA) that describes the response time of a smoke detector into a LES fire model. Hwang [13] indicated that the LES turbulence model was capable of predicting the critical ventilation velocity in channels of various size and configuration. The effect of tunnel inclination on the critical ventilation velocity was also predicted. Kai [14] showed that a smoke model was developed to evaluate smoke visibility in computational fluid dynamics. The smoke visibility was defined as the exponential light attenuation.
II. N
UMERICAL METHODA. Initial conditions setup
k-ε turbulent model, transient analysis, and no slip wall condition are utilized in this study. The tunnel inlet and outlet are connecting with atmosphere pressure. The temperature in the tunnel is 36℃. The tunnel ventilation equipments are turned on at 3 minutes after burning. And the heat release rate (HRR) is 20MW.
B. Grid independence tests
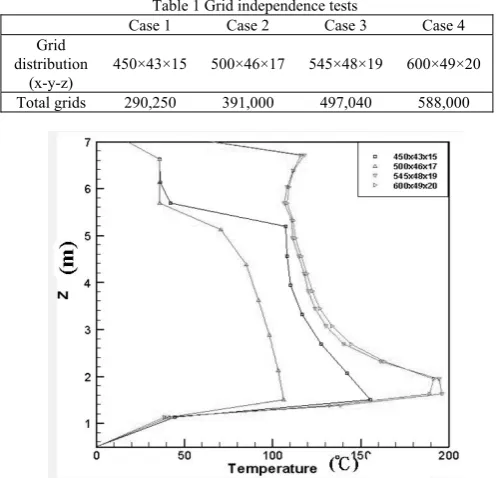
Four kinds of grid sensitivity tests have shown in Table 1. The results display that the case 3 is good enough in this research, which is less simulation time and cells (Fig. 1).
[image:1.595.299.548.441.680.2]This article simulates the train fire in pocket track region between O5/R10 and R11 stations. Detail data are shown in Table 2.
Table 1 Grid independence tests
Case 1 Case 2 Case 3 Case 4 Grid
distribution (x-y-z)
450×43×15 500×46×17 545×48×19 600×49×20
Total grids 290,250 391,000 497,040 588,000
Fig. 1 Z direction temperature distributions in different grid numbers
Table 2 Simulation condition
Item Heat output Fire place TVF time time JAF Simulate time
Case1 α=0.0556kW/s20MW, fast 2, Down track 3 min 3 min 720sec
Case2 α=0.0556kW/s
2,
20MW, fast Up track 3 min 3 min 720sec
Safety Reliability Method Applied to Evaluate
Smoke Control System of Fire Accident in the
Tunnel of Mass Rapid Transit System
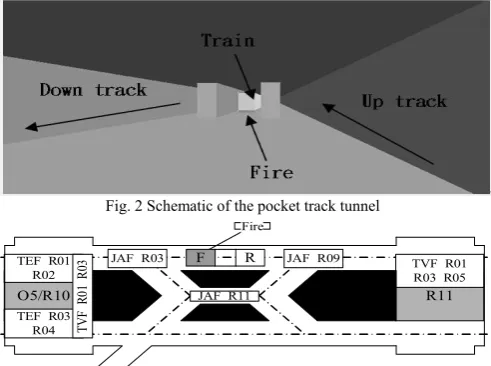
[image:1.595.299.554.708.768.2]Fig. 2 Schematic of thepocket track tunnel
R11 O5/R10
JAF R09
JAF R11 JAF R03
TEF R01 R02
F R
TEF R03 R04
Fire
TVF R01 R03 R05
TVF
R
01
R
03
Fig. 3 Case 1: the train head fire in down track of the pocket track and ventilation system location
C. Numerical model
The pocket track tunnel and the train are1095 m (length) × 23 m (width) × 7.87 m (height) and 130.9 m×3.15 m×3.71 m, respectively. Fig. 2 illustrates the pocket track tunnel region model.
Case 1
Fig. 3 demonstrates the train head fire in pocket track tunnel. The operation strategies are described as:
1) Turn on the JAFs of R03, R09, and R11, with air flow rate 20 CMS in tunnel between the two stations.
2) Actuate the TVFs of R01 and R03, the air flow rates are 60 CMS; TEFs of R01, R02, R03, and R04 are 20 CMS in R10 station. 3) Activate the TVFs of R01, R03, and R05 which are 54 CMS in R11
station.
Case 2
The train tail fire in pocket track tunnel is shown in Fig. 4. The control strategies are presented below:
1) The JAFs of R08, R12, and R14 are 20 CMS in tunnel between the two stations.
2) The TVFs of R01 and R03 are 60 CMS; TEFs of R01, R02, R03, and R04 with 20 CMS in R10 station.
3) Switch on the TVFs of R02, R04, and R06 with air flow rate 54 CMS in R11 station.
R11
O5/R10 JAF R12
JAF R14
JAF R08 R F
Fire TEF R01
R02
TEF R03
R04 TVF TVF R02 R04 R06
R
01
R
03
Fig. 4 Case 2: the train tail fire in up track of the pocket track and ventilation system locations
III. R
ESULTS AND DISCUSSIONA. Visibility and Carbon monoxide concentration conversions
In PHOENICS,itis unable to calculate visibility and CO concentration directly. Therefore, (1) is applied to solve the two parameters in this paper.
s m V m K C V ×
= K (1)
where V is the visibility, CVk is the proportional constant, Km is the specific
extinction coefficient, ms is the mass concentration of soot. According to the
National Institute Standards and Technology (NIST) database [16, 17], the ratio of smoke and CO2 production can be expressed below:
2 2 2 CO CO
smoke smoke CO smoke C C m m ρ ρ = (2) 2 2 2 CO CO
CO CO CO CO C C m m ρ ρ = (3)
(
CO air)
CO CO CO air CO W W Y W Y W C − − = 2 2 2 2 2 (4)
where msmoke is the mass of the smoke per unit fuel, mCO2 is the mass of CO2 per unit fuel, Csmoke is the volume concentration of smoke, Cco2 is the volume concentration of CO2, ρsmoke is smoke density, ρco2 is CO2 density, mCO is the
mass of CO per unit fuel, Cco is the volume concentration of CO, ρco is CO
density, Wair is the mole of air, and Wco2 is the mole of CO2. From above results, (2) and (3) can be rewritten as:
2 2 10 65 . 3 CO smoke C
C = × − (5)
2 2 10 995 . 2 CO CO C
C = × − (6)
In (5) and (6), this study can obtain the relations of smoke concentration between CO, CO2, and visibility as indicated in Table 3.
B. Calculation of radiation intensity
From fire source to the surface radiation of human body is shown as:
(
4)
1 4 2 2 1
2d d
rad F A T T
[image:2.595.47.293.51.234.2]Q = − εσ − (7)
Table 3 The relations of smoke concentration between CO, CO2, and visibility
Visibility Smoke concentration Smoke volume concentration CO2 volume concentration CO volume concentration CO2 mass fraction Simulation smoke concentration Km V(m) ms (g/m3) Csmoke(m3/m3) CCO2 (m3/m3) CCO ( m3/m3) YCO2 Smoke
7 5.79E-2 4.83E-5 1.32E-3 2.52E-5 2.0E-3 0.114 7.4
8 5.07E-2 4.23E-5 1.16E-3 2.21E-5 1.76E-3 0.10 7.4
9 4.50E-2 3.75E-5 1.03E-3 1.96E-5 1.56E-3 0.089 7.4
10 4.05E-2 3.38E-5 9.26E-4 1.76E-5 1.41E-3 0.08 7.4
Table 4 Case 1 radiation intensity Distance from
the fire (m)
Human factor (Fd1-2)
Fire factor (F2-d1)
Radiation
intensity Results First door 2.189 0.1982 0.03194 2.740 (kW/ m2) <6.3 (kW/ m2) Second door 6.433 0.02772 0.00447 0.383 (kW/ m2) <6.3 (kW/ m2) Third door 11.665 0.01106 0.00178 0.153 (kW/ m2) <6.3 (kW/ m2) Case1
Forth door 16.996 0.00655 0.00106 0.090 (kW/ m2) <6.3 (kW/ m2) Table 5 Case 2 radiation intensity
Distance from the fire (m)
Human factor (Fd1-2)
Fire factor (F2-d1)
Radiation
intensity Results Forth door 2.189 0.1982 0.03194 1.889 (kW/ m2) <6.3 (kW/ m2) Third door 6.433 0.02772 0.00447 0.264 (kW/ m2) <6.3 (kW/ m2) Second door 11.665 0.01106 0.00178 0.105 (kW/ m2) <6.3 (kW/ m2) Case2
[image:2.595.65.537.567.779.2]Fig. 5 Case1: the locations of monitor points: (a) in front of the second door and (b) the third door
where ε is emissivity, σ is Stefan-Boltzmann constant, A2 is fire source
area, T2 is the fire source temperature, Td is the human body temperature, Fd1-2
is the shape factor from human body to fire source, and F2-d1 is the shape
factor from fire source to human body. Based on (7), the radiation intensity of case 1 and case 2 are calculated in Table 4 and Table 5.
C. Simulation results of Case 1
This research chooses two monitor points of the train head to explain the results of the temperature and smoke distributions. One is in front of the second door (Fig. 5(a)); the other is in front of the third door (Fig. 5(b)). Both are considered the worst cases that are the farthest evacuate routes and the nearest fire source.
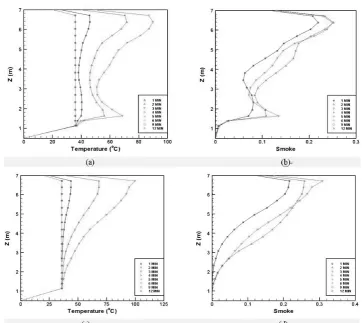
1) The second door of the first train carriage
Fig. 6(a) expresses thatthe TVF is closed and the temperature at train top is going to 90℃ in 3 minutes ago. After 3 minutes, turn on the ventilation system ranging from 4 to 12 minutes. The train top temperature distributions from 5.5m to 6.87m to decrease
observably. Because the TVF and JAF continue work in t≧4 minutes, and the train top temperature maintains a constant value(< 60℃). The smoke concentration magnitudes to the smoke concentration percentages of fire source as shown in Fig. 6(b). In 3 minutes later, the results depicted the smoke concentrations were close to zero.
2) The third door of the first train carriage
Before 3 minutes, the TVF is shut down and the train top
temperature is up to 98℃ as illustrated in Fig. 6(c).After3 minutes, activate the ventilation system within 4 to 12 minutes. The train top temperature distributions have decreased to be less than 60℃. In 3 minutes later, Fig. 6(d) also shows that the smoke concentrations have decreased obviously and been safe for passengers to evacuate from the station.
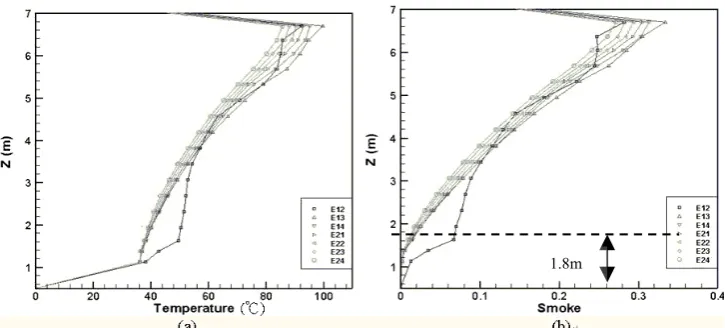
3) Examination of evacuation safety
For passenger safety, the temperature and smoke concentrations of the first and second train carriage in 3 minutes are shown in Fig. 8. The symbols of E12, E13, and E14, means that the first, the second, and the third door of the train first carriage; E21, E22, E23, and E24 implies the first, second, third, and fourth door of the train second carriage. Fig. 7(a) describes that the temperature of 1.8m human height is large than 60℃ in E12 which is the nearest fire source. The farther away fire source with the lower temperature which distributes from E13 to E24 is lower than 60℃. The nearest fire source, E12, has the highest smoke concentration as presented in Fig. 7(b) and is not safe for passengers. From E13 to E24, the smoke concentrations are lower than 0.02 (according to Table 5 the visibility is larger than 10m). Therefore, besides E12, the other doors are agreed with NFPA 130.
D. Case 2 Simulation results
This study selects two monitor points of the train tail to illustrate the results of the temperature and smoke distributions. One is in front of the second door (Fig. 8(a)); the other is in front of the third door (Fig. 8(b)). Both are deliberated the worst cases that the farthest evacuate routes and the nearest fire source.
[image:3.595.115.478.438.761.2]Fig. 7 (a) Case 1: the Z axis temperature distributions of train head near the first and second doors (b) Case 1: the Z axis smoke concentration of train head near the first and second door
Fig. 8 (a) Case2: the location of monitor point in front of the second door (b) Case2: the third door
1) The second door of the train tail
Fig. 9(a) shows, in 3 minutes ago the TVF is shut down and the train top temperature is up to 90℃. Opening the ventilation system in 4 to 12 minutes and the train top temperature distributions has decreased to 40℃. It is totally displayed that the emergency control mode can reduce temperature growth. Meanwhile, Fig. 9(b) implies that the smoke concentration is related to the smoke concentration percentages of the fire source at 3 minutes later. The smoke concentrations have decreased effectively.
2) The third door of the train tail
Before 3 minutes, the TVF is not operation. The temperature of train top is going up to 110℃ (Fig. 9(c)). After 3 minutes, turn on the TVF and the JAF from 4 to 12 minutes and the train top temperature distributions (5.5m-6.87m) has been decreased right away. Fig. 9(d) indicates that in 3 minutes later, the smoke concentrations have decreased obviously and are safe for passengers to evacuate.
Fig. 9(a) Case2: the Z axis temperature distributions of train tail near the second door (b) Case2: the Z axis smoke concentrations of train tail near the second door (c) Case2: the Z axis temperature distributions of train tail near the third door (d) Case2: the Z axis smoke concentrations of train tail near the third door
[image:4.595.124.475.49.202.2] [image:4.595.78.260.233.397.2] [image:4.595.124.473.423.762.2]Fig. 10 (a) Case 2: the Z axis temperature distributions of train tail near the fifth and sixth door (b) Case 2: the Z axis temperature distributions of train tail near the fifth and sixth door
3) Examination of evacuation safety
The temperature and the smoke concentrations of the fifth and the sixth train carriage were inspected in 3 minutes for passenger safety. Fig. 10(a) displays that in E12 the 1.8m human height temperature is up to 52℃. Fig. 10(b) also presents that when the nearest fire source, E12 has the higher smoke concentration 0.82 (according on Table 5 the visibility is lower than 10m). Combination of above-mentioned results, E12 is not safe for passengers to evacuate. Besides, from E13 to E24, the temperature is ≦ 60℃ and the smoke concentration is lower than 0.08 (based on Table 5, the visibility is larger than 10m and both conform to NFPA 130).
R
EFERENCES[1] K. Kawagoe, Fire Behavior in Rooms, Building Research Institute, Report (27): Tokyo, 1958.
[2] W.W. Jones, “A Multi-Compartment Model for the Spread of Fire Smoke and Toxic Gases,” Fire Safety Journal, vol.9, 1985, pp.55-79.
[3] S. Kumar and G. Cox, “Mathematical Modeling of Fires in Road Tunnels,” 5th International Symposium on the Aerodynamics and Ventilation of Vehicle Tunnels, Lille, France, 1985, pp.61-76.
[4] J.A. Gonzalez and N.H. Danziger, “Tunnel Ventilation Design for Fire Safety,” 6th International Symposium on the Aerodynamics and Ventilation of Vehicle Tunnels, Durham, England, Paper J2, 1988. [5] W.K. Chow and W.M. Leung, “Application of Field Model to Tunnel
Fires Services Design,” 6th International Symposium on the Aerodynamics and Ventilation of Vehicle Tunnels, Durham, England,
1988, pp.495-514.
[6] S. Kumar, “Fire Development and Smoke Spread in Tunnel,” The first International Conference on Safety in Road and Rail Tunnels, Basel, Switzerland, 1992.
[7] A. Kathy and D. William, The use of computer models to predict temperature and smoke movement in high bay spaces, NISTIR 5304:
Building and Fire Research Laboratory, 1993.
[8] P. Chasse, “Sensitivity study of Different Modeling Techniques for the Computer Simulation of Tunnel Fires Comparisons with Experimental Measures,” CFDS International User Conference, 1993.
[9] A. Tewarson, Ventilation Effects on Combustion Products, Toxicology, vol.115, 1996, pp.145-156.
[10] P.J. Woodburn and R.E. Britter, “CFD Simulation of a Tunnel Fire-Part I,” Fire Safety Journal, vol.26, 1996, pp.35-62.
[11] K.B. McGrattan, H.R. Baum, and R.G. Rehm, “Large Eddy Simulations of Smoke Movement,” Fire Safety Journal, vol.30, 1998, pp.161-178.
[12] Z. Wei, M.O. Stephen, S.K. Michael, J.C. Douglas, J.R. Richard, and L.T. Jose, “A smoke detector activation algorithm for large eddy simulation fire modeling,” Fire Safety Journal, vol.43, 2008, pp.96-107.
[13] C.C. Hwang and J.C. Edwards, “The critical ventilation velocity in tunnel fires a computer simulation,” Fire Safety Journal, 40, 2005,
pp.213-244.
[14] K. Kai, “A smoke model and its application for smoke management in an underground mass transit station,” Fire Safety Journal, vol.42, 2007, pp.218-231.
[15] J.D. Castro and N. Rhodes, CFD prediction of smoke movement in a double track bored tunnel, a cut and cover station, and a mined station in the Athens matro: Mott MacDonald, 1997.
[16] Available: http://www.fire.nist.gov/fastdata/.
[17] W.M. George, and C. Carroll, “Specific Extinction Coefficient of Flame Generated Smoke,” Reprinted from the Fire and Materials, vol. 24(5),
[image:5.595.117.480.48.212.2]