Evaluation of the Hydroxyapatite Film Coating on Titanium Cathode by QCM
5
0
0
Full text
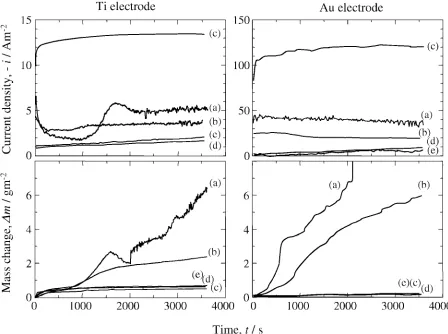
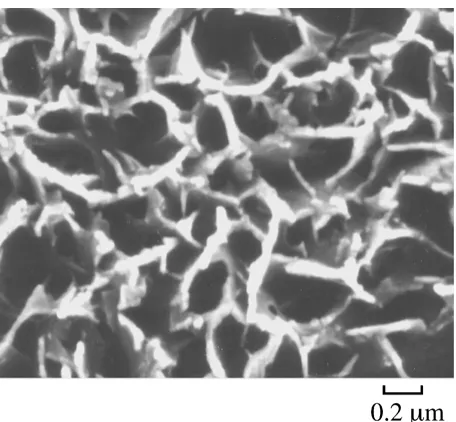
(2) Evaluation of the Hydroxyapatite Film Coating on Titanium Cathode by QCM. 3011. Fig. 1 Changes in cathodic current density and mass for Ti and Au electrodes at −557 mV in various solutions at pH 5.5. (a) Ca(H2 PO4 )2 + CaCl2 + H2 O2 , (b) Ca(H2 PO4 )2 + CaCl2 , (c) Ca(H2 PO4 )2 + H2 O2 , (d) CaCl2 + H2 O2 , (e) H2 O2 .. The film deposits formed on the Ti plate by electrolysis at various cathodic potentials (ranging from −357 to −957 mV) and at various durations (ranging from 0.4 s to 3.6 ks), were analyzed by X-ray diffraction (Shimazu Co. LTD. XRD-6000) and examined by scanning electron microscopy (Hitachi Co. LTD. S-800). 3. Results and Discussion 3.1 QCM measurement of Au and Ti electrodes The electrochemical behavior of a titanium electrode was examined under a cathodic potential of −557 mV in solution with various chemicals and compared with that of a gold electrode, which is inert. The changes in the cathodic current and mass with the Ti and Au electrodes are shown in Fig. 1. The cathodic reaction produces hydroxide ions at the electrode via Reactions 1 and 2 without and with H2 O2 , respectively. Hydroxide production causes supersaturation of the ions that produce HA. The HA solubility product at 309.5 K is given by eq. (3).1) 3 − −59 K s = [Ca2+ ]5 [PO3− (mol · dm−3 )9 4 ] [OH ] = 10. (3). When the supersaturation of hydroxyapatite exceeds the critical level, nuclei form on the substrate and grow into a bioceramic film.9) The addition of H2 O2 to the solution accelerated HA deposition, as shown in Figs. 1(a) and (b). With neither calcium nor phosphorous ions in the solution, the mass gain for the. Ti electrode was less than 1 g·m−2 , and the mass gain was nearly constant and independent of H2 O2 addition, as shown in Figs. 1(c)–(e). The mass gain of the Ti electrode exceeded that of the Au electrode due to the titanium surface reaction that occurred under the cathodic conditions. Mass gains of at least 2 g·m−2 were obtained for 3.6 ks on both electrodes when the solution contained calcium and phosphorous ions as a source of HA. These gains corresponded to the deposition of HA film. Scanning electron microscopy of a cross-section of the Ti QCM electrode showed that the HA film deposited on the electrode after 3.6 ks electrolysis in the solution used in Fig. 1(a) averaged approximately 3.4 µm thick, and ranged from 2.3 to 5.0 µm. The mass gain for the same electrode was 6.4 g·m−2 , which allowed the film thickness to be calculated. When the film is assumed to be compact HA with a density of 3.15 g·cm−3 , a mass gain of 6.4 g·m−2 corresponds to a thickness of 2.0 µm. The difference between the observed and calculated thicknesses indicates that the film is porous, with a filling factor of about 59 vol%. Figure 2 shows the surface morphology of the hydroxyapatite obtained by electrolysis for 3.6 ks at −557 mV; it contains many pores several hundred nanometers in size. Microscopically, the HA film consists of a network of aggregates with walls about 50 nm wide. The current detected at the Ti electrode after HA deposition for 3.6 ks was from 2.3 to 5.1 A·m−2 (Figs. 6 and 1(a)). This current flows through the pores in the HA structure because the compact HA coating blocks the current, preventing.
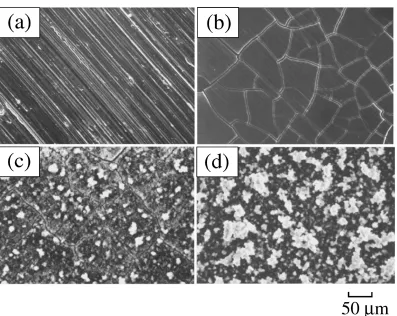
(3) 3012. M. Okido et al.. ion migration. Therefore, the HA film formed by aqueous electrolysis has a porous structure. In order to confirm the reaction with H2 O2 on titanium, the titanium electrode was held at open-circuit potential. The resulting mass changes for the Ti and Au electrodes are compared in Fig. 3. A HA film did not form on both electrodes in every solution. For the Ti electrode, the mass change at 3.6 ks was less than 0.04 g·m−2 , which is small in comparison to the. mass gain of 0.8 g·m−2 under the cathodic conditions in Figs. 1(c)–(e). A decrease in mass was observed in the solution containing only H2 O2 . This suggests that H2 O2 attacks and slightly dissolves titanium. At the Au electrode, hydrogen peroxide self-decomposed, as shown in Fig. 3(c) according to Reaction 4. The small mass changes on Au electrode were thought to be caused by oxygen adsorption corresponding to apparent mass loss and desorption to apparent mass gain as a result of this reaction. 2H2 O2 = 2O2 + 2H2 O. (4). Figure 3 confirms that the change in the mass of titanium due to surface oxidation and dissolution was less than 0.04 g·m−2 , and that the Au electrode was inert after immersion for 3.6 ks.. 222. 213. Ca10(PO4)6(OH)2. 112 202 300. 002. 102 210. 211. Fig. 2 Surface morphology of hydroxyapatite deposited by electrolysis for 3.6 ks at −557 mV in the solution containing 3.0 mol m−3 Ca(H2 PO4 )2 , 7.0 mol m−3 CaCl2 and 6 mass%H2 O2 at pH 5.5, 309.5 K.. 3.2 Characterization of electrolysis deposits Cathodic electrolysis was carried out at various cathodic potentials using titanium plate electrodes. Figure 4 shows the X-ray diffraction patterns for the deposits formed on the titanium plate electrodes. The deposits formed at potentials of −557 and −757 mV for 3.6 ks were HA with good crystallinity that tended to a 002 preferable crystalline orientation. The surface morphology of the HA films deposited on titanium electrodes at the various cathodic potentials in Fig. 4 is shown in Fig. 5. No HA was observed on the Ti electrode at −357 mV, while a flat, smooth, plate-like HA film was observed at −557 mV. At potentials of −757 and −957 mV, cotton-like white particles were also observed on the flat HA deposits. The cracks observed in Fig. 5(b) were thought to have resulted from drying in vacuum following electrolysis in the aqueous solution.. : Ti. Intensity. (a) (b) (c) (d) 20. 30. 40. 50. 60. 2 / deg. (Cu K ) Fig. 3 Mass changes for Ti and Au electrodes at open-circuit potential in various solutions at pH 5.5. (a) Ca(H2 PO4 )2 + CaCl2 + H2 O2 , (b) Ca(H2 PO4 )2 + CaCl2 , (c) H2 O2 , (d) none.. Fig. 4 XRD patterns of the films deposited under cathodic potentials of (a) −357 mV, (b) −557 mV, (c) −757 mV and (d) −957 mV..
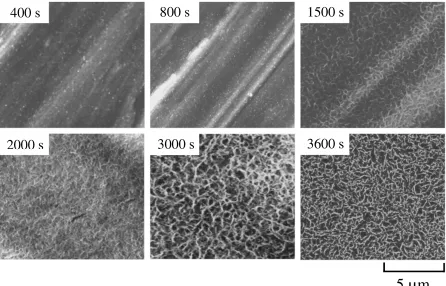
(4) Evaluation of the Hydroxyapatite Film Coating on Titanium Cathode by QCM. 3013. Fig. 5 Surface morphology of the deposits electrolyzed for 3.6 ks in the solution containing 3.0 mol m−3 Ca(H2 PO4 )2 , 7.0 mol m−3 CaCl2 and 6 mass%H2 O2 at pH 5.5, 309.5 K under cathodic potentials of (a) −357 mV, (b) −557 mV, (c) −757 mV and (d) −957 mV.. 3.3 Process of HA formation HA deposition was carried out for various periods of time at a potential of −557 mV in a solution of 3.0 mol·m−3 Ca(H2 PO4 )2 , 7.0 mol·m−3 CaCl2 , and 6 mass%H2 O2 , using titanium plate. The process of HA formation is discussed from the perspective of the changes in current, mass, and surface morphology. The changes in cathodic current are shown in Fig. 6. The current showed characteristic profiles with good reproducibility in six experiments of various durations. The absolute value of the cathodic current decreased for the initial 800 s, then increased for the next 700 s, before decreasing once again. This change in current was also observed for the Ti QCM electrode in Fig. 1(a). The morphology of the surface deposits was examined after electrolysis at −557 mV for 400 to 3600 s, as shown in Fig. 7. For periods up to 800 s, which correspond to the period of cathodic current decrease, only HA nucleation is observed on the titanium electrode. A HA network forms after 1500 s due to the growth of crystal over the entire titanium surface. Therefore, the change in the absolute cathodic current during the interval from 800 to 1500 s corresponds to the processes of HA formation, that is, nucleation occurs before 800 s and crystal growth after 1500 s, with a transition period in between. During the transition period, when crystal growth starts, the hydroxide ions that form on the titanium electrode are quickly consumed to form HA. This is described by Reaction 2, and corresponds to the increase in the cathodic current. The results in Fig. 1(a) confirmed that the mass due to HA growth accelerates significantly after 800 s. The HA film deposited resembled a porous. Fig. 6 Changes in cathodic current density in electrolysis for various durations in the solution containing 3.0 mol m−3 Ca(H2 PO4 )2 , 7.0 mol m−3 CaCl2 and 6 mass%H2 O2 at pH 5.5, 309.5 K under the potential of −557 mV.. reticulum, as shown in Fig. 2. It has been reported that HA can precipitate from simulated body fluid on titanium that has been immersed in alkaline solution.15, 16) Titanium gelates in alkaline solution, inducing HA formation. From the QCM measurement for the Ti electrode in cathodic conditions, the mass gain was about 0.8 g·m−2 within 800 s, and then remained constant in every case in Fig. 1. Titanium is naturally covered with a very thin passive film of titania. When a cathodic current supplies OH− ions, it is assumed that a OH− ion chemisorb on a Ti atom with a 001 crystal face. The theoretical mass gain is calculated to be 370 µg·m−2 , which is 103 times smaller than the measured value, 0.8 g·m−2 . This study clearly demonstrates.
(5) 3014. M. Okido et al.. Fig. 7 Change in surface morphology after electrolysis for various durations in the solution containing 3.0 mol m−3 Ca(H2 PO4 )2 , 7.0 mol m−3 CaCl2 and 6 mass%H2 O2 at pH 5.5, 309.5 K under the potential of −557 mV.. that a titanium reaction under cathodic conditions is not possible; however, the initial mass gain on the Ti may be caused by gelation of the Ti surface in the alkaline media produced by the cathodic reaction. 4. Conclusions Hydroxyapatite is formed on titanium electrodes under cathodic polarization. The relationships between the change in cathodic current and electrode mass and the change in the morphology of the deposited hydroxyapatite were examined. HA was deposited under electrolysis at −557 mV, and the amount significantly increased after 800 s, as measured by the mass gain using QCM. With HA growth, the cathodic current decreased, increased once, and then continued to decrease. The hydroxyapatite film formed was porous and the pores were several hundred nanometers in size; the filling factor was about 59 vol%. Microscopically, the HA films consisted of a network of aggregates with walls about 50 nm thick. Acknowledgements This work was supported by the research project “Biomimetic Materials Processing” (No. JSPS-RFTF 99R13101) of Japan Society for the Promotion of Science.. REFERENCES 1) L. L. Hench and J. Wilson (ed.): An Introduction to Bioceramics, (World Scientific Publishing, 1993). 2) M. Okido, R. Ichino, K. Kuroda, R. Ohsawa and O. Takai: Mineralization in Nature and Synthetic Biomaterials, MRS, 599 (2000) 153. 3) K. Kuroda, R. Ichino, M. Okido and O. Takai: J. Biomed. Mater. Res. 59 (2002) 390. 4) K. Kuroda, R. Ichino, M. Okido and O. Takai: J. Biomed. Mater. Res. 61 (2002) 354. 5) T. Hara, K. Hayashi, Y. Nakashima, T. Kanemaru and Y. Iwamoto: J. Bone and Joint Surgery B 81 (1999), 705. 6) L. Chou, B. Marek and W. R. Wagner: Biomaterials 20 (1999) 977. 7) M. Browne and P. J. Gregson: Biomaterials 21 (2000) 385. 8) J. Redepenning and JP. McIsaac: Chemistry of Materials 2 (1990) 625. 9) M. Shirkhanzadeh: J. Mater. Sci. Lett. 10 (1991) 1415. 10) M. Shirkhanzadeh: J. Mater. Sci. Lett. 12 (1993) 16. 11) H. Monma: J. Mater. Sci. 29 (1994) 949. 12) S. Ban, S. Maruno and H. Itoh: J. Biomedical Materials Research 28 (1994) 65. 13) J. M. Zhang, C. J. Lin, Z. D. Feng and Z. W. Tian: J. Electroanal. Chem. 452 (1998) 235. 14) H. Monma: J. Ceram. Soc. Jpn. 101 (1993) 737. 15) H. M. Kim, F. Miyaji and T. Kokubo: J. Ceramic Society of Japan 105 (1997) 111. 16) T. Kokubo, F. Miyaji and H. M. Kim: J. American Ceramic Society 79 (1996) 1127..
(6)
Figure
Related documents
We deduced that the clinical outcomes did not only rely on high VEGF serum level in early phase of stroke, but also on its dynamic in acute and after acute-phase of stroke.
For establishments that reported or imputed occupational employment totals but did not report an employment distribution across the wage intervals, a variation of mean imputation
• Crop protection/plant biotechnology creates over $6.4 billion in value through additional yields and quality attained by producers of field crops; over $358 million in
PC3 cells were transfected with siRNA pools targeting ARC (stress fibres), FMNL1 (cortical actin), PDZK8 (actin patches), ZMYM4 (very elongated), FAM40B (elongated), or
financial statement fraud. Hal ini dikarenakan rendahnya rata-rata kepemilikan manajerial yaitu hanya sebesar 2,21% sehingga ada pemisahan yang jelas antara pemegang
The first time you plug U3 Smart Drive into the computer, Windows automatically recognizes the drive and set the Add New Hardware wizard to work, identifying not one but two
We propose an integrated ranking of MeSH terms, PubMed number of citations, author PubMed h-index, journals impact factor, authors’ number of PubMed publications and the
The lead guard position will be captained by a pair of seniors who will likely play together for a majority of the minutes. Alex Barcello, who transferred from Arizona before
