Evaluation of the genetic variability in bamboo using
RAPD markers
S. Nayak, G.R. Rout, P. Das
Regional Plant Resource Centre, Bhubaneswar, Orissa, India
ABSTRACT
Classical taxonomic studies of the bamboos are based on floral morphology and growth habit, which can cause problems in identification due to erratic flowering. Identification and genetic relationships in 12 species of bamboo were investigat-ed using random amplifiinvestigat-ed polymorphic DNAs (RAPD) technique. Analysis startinvestigat-ed by using thirty 10-mer primers that allowed us to distinguish 12 species and to select a reduced set of primers. The selected primers were used for identifica-tion and for establishing a profiling system to estimate genetic diversity. A total of one hundred thirty seven distinct polymorphic DNA fragments (bands), ranging from 0.4–3.3 kb were amplified by using 10 selected primers. The genetic similar analysis was conducted based on presence or absence of bands, which revealed a wide range of variability among the species. Cluster analysis clearly showed two major clusters belonging to 12 species of bamboo. Two major clusters were further divided into three minor clusters. The species of Bambusa vulgaris and Bambusa vulgaris var. striata were the most closely related and formed the first minor cluster along with Bambusa ventricosa. The variety of Bambusa multiplex var. Silver stripe and Bambusa multiplex were very closely related and there was no variation with Bambusa ventricosa. Another minor cluster was obtained between Bambusa arundinacea, Cephalostachyum pergracil and Bam-busa balcooa. The RAPD technique has the potential for use in species identification and genetic relationships between taxa and species of bamboo for breeding program.
Keywords: bamboo; genetic variability; phylogenetic relationships; RAPD analysis
Germplasm characterization is an important link be-tween the conservation and utilization of plant genetic resources. Traditionally, morphological characters like growth habit, leaf type, floral morphology have been used to define taxa. Majority of plant taxa were defined morphologically and in most cases, this is still poor tax-onomic description. Molecular DNA techniques allow re-searchers to identify genotypes at the taxonomic level, assess the relative diversity within and among the spe-cies and locate diverse accessions for breeding purpos-es. Moreover, the commercial value associated with identifying useful traits creates a direct value on gene banks ensuring long-term preservation of a collection. RAPD assay is the cheapest method for identifying the genotypes within a short period and also requires only limited amount of DNA. The development of randomly amplified polymorphic DNA (RAPD) markers, generated by the polymerase chain reaction (PCR) using arbitrary primers, has provided a new tool for the detection of DNA polymorphism (Williams et al. 1990). RAPD analy-sis has been used to study genetic relationship in a num-ber of grasses (Huff et al. 1993, Gunter et al. 1996, Kolliker et al. 1999, Nair et al. 1999).
Bamboo is an important member of the grass family in the tribe Bambuseae, distributed in the tropical and sub-tropical regions of the world. It is used for food, fodder, building material and a raw material for production of paper (Das and Rout 1994). Breeding process was slow due to irregular flowering. To enlarge this genetic base, we need to utilize the genetic variability found in
differ-ent species and genera of the Bambusa complex. In this context, information on the phylogeny and genetic diver-sity of available germplasm is essential for the identifica-tion of potential germplasm groups and for optimising hybridisation and selection procedures. In this investi-gation, we used RAPD markers to study the genetic vari-ation among different species and to determine the genetic similarities between species.
MATERIAL AND METHODS
Plant materials. Twelve taxa of bamboo namely Bam-busa vulgaris Schrader ex Wendl, Bambusa vulgaris var. striata Schrad ex Wendl, Bambusa ventricosa Maclure,
Bambusa multiplex var. Silver stripe, Bambusa multiplex
(Lour.) Raeushel ex. Schult & Sehult.f, Bambusa arundi-nacea Willd., Bambusa balcooa Roxb., Dendrocalamus giganteus Munro, Dinocloa m’Clellandi Kurz., Cepha-lostachyum pergracil Munro, Dendrocalamus strictus
and Sasa species Makino & Shibata were collected from the Bambusetum established at Regional Plant Resource Centre, Bhubaneswar. The leaf materials were used for DNA isolation with three replications.
0.2% β-mercaptoethanol (v/v), 100mM Tris-HCl (pH 8.0), 2mM EDTA, 1.4M NaCl] were then added per 2 g of fresh material. The DNA pellet was resuspended in 200–300 µl of Tris-EDTA (10–1mM). DNA quantifications were per-formed by visualising under UV light, after electrophore-sis on 0.8% agarose gel. The resuspended DNA was then diluted in sterile distilled water to 5 ng/µl concentration for use in amplification reactions.
PCR amplifications. A set of thirty random decamer oligonucleotides purchased from Operon Technologies Inc. (Alameda, California, USA) was used as single prim-ers for the amplification of RAPD fragments. Polymerase Chain Reactions (PCR) were carried out in a final volume of 25 µl containing 20 ng template DNA, 100µM each deoxynucleotide triphosphate, 20 ng of decanucleotide primers, 1.5mM MgCl2, 1 × taq buffer [10mM Tris-HCl (pH 9.0), 50mM KCl, 0.01% gelatin] and 0.5 U taq DNA polymerase (M/S Bangalore Genei, India). Amplification was achieved in a PTC 100 thermal cycler (MJ Research, USA) programmed for a preliminary 4 min denaturation step at 94°C, followed by 45 cycles of denaturation at 94°C for 1 min, annealing at 37°C for 1 min and extension at 72°C for 2 min, finally at 72°C for 10 min. Amplification products were separated alongside a molecular weight marker (1 kb ladder, MBI Fermentas, USA) by electro-phoresis on 1.2% agarose gels run in 0.5X TAE (Tris Acetate EDTA) buffer, stained with ethidium bromide and visualized under UV light. Gel photographs were scanned through Gel Doc System (Gel Doc. 2000, BioRad, USA) and the amplification product sizes were evaluated us-ing the software (Quantity one, BioRad, USA).
Data analysis. Data were recorded as presence (1) or absence (0) of amplified products from the examination of photographic negatives. Each amplification fragment was named by the source of the primer, the kit letter or number, the primer number and its approximate size in base pairs. Bands with similar mobility to those detected in the negative control, if any, were not scored. Similarity index was estimated using the Dice coefficient of similar-ity (Nei and Li 1979). Cluster analyses were carried out on similarity estimates using the unweighted pair-group
method with arithmetic average (UPGMA) using NTSYS-PC, version 1.80 (Rohlf 1995).
RESULTS AND DISCUSSION
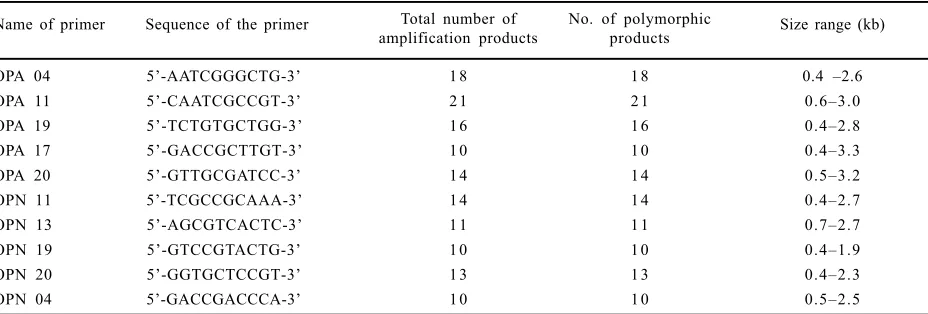
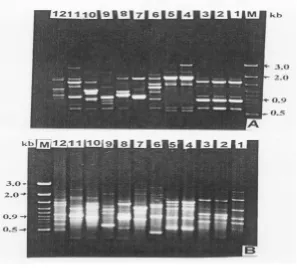
Identification and genetic relationships in bamboo is very difficult because of the lack of morphological differ-ences and erratic flowering. Authentic identification of taxa is necessary both for breeders to ensure protection of intellectual property right and also for propagators and consumers. The traditional method of identifying species by morphological characters is now gradually being re-placed by protein that is more reliable or DNA profiling largely because of several limitations of morphological data. In recent years, DNA profiling through RAPD tech-nique has been used for the analysis of diversity and identification of duplicates within the large germplasm populations (Virk et al. 1995), phylogenetic relationship (Millan et al. 1996), rational designing of breeding pro-grams (Powell et al. 1996), and management of genetic resources (Bretting and Widrelechner 1995). Evidently, RAPD technology is a rapid and sensitive technique, which can be used to estimate relationships between closely, and more distantly related species and groups of bamboo. The primer-screening step resulted in 10 decam-er primdecam-ers which, detected good polymorphisms (Table 1) and 20 other random primers, which did not give any am-plification products. The reproducibility of the amplifica-tion products was tested on template DNA from three independent extractions of two initial clumps, using leaf samples in different seasons. The amplification profiles of total genomic DNA from twelve bamboo species with ten random primers produced a total of one hundred thir-ty seven fragments ranging in size from 0.4–3.3 kb, out of which all were polymorphic (Table 2). The number of frag-ments produced by a primer ranged from 10 (OPN 9) to 21 (OPA 11). Pattern of RAPD fragments produced by the random primer OPA 11 and OPA 04 are shown in Figure 1. Figure 1 also depicts that monomorphic fragments (bands) occur between Bambusa vulgaris, Bambusa
vul-Table 1. Total number of amplified fragments and number of polymorphic fragments generated by PCR using selected random decamers
Name of primer Sequence of the primer Total number of No. of polymorphic Size range (kb) amplification products products
[image:2.595.60.524.602.759.2]garis var. striata and Bambusa ventricosa. The similarity matrix obtained using Nei and Li’s coefficient (Nei and Li 1979) is shown in Table 2. Similarity coefficients ranged from 0.11–0.82 in twelve species of bamboo tested in the present experiment. These similarity coefficients were used to generate a tree for cluster analysis using UPG-MA method (Figure 2). Two types of comparisons were
[image:3.595.58.524.71.248.2]carried out to evaluate the degree of genetic diversity and relationships in the bamboo germplasm collection i.e. among groups (which represent mostly groups of taxa), as well as between bamboo species. The cluster analysis indicates that 12 taxa belonging to different genera of bamboo formed two major clusters based on similarity indices. Both major clusters were further divided into
Table 2. Similarity matrix for Nei and Li’s coefficient of twelve different taxa of bamboo
1 2 3 4 5 6 7 8 9 1 0 1 1 1 2
1 1
2 0.82 1
3 0.62 0.69 1
4 0.22 0.20 0.21 1
5 0.18 0.19 0.16 0.68 1
6 0.26 0.32 0.20 0.27 0.18 1
7 0.20 0.25 0.24 0.16 0.20 0.27 1
8 0.20 0.20 0.11 0.20 0.25 0.29 0.27 1
9 0.21 0.23 0.20 0.20 0.16 0.25 0.24 0.29 1
1 0 0.26 0.25 0.23 0.31 0.33 0.20 0.19 0.25 0.12 1
1 1 0.26 0.27 0.23 0.15 0.13 0.23 0.22 0.14 0.33 0.18 1
1 2 0.12 0.15 0.18 0.37 0.34 0.22 0.23 0.21 0.17 0.22 0.17 1
1 – Bambusa vulgaris, 2 – Bambusa vulgaris var. striata, 3 – Bambusa ventricosa, 4 – Bambusa multiplex var. Silver stripe, 5 – Bambusa multiplex, 6 – Bambusa arundinacea, 7 – Bambusa balcooa, 8 – Cephalostachyum pergracil, 9 – Dendrocalamus giganteus, 10 – Dendrocalamus strictus, 11 – Dinocloa m’Clellandi, 12 – Sasa species
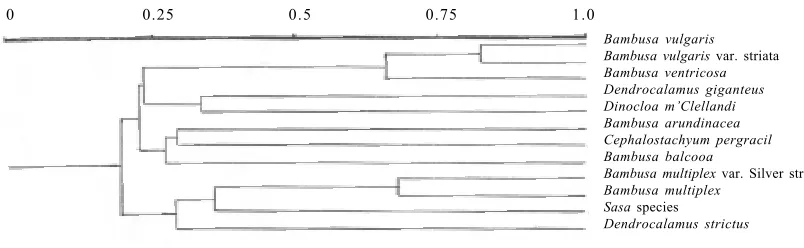
[image:3.595.144.441.434.703.2]three minor clusters. First minor cluster comprises B. vul-garis, B. vulgaris var. striata, B. ventricosa, Dendroca-lamus giganteus and Dinocloa m’Clellandi. Bambusa vulgaris and B. vulgaris var. striata exhibit about 80% similarity because of two varieties. As per the cluster analysis, B. ventricosa was closely related (about 60% similarity) with B. vulgaris var. striata. It is clearly evi-dent from the Figure 2 that the monomorphic bands ap-peared between these two species. Chua et al. (1996) reported that B. ventricosa was only a cultivated variety of a B. vulgaris. The second minor cluster was formed by B. arundinacea, B. balcoa and Cephalostachyum pergracil. Bambusa arundinacea showed about 20% similarity with Bambusa vulgaris and about 30% with
Bambusa ventricosa. Third minor cluster comprises with four taxa i.e. B. multiplex, B. multiplex var. Silver stripe,
Sasa sps and Dendrocalamus strictus. Among these,
B. multiplex and B. multiplex var. Silver stripe were two varieties and very close to each other. Interestingly, it was noted that two species of Dendrocalamus were not grouped into a single cluster. While D. giganteus was present in the first cluster along with climbing bamboo
Dinocloa. Dendrocalamus strictus was associated with
Sasa sps and B. multiplex group. The RAPD analysis indicate that Dendrocalamus giganteus showed about 34% similarity to Bambusa ventricosa, and 20% similar-ity to Bambusa vulgaris var. striata and B. vulgaris. In-terestingly, the species of Dendrocalamus strictus
showed about 70% similarity with Sasa sps. Our results show that B. vulgaris, B. vulgaris var. striata were a more closely related group in the genus Bambusa, from which
D. strictus and D. giganteus were having considerable divergence. These results are in close correspondence with the earlier phylogenetic studies in Phyllostachys
(Poaceae), based on RFLP’s (Friar and Kochert 1994) and RAPD (Gielis et al. 1997). Besides, the divergence was higher between the genus Sasa and Bambusa, Bambusa
and Dendrocalamus. Bambusa vulgaris showed a relatively higher level of divergence with Sasa sps and a relatively lower level of divergence with Dendrocala-mus sps, suggesting a genetic progression of the taxa. The matrix analysis showed two different cluster groups of Dendrocalamus strictus and D. giganteus, though it belongs to same genus. Loh et al (2000) reported that two
species of Dendrocalamus i.e. D. giganteus and D. bran-dissi were grouped into two different clusters. The ap-pearance of two different cluster groups was due to growth habit and morphological characteristics. In sum-mary, the results from this study indicate that the RAPD technique is a useful tool for the identification of germ-plasm analysis and genetic relationships between and within the bamboo species. The relatively large number of polymorphisms obtained seems due to large phyloge-netic distance among these taxa. It would allow a more quantitative assessment of genetic distances between species. Such an analysis, together with data from other classical methods, could thus be used to make a more accurate reconstruction of the bamboo evolution. Fur-thermore, such an approach might be helpful in identify-ing taxa of potential value in genetic improvement programmes.
Acknowledgement
The first author (SN) is thankful to Council of Scientif-ic Industrial Research (CSIR) for providing fellowship for conducting the experiment. The authors are also thank-ful to Department of Forest and Environment, Govern-ment of Orissa for providing necessary facility.
REFERENCES
Bretting P.K., Widrelechner M.P. (1995): Genetic markers and horticultural germplasm management. Hort. Sci., 30: 1349–1356.
Chua K.S., Soong B.C., Tan H.T.W. (1996): The bamboos of Singapore. Int. Plant Genet. Res. Inst., Singapore: 30–32. Das P., Rout G.R. (1994): Analysis of current methods and
approaches on the micropropagation of bamboo. Proc. Nat. Acad. Sci., India, 64: 235–246.
Doyle J.J., Doyle J.L. (1990): Isolation of plant DNA from fresh tissue. Focus, 12: 13–15
[image:4.595.95.497.57.181.2]Friar E., Kochert G. (1994): A study of genetic variation and evolution of Phyllostachys (Bambusoideae, Poaceae) using nuclear restriction fragment length polymorphisms. Theor. Appl. Genet., 89: 265–270.
Figure 2. UPGMA dendrogram of cluster analysis of RAPD markers illustrating the genetic relationships among the 12 species of bamboo
0 0.25 0.5 0.75 1.0
Bambusa vulgaris Bambusa vulgaris var. striata
Bambusa ventricosa Dendrocalamus giganteus Dinocloa m’Clellandi Bambusa arundinacea Cephalostachyum pergracil Bambusa balcooa
Bambusa multiplex var. Silver stripe
Bambusa multiplex Sasa species
Gielis J., Everaert I., De Loose M. (1997): Genetic variability and relationships in Phyllostachys using random amplified polymorphic DNA. In: Chapman G.P. (ed.): The bamboos. Linn. Soc Symp. Ser. 19: 107–124.
Gunter L.E., Tuskan G.A., Wullschleger S.D. (1996): Diver-sity among populations of switchgrass based on RAPD markers. Crop Sci., 36: 1017–1022.
Huff D.R., Peakall R., Smouse P.E. (1993): RAPD variation within and among natural populations of outcrossing buffa-lograss [Buchloe dactyloides (Nutt.) Engelm.]. Theor. Appl. Genet., 86: 927–934.
Kolliker R., Stadelmann F.J., Reidy B., Nosberger J. (1999): Genetic variability of forage grass cultivars: A comparison of Festuca pratensis Huds., Lolium perenne L., and Dac-tylis glomerata L. Euphytica, 106: 261–270.
Loh J.P., Kiew R., Set O., Gan L.H, Gan Y.Y. (2000): A study of genetic variation and relationships within the bamboo Subtribe Bambusinae using amplified fragment length poly-morphism. Ann. Bot., 85: 607–612.
Millan T., Osuna F., Cobos S., Torres A.M., Cubero J.J. (1996): Using RAPDs to study phylogenetic relationships in Rosa. Theor. Appl. Genet., 92: 273–277.
Nair N.V., Nair S., Sreenivasan T.V., Mohan M. (1999): Anal-ysis of genetic diversity and phylogeny in Saccharum and related genera using RAPD markers. Genet. Res. Crop Evol., 46: 73–79.
Nei M., Li W.H. (1979): Mathematical model for studying ge-netic variation in terms of restriction endonucleases. Proc. Nat. Acad Sci., USA, 76: 5269–5273.
Powell W., Morgante M., Andre C., Hanafey M., Vogel J., Tingey S., Rafalski, A. (1996): The comparison of RFLP, RAPD, AFLP and SSR (microsatellite) markers for germ-plasm analysis. Mol. Breed., 2: 225–238.
Rohlf F.J. (1995): NTSYS-PC Numerical taxonomy and mul-tivariate analysis system. Version 1.80. Exeter Software, Setauket, New York.
Virk P.S., Ford-Lloyd B.V., Jackson M.T., Newbury H.J. (1995): Use of RAPD for the study of diversity within plant germplasm collections. Heredity, 74: 170–179. Williams J.G.K., Kubelik A.R., Livak K.J., Rafalski J.A.,
Tingey S.V. (1990): DNA polymorphism amplified by ar-bitrary primers are useful as genetic markers. Nucl. Acid. Res., 18: 6531–6535.
Received on May 22, 2002
Corresponding author:
Dr. Gyana Ranjan Rout, Plant Biotechnology Division, Regional Plant Resource Centre, Bhubaneswar, 751 015 Orissa, India tel.: + 91 674 553 845, fax: + 91 674 550 274, e-mail: [email protected]
ABSTRAKT
Hodnocení genetické variability u bambusu pomocí markerů RAPD
Tradiční taxonomické studie bambusů vycházejí z květní morfologie a charakteristického růstu, což může kvůli nepravidel-nému kvetení působit obtíže při identifikaci druhů. Zabývali jsme se identifikací a genetickou příbuzností u 12 druhů bam-busu za použití metody náhodně amplifikovaných polymorfních DNK (RAPD). Analýza začala u 30 primerů o 10 merech, která umožnila rozlišení 12 druhů a výběr menšího souboru primerů. Vybrané primery jsme použili k identifikaci a založení profilového systému k vyhodnocení genetické rozmanitosti. Pomocí 10 vybraných primerů jsme provedli amplifikaci cel-kem 137 rozdílných polymorfních fragmentů (pruhů) DNK v rozsahu 0,4–3,3 kb. Obdobnou genetickou analýzu jsme pro-vedli na základě přítomnosti nebo nepřítomnosti pruhů, která poukázala na široký rozsah variability mezi jednotlivými druhy. Klastrová analýza jednoznačně naznačila dva hlavní klastry, které náležely 12 druhům bambusu. Dva hlavní klastry jsme dále rozdělili na tři vedlejší klastry. Nejtěsnější příbuznost jsme zjistili mezi druhy Bambusa vulgaris a Bambusa vulgaris var. striata, které představovaly první vedlejší klastr spolu s Bambusa ventricosa. Blízce příbuzné byly odrůdy
Bambusa multiplex var. Silver stripe a Bambusa multiplex a nijak se nelišily od Bambusa ventricosa. Další vedlejší klastr jsme získali mezi Bambusaarundinacea, Cephalostachyum pergracil and Bambusa balcooa. Existuje potenciální možnost využití metody RAPD ve šlechtitelských programech k identifikaci druhů a genetických příbuzností mezi taxony a druhy bambusu.