Unsupervised Classification of Data Streams based
on Typicality and Eccentricity Data Analytics
Bruno Sielly Jales Costa
∗, Clauber Gomes Bezerra
†, Luiz Affonso Guedes
‡and Plamen Parvanov Angelov
§ ∗Campus Natal - Zona NorteFederal Institute of Rio Grande do Norte - IFRN Natal, Brazil
Email: [email protected] †Campus EaD
Federal Institute of Rio Grande do Norte - IFRN Natal, Brazil
Email: [email protected]
‡Department of Computer Engineering and Automation
Federal University of Rio Grande do Norte - UFRN Email: [email protected]
§Lancaster University, Data Science Group, School of Computing and Communications,
Lancaster LA1 4WA, United Kingdom
Chair of Excellence, Carlos III University, Madrid, Spain Email: [email protected]
Abstract—In this paper, we propose a novel approach to un-supervised and online data classification. The algorithm is based on the statistical analysis of selected features and development of a self-evolving fuzzy-rule-basis. It starts learning from an empty rule basis and, instead of offline training, it learns “on-the-fly”. It is free of parameters and, thus, fuzzy rules, number, size or radius of the classes do not need to be pre-defined. It is very suitable for the classification of online data streams with real-time constraints. The past data do not need to be stored in memory, since that the algorithm is recursive, which makes it memory and computational power efficient. It is able to handle concept-drift and concept-evolution due to its evolving nature, which means that, not only rules/classes can be updated, but new classes can be created as new concepts emerge from the data. It can perform fuzzy classification/soft-labeling, which is preferred over traditional crisp classification in many areas of application. The algorithm was validated with an industrial pilot plant, where online calculated period and amplitude of control signal were used as input to a fault diagnosis application. The approach, however, is generic and can be applied to different problems and with much higher dimensional inputs. The results obtained from the real data are very significant.
Index Terms—classification, data streams, unsupervised, evolv-ing systems, autonomous learnevolv-ing, real-time, TEDA, typicality, eccentricity, clustering, fuzzy classification, soft-labeling.
I. INTRODUCTION
Classification of multidimensional data is a computational intelligence problem that has gaining considerable atten-tion for the last few decades. The vast majority of ap-proaches presented in literature focus on the the problem of supervised/semi-supervised/unsupervised classification based on the traditional modeling of large data sets, where classifica-tion is performed only after extensive training and/or complex parameter configuration.
Among the many strong classification algorithms in litera-ture, one can mention support vector machines (SVMs) [1], neural networks [2], k-nearest neighbohrs (k-NN) [3], [4] and so on. Although there are many consolidated techniques, for obvious reason, in general, they are not suitable for the specific problem of classification of data streams, where one needs to handle continuous-flow and high-dimensional data under strong computational and time constraints.
Techniques for the specific problem of data stream classi-fication have been proposed by [5], [6], [7] and many others. However, most of the proposed approaches are not able to deal with the problems of concept-drift and concept-evolution, where the algorithm must continuously adapt to cope with the natural and dynamic change of the data and, moreover, be able to recognize new classes that might emerge when new data samples are read.
As possible solutions to the mentioned problem, one can mention the works of [8], [9] and [10]. Still, some of the presented approaches might not be considered asfullyonline, since they often require offline batch training and/or processing of “data windows”, resulting in increasing computational cost. As another major requirement for the proposed classifier, soft-labeling should be considered. Instead of the traditional mutually exclusive labels, soft-labeling classifiers designate different fuzzy membership degrees from a particular data sample to all existing classes. This approach is very desirable and, many times preferable over strictly automatic classifi-cation, in several challenging real-world problems, such as medical diagnosis [11], fault detection and identification in industrial processes and so on.
pro-posed by [12], [13], [14] and many others. However, similarly to the examples previously mentioned, in the vast majority of times, they are not suitable for classification of real-time data streams.
Here we propose a new class of unsupervised fuzzy classi-fier that builds upon the family of evolving classiclassi-fiers proposed by [15], [16], [17] and [18]. In general, this new classifier should aggregate the main characteristics of the state-of-the-art evolving classifiers and be able to perform fuzzy classification of real-time data streams in a fully online manner, recursively, with very low computational cost, starting from an empty knowledge basis and developing with each newly arrived data sample, handling concept-drift and concept-evolution without the need of any prior knowledge about the data (e.g. number of classes, labels, data distribution);
The remainder of the paper is organised as follows. In Section II, the proposal is presented in details. Section III presents the experiments and results obtained. Finally, Section IV concludes the paper.
II. PROPOSALDETAILS
The proposed approach to unsupervised classification of data streams relies on the recently introduced concept of Typicality and Eccentricity Data Analytics (TEDA). TEDA was recently introduced by [19] and, since then, applied to different real-world problems, such as fault detection [20], [21]. Since it is an unsupervised approach, the, the data are grouped considering the spatial distance in the n-dimensional feature space. However, instead of the traditional clusters, the proposed algorithm works with the concepts of data clouds.
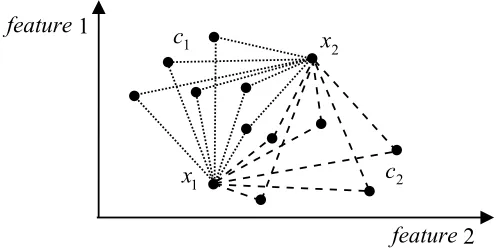
Data clouds are granular structures with no pre-defined shape or boundaries. They directly represent all previous data observations. An example of two data clouds on a 2-dimensional feature space is illustrated in Figure 1.
x
1x
2●
●
●
●
●
●
●
●
●
●
●
●
●
c
2c
1 [image:2.612.51.300.474.599.2]feature
2
feature
1
Fig. 1. Data clouds. Data points from cloudc1are linked with the data item
x1 using dotted lines and, respectively, the data points from cloudc2 are linked with the data itemx2using dashed lines. It is obvious that data clouds (unlike clusters) have no specific shape.
A. Knowledge basis of the classifier
A fuzzy classifier can be viewed as set of fuzzy inference rules. For a zero-order Takagi-Sugeno fuzzy system, the i-th rule of the rule basis Rhas the format of
Ri: if (x1 isAi,1 and . . . andxn is Ai,n)
thenyi=“Classi”
whereA is the set of fuzzy values for the input variables and
y is the output of the system.
The rule basis of the proposed classifier, however, is based on the concept of AnYa fuzzy systems [22]. The main advantage of AnYa is that it is free of parameters, logical connectors, aggregation operator or membership functions in the antecedent part of the fuzzy rule. Unlike Mamdani and Takagi-Sugeno systems, in which the antecedent part (if) is represented by a fuzzy set, in AnYa systems, the antecedent part relates the analyzed information to a data cloud.
The consequent part (then) of a rule in AnYa fuzzy systems can be the same as in Mamdani or Takagi-Sugeno. Consider-ing, again, a zero-order Takagi-Sygeno system, the i-th rule of the rule basisRis represented by
Ri : (~x∼ci) thenyi=“Classi”
where ∼ denotes the fuzzy membership expressed linguisti-cally as “is associated with” and ci ∈ Rn is the i-th data
cloud defined in the input space~x= [x1, x2, . . . , xn] T
is the input vector.
B. Updating the rule basis
Consider a dataset X = {x1, x2, . . . , xk, . . .} delivered as
a data stream. The membership of a data sample xk to a
particular data cloudciis given by the normalized eccentricity
ζ from the sample to the data cloud.
The proposed approach derives all equations from the tradi-tional form of TEDA [19] to a generalized form, where each data cloud is handled, independently, as a distinct data set. The eccentricityξ(xk)i, normalized eccentricityζ(xk)i, typicality
τ(xk)i and normalized typicality t(xk)i of a particular data
observationxk in relation to the data cloudci afterksamples
are given by
ξ(xk)i=
1 [si k]0
+([µ
i k]
0−x
k)T([µik]
0−x
k)
[si
k]0[[σ2]ik]0
(1)
ζ(xk)i=
ξ(xk)i
2 ,
k
X
l=1
ζ(xl)i= 1, k >= 2 (2)
τ(xk)i= 1−ξ(xk)i (3)
t(xk)i=
τ(xk)i
k−2 ,
k
X
l=1
t(xl)i = 1, k >= 2 (4)
where [si k]
0, [µi k]
0 and [[σ2]i k]
0 are temporary variables that
represent the weight (i.e. the number of data points), mean and variance of the data cloud ci, respectively. These temporary
variables are calculated as
[µik]0=
[si k]0−1
[si k]0
µik−1+
1 [si k]0
xk (6)
[[σ2]ik]0 =[s
i k]0−1
[si k]0
[σ2]ik−1+ 1 [si
k]0−1
kxk−[µik]
0k (7)
For each newly arrived data samplexk, one compares if the
eccentricity ζ(xk)i of the data sample xk in relation to the
data cloud ci is high. If so, it means thatxk is significantly
different from all the data samples of ci, which causes no
practical effect to the structure of ci. If ζ(xk)i is low, which
means the data sample has a high typicality in relation to ci,
the weight, mean and variance (si
k,µ
i
kand[σ
2]i
k, respectively)
are updated with the values of[si k]
0,[µi k]
0and[[σ2]i k]
0. Finally,
ifxkis significantly different from all existingN data clouds,
a new cloud cN+1 is generated.
The threshold for deciding whether a data sample should affect a particular data cloud is based on the Chebyshev inequality [23], which states that, under any data distribution, no more than 1/m2 of the data observations are more than
mσ away from the mean, where σ represents the standard deviation of the data. Therefore, the condition to define if a data sample xk is close to a data cloud ci is
ζ(xk)i <=
m2+ 1
2si k
(8)
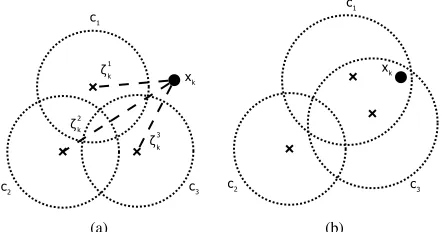
Figure 2 illustrates the influence of a newly acquire data samplexk over three existing data cloudsc1,c2andc3, at the
k-th time instant (Figure 2(a)). The normalized eccentricity of
xkin relation to each data cloud is calculated. In this example,
it is easy to see thatc1andc3are directly affected byxk (i.e.
eccentricities are low and equation 8 holds) and, thus, updated. However,xk has no influence onc2, since the equation 8 does
not hold. Therewith, c1andc3are updated, whilec2 remains unaltered (Figure 2(b)).
c2 c3
c1
xk
ζk 1
ζk3
ζk2
c2 c3
c1
xk
[image:3.612.63.301.47.107.2](a) (b)
Fig. 2. Data cloud updating: (a) cloudsc1,c2,c3and a newly arrived data samplexk(b) clouds after updating.
If, for all N existing data clouds, the equation 8 does not hold, a new cloud cN+1 is generated. The cloud cN+1 is initialized as
sNk+1= 1, µNk+1=xk, [σ2]Nk+1= 0
Figure 3(a) presents, again, the data cloudsc1,c2andc3and a newly arrived data point xk. In this case, the eccentricity of
xkis significantly high for all existing data clouds. Therefore,
a new cloudc4 is created, as illustrated in Figure 3(b).
ζk 1
ζk 2
ζk 3
c2 c3
c1
xk
c2 c3
c1
xk
c4
[image:3.612.322.556.84.180.2](a) (b)
Fig. 3. Creation of a new cloud: (a) three existing clouds,c1,c2,c3 and a newly arrived samplexkand (b) a new clusterc4
At this point, it is easy to observe that the knowledge basis of the proposed classifier is evolving and developing as new data are available. Thus, concept-drift is well is naturally adressed, as the antecedent part of the fuzzy rules (data clouds) are in constant update, as well as concept-evolution, since new classes (consequent part of the rules) are created as new concepts emerge from the data.
The size of the rule basis is autonomously managed with merge operations. At the end of each iteration, two classes (two data clouds) are merged if the number of intersection data points is higher than the actual weight of a cloud when excluding the intersection data points. Therefore, given two data clouds ci andcj, merge is performed if, at least, one of
the following conditions holds:
sik∩sjk> ski −sik∩sjk (9)
sik∩sjk> skj −sik∩sjk (10)
C. Output from the classifier
The proposed classification algorithm is based on the con-cept of soft-labeling instead of the traditional crisp labels and mutually exclusive classes. Since it is fully online (i.e. there is an output for each input xk and offline processing of
“data windows” or “data chunks” are not necessary), a vector of membership degrees to all existing (or known) classes is generated at each iteration.
The membership of each data sample xk to a particular
class ci is given by the equation 4 and relies on “how
typical/similar” a data point is from a cloud. The normalized fuzzy membershipγof a data samplexk to a classci is given
by
γci(xk) =
t(xk)i N
X
j=1
t(xk)j
(11)
whereN is the number of existing classes/data clouds. For crisp-labeling, the inference can also be produced using the well-known “winner-takes-it-all” rule [24]:
[image:3.612.64.285.475.591.2]III. EXPERIMENTS AND RESULTS
The experimental setup and results obtained are presented in this section. The proposed classification algorithm was designed and developed to meet with many particular require-ments, such as:
(a) be fully online and able to deal with real-time applications; (b) be fully autonomous, parameter-free and based on
unsu-pervised learning;
(c) start from an empty knowledge basis, without the need of offline training;
(d) be based on a fuzzy rule basis and able to perform soft-labeling;
(e) be able to deal with dynamic data, concept-drift (rule update) and concept-evolution (rule creation and merge); (f) recursively updated, without the need of storing previous
data samples in memory.
In this sense, the proposed classifier is quite unique, which would result in an unfair comparison with the existing tra-ditional parameterized and offline approaches. Moreover, the available benchmark data sets in literature may not be very suitable for validation of the proposed classifier since they are not formatted as proper data streams nor are suitable for soft-labeling.
Based on these problems, the algorithm was applied to a recently introduced benchmark for fault diagnosis in industrial processes. The benchmark was used for validation of many anomaly detection and autonomous classification approaches [17], [25], [26].
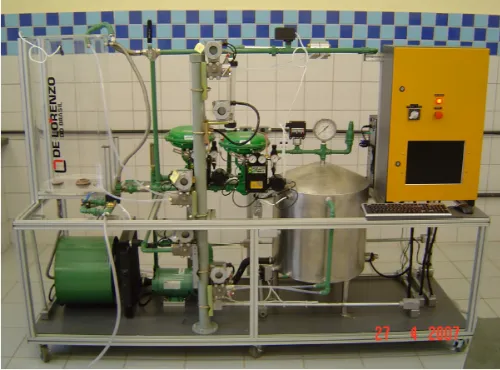
[image:4.612.312.565.255.452.2]The data set was obtained from a real-world industrial laboratory pilot plant [27], which is presented in Figure 4. The plant consists of two tanks, two valves, a centrifugal pump, a heater/cooler and a piping system. The plant is controlled by a programmable logical controller and provides data from several sensors, such as level, flow, pressure, and temperature. All sensors and actuators are real-size devices and often used in real industrial environments.
Fig. 4. Laboratory pilot plant.
The data used for validation corresponds to a stream with four faulty periods interspersed with periods of normal op-eration. The faulty data represents the occurrences of three different faults (different locations and causes) in different severity degrees.
The normal operation was ignored (handled by a fault detection system) and the faulty data were distributed in a 2-dimensional feature space, where the features correspond to online calculations of amplitude and period of the control signal on the plant under faulty conditions.
Considering the traditional crisp classification after the output generated by equation 11, the “winner-takes-it-all rule” described in equation 12 and strictly unsupervised learning (i.e. no class labels are available), the results obtained from the application of the proposed classifier to mentioned data set after the time instantk= 3254are shown in Figure 5.
Fig. 5. Results for crisp classification and unsupervised learning after the time instantk= 3254.
For this specific experiment, the algorithm returned five classes. Four of them are very representative, while “Class 5” can be consided as an outlier. The first class (red) represents a mild tank leakage fault. The second (blue) represents a
negative offseton the actuator in different degrees. The third class (green) represents a severe tank leakage. Finally, the fourth class represents a positive offseton the actuator.
It should be stressed that the classification task was per-formed fully unsupervised, online, with no pre-defined pa-rameters or offline training. That explains why classes 1 and 3 are different while they represent the same type of fault – different degrees (mild and severe) and, thus, distant in the 2-dimensional space.
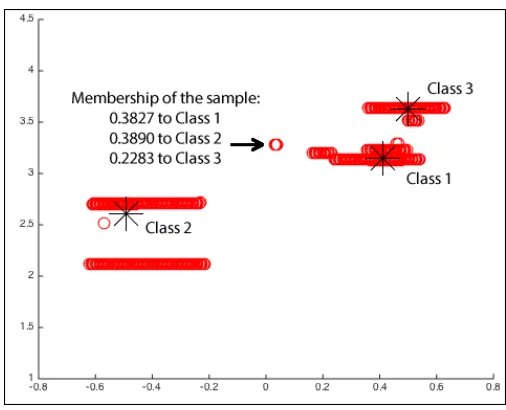
[image:4.612.49.299.512.697.2]work very well. Figure 6 illustrates an example of fuzzy membership of the data sample x1801 to three existing data clouds/classes.
Fig. 6. Example of membership for fuzzy classification and unsupervised learning at the time instantk= 1801.
Note that the fuzzy membership is calculated by equation 11 and directly based on the typicality of the data sample to each of the existing classes. Although closer to “Class 1”, the data sample x1801 is slightly more similar to “Class 2”, since the latter data cloud is heavier (i.e. higher number of data samples) and, thus, it exerts more influence over the data point.
Although able to work in a fully unsupervised manner, both for crisp and fuzzy classification, as shown in Figures 5 and 6, the proposed approach is also suitable for semi-supervised classification. It actually makes much sense in the specific case of fault diagnosis, since it could benefit from the expertise of the operator. Re-labeling and merge operations can easily be performed manually, without the need of prompt/syncronized action. From the scenario presented in Figure 5, two merge and three re-labeling operations result in a much more accurate fault diagnosis overview. Figure 7, then, illustrates the final classification resulted from fully unsupervised classification followed by a few actions from the operator.
It is important to highlight in the latter example that, even though the system correctly handled classes 2 and 3 as different faults (positive and negative offsets on the actuator, respectively), they are still close together, since both faults concern the actuator. Note also, that faults 1 and 2 are also close to each other, since leakage is logically closer to a negative change. On the other hand, classes 1 and 3 are distant from each other since they concern logically different types of problems. It is clear that, one of the main advantages of the proposed approach is that it is easily interpretable, unlike many traditional “black box” frameworks, such as neural networks.
Fig. 7. Final overview of the fault classification with semi-supervised learning.
IV. CONCLUSION
In this paper, we presented a new approach to unsupervised classification of online data streams. The algorithm is based on a fuzzy framework, works in a fully online manner, without the need of offline processing of data windows, requiring only the newly acquired data sample and a very small number of statistical information about the data instead of the actual past data samples.
The proposed algorithm can be seen as a generalized version of the recently introduced concept of TEDA. It is recursively updated and it does not require any offlline training – instead, it learns “on-the-fly”, as new data are available. It requires very low computational cost, time- and memory-wise, making it very suitable for real-time applications. It works with the concept of data clouds, which are structures with no specific shape or boundaries, unlike the traditional data clusters. Fi-nally, it does not require pre-defined models or user-defined parameters as standard techniques do, and it is completely data-driven.
The approach was validated with a fault diagnosis appli-cation. Instead of the traditional data sets in literature, the classifier was used for online and unsupervised classification of a 2-dimensional data stream acquired from different fault operation modes of a real-world industrial plant. The results obtained are very significant and encouraging, both with unsupervised learning and also with minor interaction of the human operator, in a semi-supervised manner.
ACKNOWLEDGMENT
The first author would like to thank the National Council of Scientific and Technological Development (CNPq), Brazil, for the support.
REFERENCES
[image:5.612.47.300.101.306.2][2] G. Zhang, “Neural networks for classification: a survey,”Systems, Man, and Cybernetics, Part C: Applications and Reviews, IEEE Transactions on, vol. 30, no. 4, pp. 451–462, Nov 2000.
[3] B. V. Dasarathy, “Nearest neighbor ({NN}) norms:{NN}pattern clas-sification techniques,” 1991.
[4] B. W. Silverman and M. C. Jones, “E. fix and jl hodges (1951): An important contribution to nonparametric discriminant analysis and den-sity estimation: Commentary on fix and hodges (1951),”International Statistical Review/Revue Internationale de Statistique, pp. 233–238, 1989.
[5] C. Aggarwal, J. Han, J. Wang, and P. Yu, “A framework for on-demand classification of evolving data streams,”Knowledge and Data Engineering, IEEE Transactions on, vol. 18, no. 5, pp. 577–589, May 2006.
[6] S. Hashemi, Y. Yang, Z. Mirzamomen, and M. Kangavari, “Adapted one-versus-all decision trees for data stream classification,”Knowledge and Data Engineering, IEEE Transactions on, vol. 21, no. 5, pp. 624–637, May 2009.
[7] D. Wang, P. Wu, P. Zhao, Y. Wu, C. Miao, and S. C. Hoi, “High-dimensional data stream classification via sparse online learning,” in
Data Mining (ICDM), 2014 IEEE International Conference on. IEEE, 2014, pp. 1007–1012.
[8] P. Dongre and L. Malik, “A review on real time data stream classification and adapting to various concept drift scenarios,” inAdvance Computing Conference (IACC), 2014 IEEE International, Feb 2014, pp. 533–537. [9] O. Zhenzheng, Z. Zipeng, G. Yuhai, and W. Tao, “Study on the
classification of data streams with concept drift,” inFuzzy Systems and Knowledge Discovery (FSKD), 2011 Eighth International Conference on, vol. 3, July 2011, pp. 1673–1677.
[10] M. Masud, J. Gao, L. Khan, J. Han, and B. Thuraisingham, “Classifi-cation and novel class detection in concept-drifting data streams under time constraints,”Knowledge and Data Engineering, IEEE Transactions on, vol. 23, no. 6, pp. 859–874, June 2011.
[11] L. I. Kuncheva,Fuzzy classifier design. Springer Science & Business Media, 2000, vol. 49.
[12] J. C. Bezdek, Pattern recognition with fuzzy objective function algo-rithms. Springer Science & Business Media, 2013.
[13] H. Ishibuchi, T. Nakashima, and T. Murata, “Performance evaluation of fuzzy classifier systems for multidimensional pattern classification problems,”Systems, Man, and Cybernetics, Part B: Cybernetics, IEEE Transactions on, vol. 29, no. 5, pp. 601–618, Oct 1999.
[14] S. Abe, R. Thawonmas, and M. Kayama, “A fuzzy classifier with ellip-soidal regions for diagnosis problems,”Systems, Man, and Cybernetics, Part C: Applications and Reviews, IEEE Transactions on, vol. 29, no. 1, pp. 140–148, Feb 1999.
[15] P. Angelov and X. Zhou, “Evolving fuzzy-rule-based classifiers from data streams,”Fuzzy Systems, IEEE Transactions on, vol. 16, no. 6, pp. 1462–1475, Dec 2008.
[16] P. Angelov, R. D. Baruah, and J. Andreu, “Simpl eclass: simple potential-free evolving fuzzy rule-based on-line classifiers,” in Proceed-ings of 2011 IEEE International Conference on Systems, Man and Cybernetics, SMC 2011, Anchorage, Alaska, USA, 7-9 Oct, 2011. IEEE, 2011, pp. 2249–2254.
[17] B. S. J. Costa, P. P. Angelov, and L. A. Guedes, “Fully unsupervised fault detection and identification based on recursive density estimation and self-evolving cloud-based classifier,”Neurocomputing, vol. 150, Part A, pp. 289 – 303, 2015.
[18] R. Baruah, P. Angelov, and D. Baruah, “Dynamically evolving fuzzy classifier for real-time classification of data streams,” inFuzzy Systems (FUZZ-IEEE), 2014 IEEE International Conference on, July 2014, pp. 383–389.
[19] P. Angelov, “Anomaly detection based on eccentricity analysis,” inProc. IEEE Symposium Series in Computational Intelligence (SSCI 2014), Orlando, Florida, U.S.A., Dec. 2014.
[20] B. S. J. Costa, C. G. Bezerra, L. A. Guedes, and P. P. Angelov, “Online fault detection based on typicality and eccentricity data analytics,” in
Neural Networks (IJCNN), 2015 International Joint Conference on, July 2015, pp. 1–6.
[21] C. G. Bezerra, B. S. J. Costa, L. A. Guedes, and P. P. Angelov, “A comparative study of autonomous learning outlier detection methods applied to fault detection,” inFuzzy Systems (FUZZ-IEEE), 2015 IEEE International Conference on, Aug 2015, pp. 1–7.
[22] P. Angelov and R. Yager, “A new type of simplified fuzzy rule-based systems,”International Journal of General Systems, vol. 41, no. 2, pp. 163–185, 2012.
[23] J. G. Saw, M. Yang, and T. C. Mo, “Chebyshev inequality with estimated mean and variance,”The American Statistician, vol. 38, no. 2, pp. 130– 132, 1984.
[24] H. Ishibuchi, K. Nozaki, N. Yamamoto, and H. Tanaka, “Selecting fuzzy if-then rules for classification problems using genetic algorithms,”Fuzzy Systems, IEEE Transactions on, vol. 3, no. 3, pp. 260–270, 1995. [25] B. Costa, P. Angelov, and L. A. Guedes, “A new unsupervised approach
to fault detection and identification,” inNeural Networks (IJCNN), 2014 International Joint Conference on. IEEE, 2014, pp. 1557–1564. [26] B. S. J. Costa, P. Angelov, and L. A. Guedes, “Real-time fault detection
using recursive density estimation,”Journal of Control, Automation and Electrical Systems, vol. 25, no. 4, pp. 428–437, 2014.