© 2019, IRJET | Impact Factor value: 7.211 | ISO 9001:2008 Certified Journal
| Page 4559
Dynamic Behaviour And Performance Of T Joints Under Various
Loading Conditions
Krishnadas K Das
1, Jiji Jolly
21
P.G.Student, Department of Civil Engineering, Cochin Institute of Science & Technology, Muvattupuzha,
Ernakulam, India
2
Assistant Professor, Department of Civil Engineering, Cochin Institute of Science & Technology, Muvattupuzha,
Ernakulam, India
---***---Abstract –
This paper examines the dynamic behaviour andperformance of T-joints under various loading cases by means of analytical studies. Firstly for T Joints which contain an end plate are analysed. In this analysis there was a total of 12 models. Of the 12 model 3 of them are loading conditions and 4 of them are different combinations of beams and columns. The three loading conditions considered here are load acting in tension, compression to beam and perpendicular to beam. The combination of beams and columns used are circular column and circular beam, circular column and square beam, square column and circular beam and finally square column and square beam. The same load and beam and column combination are analysed without an endplate also. Thus there was a total of 24 models. Twenty four models are analysed in finite element analysis software ANSYS Workbench 16.1. This project focussed mainly on the parametric study of T Joints under various cases with and without endplate. Conditions can occur in daily life where we have to use these T Joints of various combinations depending upon the conditions available. The T Joints which used end plate showed better results than the one used without endplate
.
Key Words: T joints, End plate, Ansys 16.1, tensile loading, Compressive loading, Finite element model
1. INTRODUCTION
Tubular structure are widely used in industrial buildings, breakwater or offshore jacket platform due to its lower response to fluid flow, fast track construction and excellent axial loads resistance, transportation and erection. They are basically load-bearing structural system. The main common configuration of tubular joints are Type T, Type K, and Type N etc. During its service period, it may be subjected to various impact loads, such as explosion and fire resulted from leaking oil and gas. During the past decades, a large number of studies have been carried out on the static behavior of tubular trusses. For, example Zhao et al. [1] performed a large number of tests on a range of rectangular and square hollow sections subjected to combined actions, De Matteis et al. [2] numerically investigated the behavior of aluminum alloy T-stub joints subjected to monotonic tensile loads, Bauer et al. [3] carried out experimental programs on static performance of simplified double-T joints and
triangular truss segments with double-K gap joints, Pengfei Cui et al. [4] examined the dynamic behavior of square tubular T-joints under impact loading by means of experimental, numerical and analytical studies and Hui Qu [5] in his paper he made a finite element model validated by experimental results is developed to numerically study the failure modes and energy dissipation mechanism of tubular T-joint impacted by a drop hammer with the initial velocity of 7-10 m/s. Moreover, design guides for square tubular joints and circular tubular joints outline the specifications for the design of tubular joints under static loading. However, tubular structures are easily subjected to axial, tensile and compressive loading, and it is necessary to understand the behavior of tubular T-joints under these loading conditions
This paper aims at the numerical analysis of the dynamic behavior of tubular hollow T-joint under various loading conditions with and without an endplate. Various loading cases considered here are perpendicular load, tensile load and compressive load by means of a method that takes into account the possibility of displacement of column and beam joints. The influence in bearing capacity of T Joints with and without endplate were obtained under different loading conditions like point loads, tensile loads and compressive load.
This study is done for evaluation of strength behavior, stress distribution, and load deflection by FEA with circular column and circular beam section, circular column and square beam section, square column and circular beam section and square column and square beam section. The perpendicular load, tensile load and compressive loads are applied on all cases. By analyzing the load- deflection performance criteria of all sections the best model was determined. Finally, the numerical simulations are utilized to investigate the failure mechanism of T-joints under each loading cases by an equivalent area method and the yield line theory.
2. NUMERICAL MODEL AND ANALYSIS
© 2019, IRJET | Impact Factor value: 7.211 | ISO 9001:2008 Certified Journal
| Page 4560
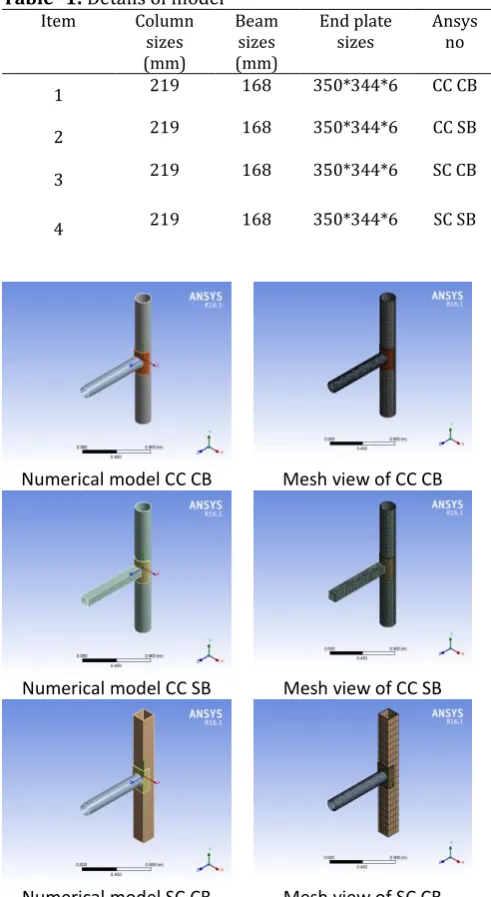
non-linearity. Therefore, all elements (profiles, bearing [image:2.595.308.546.101.216.2]plates, welding) constituting the experimental specimen were introduced to the program as non-linear material properties. Column and beam were modelled as shell elements and end-plates and welding were modelled as solid elements when performing numerical modelling. The column was considered fixed at the bottom. In reality, the connected components are related to each other frictionally. In the software as well, they are connected to each other frictionally with a friction coefficient of 0.2. Moreover, they are totally constrained by bond contact order instead of modelling the welds of sections. Figure 1 shows the overall picture of the numerical models. There was a total of four base models in which the loading conditions are applied. The dimensional parameters of all of them are given in Table 1.
Table -1: Details of model Item Column
sizes (mm)
Beam sizes (mm)
End plate
sizes Ansys no
1 219 168 350*344*6 CC CB
2 219 168 350*344*6 CC SB
3 219 168 350*344*6 SC CB
4 219 168 350*344*6 SC SB
Numerical model CC CB Mesh view of CC CB
Numerical model CC SB Mesh view of CC SB
Numerical model SC CB Mesh view of SC CB
[image:2.595.35.281.280.729.2]Numerical model SC SB Mesh view of SC SB
Fig 1-Numerical and mesh view of base models
Table -2: Material Properties Material Modulus
of elasticity
(Gpa)
Poisson’s ratio
Yielding stress (Mpa)
Ultimate stress (Mpa)
Structural
Steel 200 .3 250 550
2.1 Selected Parameters
The dimensions of the beams, columns and end plates are same in all connections. The first parametric study was change in shape of beams and columns. Two different shapes were used they are square, circular and combination of both. Thus there are a total of 4 base models based on shape. The secondly changed parameter was the presence of an end plate. Each of the four base models was analyzed with and without the endplate.
Finally three different loading conditions were considered they were perpendicular load, tensile load and compressive load. And these three loads was applied on all the four base models and with and without end plate condition. The analysis` was done in Ansys software.
3. RESULTS AND DISCUSSIONS
All the models, twenty four of them were analysed in the Ansys software and got the result as follows. Analysis was mainly done in the following criteria’s as follows.
This criteria was based on selecting the best model based on their performance in load deflection curve. The base four models are evaluated in all loading cases separately with and without an endplate.
3.1 Load acting perpendicular to beam
In this case the models with and without end plates are analyzed separately based on their performance in load deflection curve.
3.1.1 With end plate
© 2019, IRJET | Impact Factor value: 7.211 | ISO 9001:2008 Certified Journal
| Page 4561
given below. Also the load deflection curve produced by thebase models when perpendicular load act is given in Chart 1
PL-CC CB PL-CC SB
PL-SC CB PL- SC SB
Fig 2- Deformation in base models with end plate due to perpendicular load acting on beam.
Chart -1: Load deflection curve of base models having end plate with perpendicular loading acting on beam.
Chart. 1 shows that’s the load-deflection graph of the base models having end plate when a perpendicular loads acts on beam. According to this graph the circular column and circular beam (CC-CB) have the maximum perpendicular load carrying capacity than the other three models.
3.1.2 Without end plate
The four base models under perpendicular load acting on the beam without end plate conditions was analyzed. The total deformation produced by the 4 models are shown in Fig 3 given below. Also the load deflection curve produced by the base models when perpendicular load acts is given in Chart 2
PL-CC CB PL-CC SB
[image:3.595.309.558.378.542.2]PL-SC CB PL- SC SB
Fig 3- Deformation in base models without end plate due to perpendicular load acting in beam.
Chart -2: Load deflection curve of base models with no end plate under perpendicular loading acting on beam.
Chart. 2. Shows that’s the load-deflection graph of the base models without end plate when a perpendicular loads acts on beam. According to this graph the circular column and circular beam (CC-CB) have the maximum perpendicular load carrying capacity than the other three models.
In both the analysis of perpendicular loading acting on beam with and without end plate the same model CC-CB gave best performance.
3.2 Load acting in tension to beam
[image:3.595.36.288.385.545.2]© 2019, IRJET | Impact Factor value: 7.211 | ISO 9001:2008 Certified Journal
| Page 4562
3.2.1 With end plate
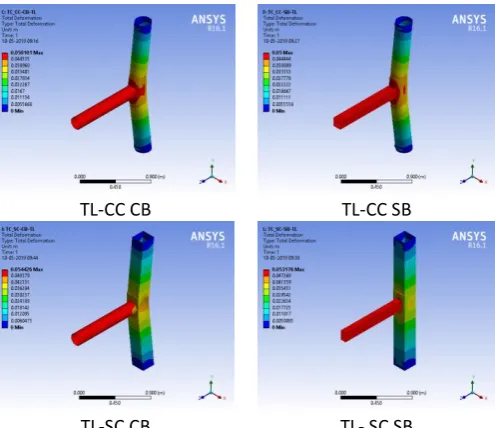
The four base models under tensile load acting on beam with end plate conditions was analyzed. The total deformation produced by the 4 models are shown in Fig 4 given below. Also the load deflection curve produced by the base models when tensile load acts is given in Chart 3.
TL-CC CB TL-CC SB
TL-SC CB TL- SC SB
Fig 4- Deformation in base models with end plate due to tensile load acting on beam.
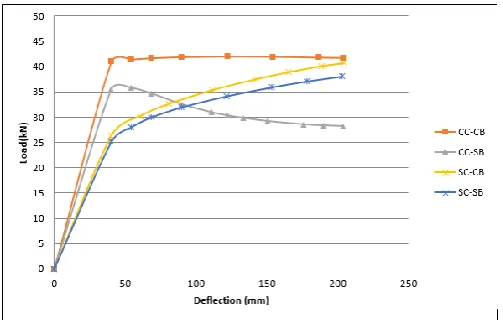
Chart -3: Load deflection curve of base models having end plate with tensile load acting on beam.
Chart. 3 shows that’s the load-deflection graph of the base models having end plate when a tensile loads acts on them. According to this graph the circular column and square beam (CC-SB) have the maximum tensile load carrying than the other three models.
3.2.2 Without end plate
The four base models under tensile load acting on beam without end plate conditions was analyzed. The total deformation produced by the 4 models are shown in Fig 5 given below. Also the load deflection curve produced by the base models when tensile load acts is given in Chart 4
TL-CC CB TL-CC SB
[image:4.595.38.286.186.400.2]TL-SC CB TL- SC SB
Fig 5- Deformation in base models without end plate due to tensile load.
Chart -4: Load deflection curve of base models with no end plate with tensile load acting on beam.
[image:4.595.38.289.450.615.2]© 2019, IRJET | Impact Factor value: 7.211 | ISO 9001:2008 Certified Journal
| Page 4563
3.3 Load acting in compression to beam
In this case the models with and without end plates are analyzed separately based on their performance in load deflection curve
3.3.1 With end plate
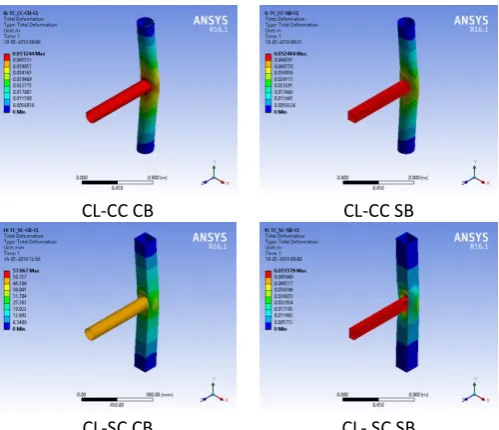
The four base models under compressive load acting on beam with end plate conditions was analyzed. The total deformation produced by the 4 models are shown in Fig 6 given below. Also the load deflection curve produced by the base models when tensile load act is given in Chart 5
CL-CC CB CL-CC SB
CL-SC CB CL- SC SB
Fig 6- Deformation in base models with end plate due to compressive load.
Chart -5: Load deflection curve of base models having end plate with compressive load acting on beam.
Chart. 5 shows that’s the load-deflection graph of the base models having end plate when a compressive loads acts on beam. According to this graph the square column and
circular beam (SC-CB) have the maximum compressive load carrying capacity than the other three models.
3.3.2 Without end plate
The four base models under compressive load acting on the beam without end plate conditions was analyzed. The total deformation produced by the 4 models are shown in Fig 7 given below. Also the load deflection curve produced by the base models when perpendicular load act is given in Chart 6
CL-CC CB CL-CC SB
[image:5.595.37.287.258.473.2]CL-SC CB CL- SC SB
Fig 7- Deformation in base models without end plate due to compressive load acting on beam.
Chart -6: Load deflection curve of base models with no end plate with compressive loading.
[image:5.595.36.288.523.688.2]© 2019, IRJET | Impact Factor value: 7.211 | ISO 9001:2008 Certified Journal
| Page 4564
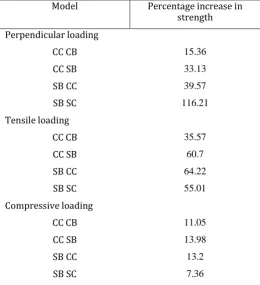
3.3 Percentage increase in strength [image:6.595.31.292.230.516.2]The percentage increase in strength of models was compared individually for both with and without end plates conditions under each load. From the calculations it was found that while using end plate the load carrying capacity of models was increased as compared to the models without end plate. The percentage increase in strength of an end plate model when compared to each models that is with and without endplate models in each loading case are tabulated in table 3. Table 3: Percentage increase in strength
Model Percentage increase in strength Perpendicular loading
CC CB 15.36
CC SB 33.13
SB CC 39.57
SB SC 116.21
Tensile loading
CC CB 35.57
CC SB 60.7
SB CC 64.22
SB SC 55.01
Compressive loading
CC CB 11.05
CC SB 13.98
SB CC 13.2
SB SC 7.36
From the above table the following facts can be drawn. In the perpendicular loading case the square beam and square column (SB SC) model showed excellent result as its strength was increased by 116 percent by using an end plate. In tensile loading case the circular column and square beam (SB CB) model gave good results as their strength increased by 64 percent by using an end plate.
In compressive loading case circular column and square beam (CC SB) model the strength increased by only 13.98 percent when using an end plate. In the compressive loading case all the models showed only a small increase in strength. The model SB CC have almost same strength as that of CC SB.
4. COMPARISON OF RESULTS
As said earlier while using end plate the strength increased. A graph showing the percentage increase in strength of all models is given in chart 7
The deflection pattern formed in all cases with and without endplate is given in chart 8. From the chart it’s clearly understood that the deflection is low in majority of cases which used end plates and in some cases they are nearly equal.
The maximum load carrying capacity of all cases with and without endplate is given in chart 9.Similar to above results the models which used end plates have high load carrying capacity.
Chart -7: Percentage increase in strength using end plate
Chart -8: Deflection comparison with and without end plate
Chart -9: Load comparison with and without end plate
5. CONCLUSIONS
© 2019, IRJET | Impact Factor value: 7.211 | ISO 9001:2008 Certified Journal
| Page 4565
-The maximum perpendicular load acting on the beam withendplate is high in circular column and circular beam model and least in circular column and square beam model. -The maximum tensile load acting on the beam with end plate is high in circular column and square beam model and least in square column and square beam model.
-The maximum compressive load acting on the beam with end plate is seen high in square column and circular beam model and least in square column and square beam model. -The maximum perpendicular load acting on the beam without endplate is high in circular column and circular beam model and least in square column and square beam model.
-The maximum tensile load acting on the beam without end plate is high in square column and circular beam model and least in square column and square beam model.
-The maximum compressive load acting on the beam without end plate is seen high in circular column and circular beam model and least in square column and square beam model. -The maximum percentage of increase in strength was seen in square column and square beam model and least increase in circular column and circular beam model with end plate when a perpendicular load acts on the beam
- The maximum percentage of increase in strength was seen in circular column and square beam model and least increase in circular column and circular beam model with end plate when a tensile load acts on the beam
- The maximum percentage of increase in strength was seen in circular column and square beam model and least increase in square column and square beam with end plate when a compressive load acts on the beam. Here in this case circular beam and square column model have percentage increase in strength near to circular column and square beam model.
REFERENCES
[1] J.A. Packer, J.Wardenier, X.-L. Zhao, G.J. Van der Vegte, Y.
Kurobane, Design Guide 3, For Rectangular Hollow Section (Rhs) Joints under Predominantly Static Loading, second ed. Comité International Pour Le Développement Et L'étude De La Construction Tubulaire, 2009.
[2] G. De Matteis, M. Brescia, A. Formisano, et al., Behaviour
of welded aluminium T-stub joints under monotonic loading, Comput. Struct. 87 (15–16) (2009) 990–1002.
[3] D. Bauer, R.G. Redwood, Triangular truss joints using
rectangular tubes, J. Struct. Eng. 114 (2) (1988) 408– 424.
[4] H. Qu, Hu YF, J.S. Huo, et al., Experimental study on
tubular K-joints under impact loadings, J. Constr. Steel Res. 122 (9) (2015) 22–29.
[5] H. Qu, A.L. Li, J.S. Huo, et al., Dynamic performance of
collar plate reinforced tubular T-joint with precompression chord, Eng. Struct. 141 (2017) 555– 570.
[6] M.R. Bambach, H. Jama, X.L. Zhao, et al., Hollow and
concrete filled steel hollow sections under transverse impact loads, Eng. Struct. 30 (10) (2008) 2859–2870.
[7] B. Liu, C.G. Soares, Plastic response and failure of
rectangular cross-section tubes subjected to transverse quasi-static and low-velocity impact loads, Int. J. Mech. Sci. 90 (4) (2015) 213–227.
[8] M. Zeinoddini, J.E. Harding, G.A.R. Parke, Axially
pre-loaded steel tubes subjected to lateral impacts (a numerical simulation), Int. J. Impact Eng. 35 (11) (2008) 1267–1279.
[9] H. Qu, J.S. Huo, C. Xu, et al., Numerical studies on
dynamic behavior of tubular T-joint subjected to impact loading, Int. J. Impact Eng. 67 (2014) 12–26.
[10] Z.L. Wang, K. Liu, C.Y. Ji, et al., Experimental and
numerical investigations on the T joint of jack-up platform laterally punched by a knife edge indenter, Ocean Eng. 127 (2016) 212–225.
[11] J. Travanca, H. Hao, Numerical analysis of steel tubular
member response to ship bow impacts, Int. J. Impact Eng. 64 (2014) 101–121.
[12] A. Formisano, R. Landolfo, F.M. Mazzolani, Robustness
assessment approaches for steel framed structures under catastrophic events, Comput. Struct. 147 (2015) 216–228.
[13] N. Jones,W.Q. Shen, A theoretical study of the lateral
impact of fully clamped pipelines. Proceedings of the Institution of Mechanical Engineers, Part E, J. Process Mech. Eng. 206 (2) (1992) 129–146.
[14] B.U. Cerik, H.K. Shin, S.R. Cho, On the resistance of steel