warwick.ac.uk/lib-publications
Manuscript version: Author’s Accepted Manuscript
The version presented in WRAP is the author’s accepted manuscript and may differ from the
published version or Version of Record.
Persistent WRAP URL:
http://wrap.warwick.ac.uk/129798
How to cite:
Please refer to published version for the most recent bibliographic citation information.
If a published version is known of, the repository item page linked to above, will contain
details on accessing it.
Copyright and reuse:
The Warwick Research Archive Portal (WRAP) makes this work by researchers of the
University of Warwick available open access under the following conditions.
Copyright © and all moral rights to the version of the paper presented here belong to the
individual author(s) and/or other copyright owners. To the extent reasonable and
practicable the material made available in WRAP has been checked for eligibility before
being made available.
Copies of full items can be used for personal research or study, educational, or not-for-profit
purposes without prior permission or charge. Provided that the authors, title and full
bibliographic details are credited, a hyperlink and/or URL is given for the original metadata
page and the content is not changed in any way.
Publisher’s statement:
Please refer to the repository item page, publisher’s statement section, for further
information.
XXX-X-XXXX-XXXX-X/XX/$XX.00 ©20XX IEEE
An Advanced Hardware-in-the-loop Battery
Simulation Platform for the Experimental Testing of
Battery Management System
Truong MN Bui WMG University of Warwick Coventry, United Kingdom
Mona Faraji Niri WMG University of Warwick Coventry, United Kingdom [email protected]
Daniel Worwood WMG University of Warwick Coventry, United Kingdom [email protected]
Truong Q Dinh WMG University of Warwick Coventry, United Kingdom
James Marco WMG University of Warwick Coventry, United Kingdom [email protected]
Abstract—Extensive testing of a battery management system (BMS) on real battery storage system (BSS) requires lots of efforts in setting up and configuring the hardware as well as protecting the system from unpredictable faults during the test. To overcome this complexity, a hardware-in-the-loop (HIL) simulation tool is employed and integrated to the BMS test system. By using this tool, it allows to push the tested system up to the operational limits, where may incur potential faults or accidents, to examine all possible test cases within the simulation environment. In this paper, an advanced HIL-based virtual battery module (VBM), consists of one “live” cell connected in series with fifteen simulated cells, is introduced for the purposes of testing the BMS components. First, the complete cell model is built and validated using real world driving cycle while the HIL-based VBM is then exercised under an Urban Dynamometer Driving Schedule (UDDS) driving cycle to ensure it is fully working and ready for the BMS testing in real-time. Finally, commissioning of the whole system is performed to guarantee the stable operation of the system for the BMS evaluation.
Keywords—hardware-in-the-loop, battery management system, electric vehicle, li-ion battery, real-time simulation.
I. INTRODUCTION
Battery management system (BMS) plays an important role in a battery storage system (BSS). The main tasks are to ensure the BSS consistently work in an optimal operation range as well as to minimise the rate of battery degradation and thermal instability. In facts, due to the fact that if multiple cells are connected in series in a battery pack, the weakest cell constrains the entire string performance. Hence, to address this issue, the BMS must have a function to manage the state-of-charge (SOC) of cells within the battery pack. One simple task is to perform the cell balancing to make the cell’s SOC equally and also to optimise the battery capacity and energy distribution. This task allows the battery can get the most life and able to provide the longest operation range. Due to the criteria of safety and stability operation of both software (SW) and hardware (HW) inside the
BMS, prior examination and validation of the BMS on a virtual battery pack within a simulation environment is absolutely necessary before employing into a real BSS.
Hardware-in-the-loop (HIL) simulation has been intensively used in many fields such as control development and verification, product and component assessment, and system performance validation [1-6]. It enables the testing of actual components of a system in conjunction with a virtual computer-based simulation in a real-time environment. When performing HIL simulation, the physical plant or system is replaced by a accurately equivalent model-based real-time simulator, which is equipped with physical inputs and outputs (I/O) ports for interfacing with the control system and other HW. Hence, HIL simulator can accurately reproduce the plant dynamics and its behaviours providing comprehensive closed-loop testing without the need for testing on real systems. This means of testing avoids complex processes in HW setup and configuration, time and cost constraints, and helps lower the risks of accident to people and equipment. Consequently, exploitation of HIL simulation in battery testing system is an efficient way, which is not only to emulate a battery pack based on any battery model, but also to provide an ideal testing environment for the BMS evaluation. As comparing to the BMS tests performed on a physical battery system, tests conducted on a HIL simulator are more cost and time saving, less complicated in setting-up the HW test bench and more secure to carry-out the experiments in cases of the testing condition is beyond the normal operating bounds, especially it is useful at the early stages of the development process or during complex fault insertion test scenarios.
emulated in real-time with the HIL simulator. The developed battery system was successfully employed in testing the functions of the BMS with different scenarios. Hagen et al., [8] employed the HIL system to simulate the BMS components which were bypassed during the testing of ECU. The sensors that normally connected to the ECU were represented by equivalent electric outputs and simulated by a real-time system using sensor models. Then, the interfaces between the ECU, components and sensors were set-up so that various failures in the system such as component/sensor short circuit, open circuit faults can be inserted and reproduced. James et al., [9] proposed a model-based framework for cell-in-the-loop simulation (CILS) in order to represent a scaled-up of individual battery cells into a complete ESS. The physical cell which was integrated within a complete model of an ESS can be exercised against realistic electrical driving cycle and thermal loads in real-time.
This paper aims to build-up a complete HIL-based VBM simulator for the testing purposes of the BMS within a simulation environment. The complete HIL-based VBM simulation system consists not only of the battery cell models, which simulate the cell behaviour within the module, and a real “live” cell but also of the communication interfaces between different HW and components within the BMS testing system to make sure the stability in operation and the accuracy of the data exchanged in real-time. The paper is organised as follows: Section II presents the battery model development for the integration of a VBM, where the 2nd order equivalent circuit
model (ECM) is investigated, coupled with an ageing strategy and a thermal model to represent the behaviour of the cell. The way to form the VBM is also introduced in this section. In Section III, the experimental set-up focused on the integration of the VBM and other peripheral HW is presented. Description of the communication interface set-up is also discussed. Then, commissioning test is carried out and the experimental results and analysis are demonstrated in Section 4. Finally, the conclusion is drawn in Section 5.
II. BATTERY MODEL DEVELOPMENT
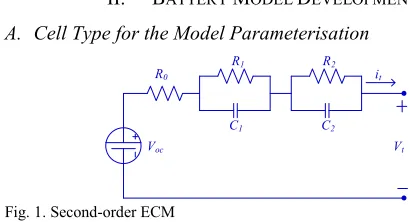
A. Cell Type for the Model Parameterisation
it R2 R1
R0
C1 C2
[image:3.612.43.248.479.590.2]Vt Voc
Fig. 1. Second-order ECM
The parameters of the battery model are identified based on a Li-ion 21700 cylindrical cell with nickel-manganese-cobalt (NMC) oxide cathode manufactured by LG (model name: INR21700-M50). Based on the datasheet of the cell, the maximum, nominal and end cut-off voltages are defined as 4.2V, 3.63V and 2.5V, respectively. The standard and maximum charge current are recommended at 1.455A (0.3C) and 3.395A (0.7C), respectively; and the standard and maximum discharge current are 0.970A (0.2C) and 7.275A (1.5C), respectively. Through experimental evaluation of the cell, the energy capacity
of the cell is found to be 5.02Ah (18.2Wh) when discharged at 0.2C from fully charged with the end cut-off voltage of 2.5V.
B. Battery Model Development
As the most appropriate battery model to perform the real-time evaluation comparing to the electrochemical models, ECMs have received many attentions in recent years. This approach simply models the battery as an empirical function [9, 10], therefore the structure of the model is relatively simple which facilitates for fast computation – an important factor for real-time testing, while still providing the performance behaviour within the battery and hence the ability to correlate the simulation output with measureable parameters such as open circuit voltage (OCV) and steady-state resistance [9].
The battery model for the HIL simulation described in this study is inherited from considerable studies in literature [11-16]. Guoliang W. et al and Lijun Z. et al, [13, 15] have studied different types of ECM and concluded that the second-order ECM is a suitable candidate, which is sufficient to model the battery dynamics. It improves the output error in both simple and complex discharging conditions as comparing to those of the first-order ECM. As such, the second-order ECM is represented in Fig. 1 to emulate the dynamics of the battery. The parameters of the model are: an internal resistance R0, two resistances R1, R2
and two capacitances C1, C2. The last four parameters describe
the transient response of the battery. The parameterisation of the model is estimated based on the experimental data obtained through the cell characterisation procedure developed in [17].
The terminal output voltage (Vt) of the second-order ECM
can be algebraic described as follows:
1 1
1 1 1
2 2
2 2 2
0 1 2
t
t
t OC t
i v
v
C R C
i v
v
C R C
V V i R v v
= −
= −
= − − −
(1)
where, VOC is the open circuit voltage; it is the driving current
goes through the model; v1 and v2 are the voltages across C1 and
C2, respectively.
C. Ageing Strategy for the Cell Model
One advantage of the simulation of battery cell using mathematical model is that it is able to simulate different behaviour of the cell by adjusting the parameters of the model easily. As descripted in [9], once keep using an aged-cell, the cell continue to degrade as its internal impedance (R0)increases
and the energy capacity reduces accordingly. For instance, to simulate the behaviour of different ageing cells, the internal impedance R0 will be adjusted using a scale factor (λ) so that
their values can be adjusted accordingly. Assume the relationship between the internal impedance and the capacity is linear dependent, the same scale factor is then applied to shrink the maximum cell’s capacity. The scaling equation is described in (2).
0 0
1
aged
aged
C C
R R
λ
λ =
=
where, Caged and C are the energy capacitance of the aged and
the original cell, respectively. R0aged and R0 are the internal
resistance of the aged and the original cell, respectively. λ is the scale factor for the aged cell (80% ≤λ≤ 100%) as a battery can be considered scrapped when the maximum capacity is reduced to 80% of the initial one.
D. Thermal Model
The thermal model employed in this study is successfully developed by Worwood D. et al., in [18]. The authors assumed that the inner cell temperature is uniform and the heat generation therefore is uniformly distributed within the cell. Heat conduction and convection were also assumed to be the only forms of heat transfer between the internal cell and the ambient environment. For a single cell modelling, thermal resistance is negligible. The governing heat conduction equation for the cell is given by:
1 1
r z
p
T T T
q k r k
t ρC r r r z z
∂ = + ∂ ∂ + ∂ ∂
∂ ∂ ∂ ∂ ∂
(3)
where, ρ is the cell density (kg/m3), T is the local cell
temperature (K), Cp is the cell heat capacity (J/kg.K). r and z are
the radial and axial positions, respectively (m), whereas, r = 0
is the location at the central of the cell (m), r = dia/2 is the location at the surface of the cell (m), z = 0 is the location at the bottom tab of the cell (m), z = L is the location at the top cell tab (m). q is the uniform volumetric heat generation rate present within the cell (W/m3), k
r is the perpendicular thermal
conductivity along the r axis (W/m.K) and kz is the axial thermal
conductivity along the z axis (W/m.K). Irreversible heat generation mechanisms are considered to characterize the value of q, whereby other heat generation terms such as entropic heating are ignored. The cell thermal parameters are shown in Table 1. The irreversible volumetric heat generation rate is expressed via Onda et al., [19]:
2 0 c
I R q
v
= (4)
where, I is the cell current (A), R0 the internal resistance of the
cell (Ω), and vc the volume of the cell active material (m3).
[image:4.612.315.568.132.239.2]The complete cell model is the integration of the ECM with the ageing strategy and the thermal model. With this model, the behaviour and status of the cell under any current driving cycle can be simulated. The outputs of this model are cell SOC, terminal voltage, ageing level and surface temperature. The following section will describes the way to form a VBM using the designed cell model and a real “live” cell.
Fig. 2. Simulated battery string configuration
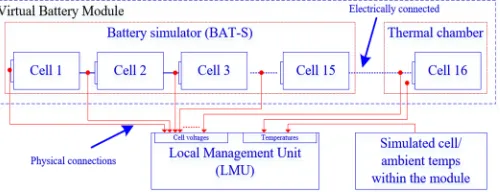
E. Virtual Battery Module Development
To enable the BMS testing within the laboratory condition, the VBM employed in this study is configured as a
16-series-1-parallel (16S1P), which is a single string of 16 cells connected in series. In this string, a real “live” cell is connected in series with 15 virtual cells simulated in a battery simulator. The degradation of the simulated cells can be simulated by adjusting the ageing parameters as descripted in Section II.C. Fig. 2 illustrates the simulated battery string employed in this research.
TABLE 1.CELL PARAMETERS
Parameters Value Unit
Cell weight (m) 68 g
Dimension (dia x length) 21 x 70 mm
Cell energy capacitance (C) 5 Ah
Material density (ρ) 2863.1 kg/m3
Thermal conductivity (kr, kz) 0.25; 30 W/m.K
Specific heat capacity (Cp) 1280 J/kg.K
Radial heat transfer 13 W/m2.K
III. EXPERIMENTAL SETUP
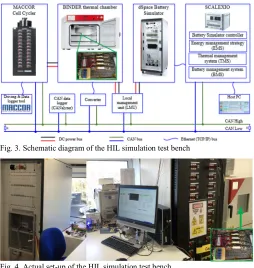
[image:4.612.315.569.388.656.2]In this section, a real-time HIL simulation test bench is built for the experimental study. The system consists of a dSpace HIL platform (Scalexio), a battery simulator (BAT-S), a local management unit (LMU), a cell cycler (Maccor), a controllable climate chamber (Binder) and peripheral equipment such as personal computer (PC), current sensors, controller area network (CAN) converters, switches that are employed for signal generation and measurement as well as data conversion and transmission. Those hardware are interfaced to each other via electrical connection, TCP/IP or CAN bus interfaces. The schematic diagram of the test bench is shown in Fig. 3 and the actual HIL machine setup and wiring connection of the test bench is depicted in Fig. 4.
Fig. 3. Schematic diagram of the HIL simulation test bench
Fig. 4. Actual set-up of the HIL simulation test bench
[image:4.612.47.298.596.674.2]plant model, battery model and models of functions of the BMS) and generate the driving command for the battery. The BAT-S, also provided by dSpace Ltd., is a power electronic equipment that is able to simulate a single cell or a multi-cells in series battery module/pack based on different types of mathematical battery model. It is able to output physical cell voltages with high precision based on the given commands from the model. The LMU is the Ti-BQ76PL455EVM manufactured by Texas Instruments; it is able to provide monitoring and balancing capability for a stack of up to 16 series-connected battery cells. The cell cycler is a multifunction series 4000 computerised battery test system manufactured by Maccor; it is used to generate the charging or discharging signals for the real cell and thus, in this case, it can represent the power sources or loads to exercise the real cell. The controllable climate chamber, provided by Binder, controls the ambient temperature of the cell or used to simulate the environmental temperature around the cell during the test; besides, it can be used for safety purposes such as to protect the external equipment and human from fire or explosion.
A. Integration of real and model-based cell models
[image:5.612.315.566.81.243.2]The representative configuration of the complete HIL-based VBM employed for the BMS testing in this study is a 16S1P combination as described in Section I.E. In this configuration, 15 simulated model-based battery cells, are reproduced within the BAT-S, and the physical “live” cell, placed in the Binder thermal chamber, is connected at the end of the string so that the simulated cells and real cell are electrically connected. Fig. 5 illustrates the configuration diagram of the VBM while Fig. 6 shows the employment of it in the HIL simulation test bench.
Fig. 5. Configuration diagram of the employed virtual battery pack
B. Operational description of the HIL-based VBM test bench
As illustrated in Fig. 6, the EMS, acts as the controller based on the actual load demand generated from the load generator and the performance of the propulsion plan model, determines battery current command (BAT.CMD, i), battery operational thermal request (θ) and internal combustion engine (ICE) power command (PROP.CMD). The BAT.CMD signal is then send to the model of the VBM as the current request. The cell terminal voltage outputs (vc) of the VBM are used as the driving
commands of the BAT-S while the cell surface temperature outputs (T1-7) of the VBM are sent to the LMU to log as the cell’s
surface temperatures. Simultaneously, the Maccor cell cycler receives the BAT.CMD signal as the driving command and generates real driving current (ic) accordingly for the “live” cell
which is placed in the thermal chamber. Next, according to the
vc, the BAT-S reproduces voltage outputs (V1-15) for a string of
15 cells, which is called a 15 simulated cells in series. At this point, V1-15, T1-7, “live” cell voltage (V16) and temperature (T16)
[image:5.612.48.298.401.497.2]are read by the LMU. Finally, the data recorded by the LMU are used in the BMS.
Fig. 6. Employment of the VBM in the HIL test bench
IV. COMMISSIONING AND EXPERIMENTAL RESULTS
A. Battery Model Validation
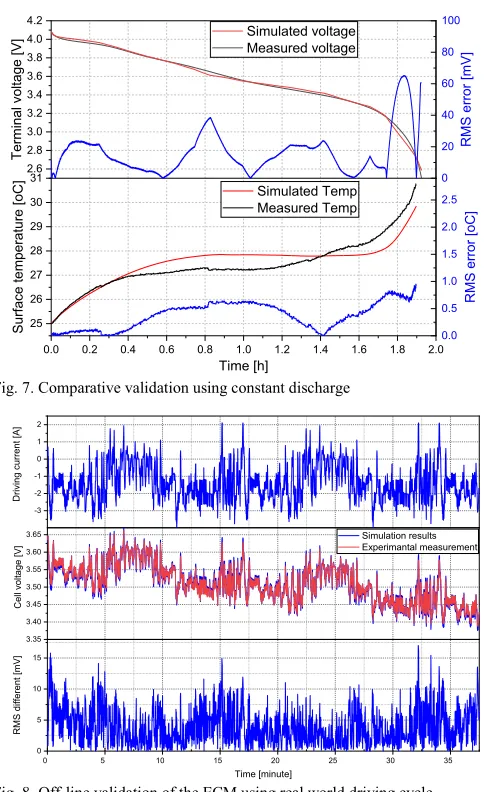
The offline validation, which shows the comparative performance between the real “live” cell and the employed battery model, is performed in order to evaluate the accuracy of the designed model in experimental testing. The validation process consists of two tests, the constant-current (CC) discharge test and the real world driving cycle test, which are carried out as follows:
First, the cell is fully charged by a current, constant-voltage (CC-CV) method at 0.3C (1.5A) with the cut-off current is 50mA, followed by a rest period of 4 hours. After that, the cell is discharged using a CC discharge method at 0.5C (2.5A) rate until the cell reaches the cut-off voltage at 2.5V. This process is recorded at the sampling time of 1s. The comparison between simulation and experimental measured for CC discharge test is presented in Fig. 7. Here, the result from the top subplot shows that the simulated voltage and the measured one are basically superimposed, the maximum root-mean-square (RMS) error is 65mV, which equals to 1.8% of the nominal voltage of the battery. The results reveal that the battery model performs accurately in term of terminal voltage output in continuous discharge conditions. The result in the bottom subplot shows the same behaviour of the temperature comparison, the maximum RMS error between the simulation and the measured surface temperature reaches 0.60C. From the result, it can be concluded
that the battery model behaves well in term of surface temperature output within the testing conditions.
cell is fully charged using the same CC-CV procedure in the above section, it is then discharged using CC method until the SOC reaches 50% followed by a 4 hours of rest. Finally, the driving cycle profile is applied and the whole process is recorded at the sampling time of 1s. Likewise, the battery model is also validated under the same driving cycle. The mid-subplot illustrates the correlation of the predicted terminal voltage in simulation with an experimental measurement while the bottom subplot shows the RMS difference between the two output voltages. The graphs show that the model output lays over the measured one. The maximum RMS difference is less than 17mV, which equals to about 0.5% of the nominal voltage. The results convince that the battery model can be used to represent the performance of the real cell and can be integrated to the HIL test.
2.6 2.8 3.0 3.2 3.4 3.6 3.8 4.0 4.2
0.0 0.2 0.4 0.6 0.8 1.0 1.2 1.4 1.6 1.8 2.0 25
26 27 28 29 30 31
Te
rmin
al vo
ltag
e [
V]
Simulated voltage Measured voltage
Simulated Temp Measured Temp
Surfa
ce t
em
pe
ra
tur
e [
oC]
Time [h]
0 20 40 60 80 100
RMS er
ro
r [
mV]
0.0 0.5 1.0 1.5 2.0 2.5
RMS er
ro
r [
oC]
Fig. 7. Comparative validation using constant discharge
-3 -2 -1 0 1 2
3.35 3.40 3.45 3.50 3.55 3.60 3.65
0 5 10 15 20 25 30 35
0 5 10 15
D
rivi
ng
curr
ent
[A]
Simulation results Experimantal measurement
C
el
l vol
tage [
V]
R
MS
di
fferent
[mV]
[image:6.612.49.291.219.615.2]Time [minute]
Fig. 8. Off-line validation of the ECM using real world driving cycle
It is noted that the environmental temperature during the tests is kept unchanged and using a fan for air circulation, hence, the temperature effects are not considered in this study. However, if considering the effects of temperature within the VBM, new experimental training data on “live” cell need to be gathered, which includes the cell characterisation under different temperatures. Then, with minor modification on the look-up tables within the employed model, the temperature
effects can be included through using the 3-D lookup tables of model parameters.
B. Commissioning and Test Results
In this study, the commissioning is to guarantee the integrated system described in Fig. 6 safe in operation, all connected equipment work properly and the signals are transceived correctly. The commissioning has been carried out on the current set up and the whole system are working correctly and following a pre-designed procedure. The experimental results have been collected successfully. The following tests are performed for the commissioning:
a). Control and monitor the system behaviour via GUI
[image:6.612.335.544.278.519.2]To control and monitor the whole system behaviour, the graphical user interface (GUI), which is illustrated in Fig. 9, is developed using the dSpace ControlDesk software. The GUI allows the operator to control all hardware linked together, adjust the system parameters and change all information of the system. The GUI consists of three parts:
Fig. 9. dSpace ControlDesk GUI development (a sample drive cycle)
- Control Panel, allows to control the whole system including the Battery simulator (to enable/disable the simulator, to set/reset the initial SOC the virtual battery pack), Scalexio (to adjust or switch to different type of driving current profiles), thermal chamber (to adjust or switch to different type of driving profiles), and other hardware.
- VBM, allows to display the module information including cell and module status such as module voltage, module SOC, and cell information including voltages, SOCs, temperatures, ageing levels.
b). Monitoring the performance of the virtual battery pack using a driving cycle.
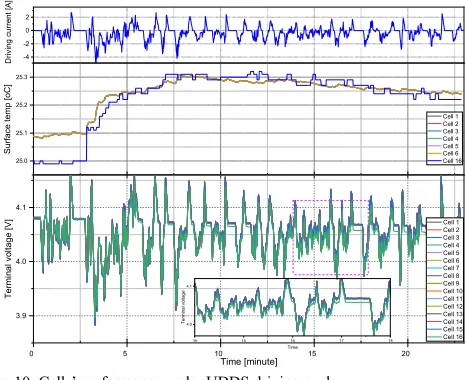
Fig. 10: Cells’ performance under UDDS driving cycle
This step is to evaluate the performance of the real cell and the simulated cells within the battery module using the Urban Dynamometer Driving Schedule (UDDS) driving cycle. Fig. 10 shows the behaviour of the cells within the VBM. The driving cycle is scaled corresponding to the maximum discharge C-rate of a single cell. The battery module is preconditioned to 90% SOC where all the cell voltages, including real cell and simulated cells, are assumed to be equivalent to each other. The “live” cell is placed in the thermal chamber, where the environmental temperature is maintained at 250C, while the
ambient temperature of the simulated cells is set to 250C, too.
During the test, all the information of the battery module, which are cell/module voltages and temperatures, is monitored and recorded for the BMS test purposes. The results shows that the performance of the “live” cell and the simulated ones matches each other very well.
V. CONCLUSION
In this work, a HIL-based VBM, which consists of a real “live” cell electrically connected in series with 15 model-based simulated cells, was introduced for the testing and validating of the BMS through a HIL simulation environment. The battery model was validated using offline validation method to verify the accuracy of the employed model. The system was experimental tested to ensure they are working properly following a pre-designed test procedure. The results convince that the designed HIL-based VBM simulation platform can be employed for the real-time experimental BMS test and validation, and also for supporting a fundamental understanding of the impact of duty-cycles, cell to cell interactions, thermal variations and cell degradation.
Additional tasks can be considered in the future such as the integration of the HIL-based VBM into the verification of BMS functions development, where the system parameters can be raised up to the thresholds for full validation of the BMS. Furthermore, this setup is a very interesting system for the development of failure detection, fault diagnostic and BMS safety functions development.
ACKNOWLEDGMENT
This research was undertaken in partnership with the WMG HVM Catapult, part-funded by Innovate UK.
REFERENCES
[1] Hanselmann, H. “Hardware-in-the-loop simulation testing and its integration into a CACSD toolset”. in Proceedings of Joint Conference on Control Applications Intelligent Control and Computer Aided Control System Design. 1996.
[2] Suh, M.W., et al. “Hardware-in-the-loop simulation for ABS based on PC”. International Journal of Vehicle Design, 2000. 24(2-3): p. 157-170. [3] Nasiri, M. and M. Montazeri-Gh. “Time-delay compensation for actuator-based hardware-in-the-loop testing of a jet engine fuel control unit”. Proceedings of the Institution of Mechanical Engineers, Part I: Journal of Systems and Control Engineering, 2012. 226(10): p. 1371-1380. [4] Kim, S.H. and C.N. Chu. “Hardware-in-the-loop simulations of an
electrohydraulic power steering system for developing the motor speed map of heavy commercial vehicles”. Proceedings of the Institution of Mechanical Engineers, Part D: Journal of Automobile Engineering, 2015. 229(13): p. 1717-1731.
[5] Salehi, A. and M. Montazeri-Gh. “Hardware-in-the-loop simulation of fuel control actuator of a turboshaft gas turbine engine”. Proceedings of the Institution of Mechanical Engineers, Part M: Journal of Engineering for the Maritime Environment, 2018: p. 1-9.
[6] Bouscayrol, A. “Different types of Hardware-In-the-Loop simulation for electric drives”. in 2008 IEEE International Symposium on Industrial Electronics. 2008.
[7] Barreras, J.V., et al. “An Advanced HIL Simulation Battery Model for Battery Management System Testing”. IEEE Transactions on Industry Applications, 2016. 52(6): p. 5086-5099.
[8] Haupt, H., J. Bracker, and M. Ploeger. “Hardware-in-the-Loop Test of Battery Management Systems”. in 7th IFAC Symposium on Advances in Automotive Control. 2013, SAE International: Tokyo, Japan. p. 658-664. [9] Marco, J., et al. “A Cell-in-the-Loop Approach to Systems Modelling and Simulation of Energy Storage Systems”. Energies, 2015. 8(8): p. 8244-8262.
[10] He, H., X. Rui, and J. Fan. “Evaluation of lithium-ion battery equivalent circuit models for state of charge estimation by an experimental approach”. Energies, 2011. 4(4): p. 582-598.
[11] Hu, X., S. Li, and H. Peng. “A comparative study of equivalent circuit models for Li-ion batteries”. Journal of Power Sources, 2012. 198: p. 359-367.
[12] Orcioni, S., et al. “Lithium-ion Battery Electrothermal Model, Parameter Estimation, and Simulation Environment”. Energies, 2017. 10(375): p. 1-20.
[13] Wu, G., C. Zhu, and C.C. Chan. “Comparison of the First Order and the Second Order Equivalent Circuit Model Applied in State of Charge Estimation for Battery Used in Electric Vehicles”. Journal of Asian Electric Vehicles, 2010. 8(1): p. 1357-1362.
[14] Yao, L.W., et al. “Modeling of lithium-ion battery using MATLAB/simulink”. in IECON 2013 - 39th Annual Conference of the IEEE Industrial Electronics Society. 2013.
[15] Zhang, L., et al. “Comparative Research on RC Equivalent Circuit Models for Lithium-Ion Batteries of Electric Vehicles”. Applied Sciences, 2017. 7(1002): p. 1-16.
[16] Zhang, C., et al. “Online estimation of battery equivalent circuit model parameters and state of charge using decoupled least squares technique”. Energy, 2018. 142: p. 678-688.
[17] Barai, A., et al. “A study on the impact of lithium-ion cell relaxation on electrochemical impedance spectroscopy”. Journal of Power Sources, 2015. 280: p. 74-80.
[18] Worwood, D., et al. “A new approach to the internal thermal management of cylindrical battery cells for automotive applications”. Journal of Power Sources, 2017. 346: p. 151-166.
[19] Onda, K., et al. “Thermal behavior of small lithium-ion battery during rapid charge and discharge cycles”. Journal of Power Sources, 2006. 158(1): p. 535-542.
-4 -2 0 2 25.0 25.1 25.2 25.3
0 5 10 15 20
3.9 4.0 4.1 D riv ing cu rr ent [A ] Cell 1 Cell 2 Cell 3 Cell 4 Cell 5 Cell 6 Cell 16
Surface temp [oC]
Cell 1 Cell 2 Cell 3 Cell 4 Cell 5 Cell 6 Cell 7 Cell 8 Cell 9 Cell 10 Cell 11 Cell 12 Cell 13 Cell 14 Cell 15 Cell 16 T e rm in al vo ltage [ V ] Time [minute]
14 15 16 17 18