ORIGINAL
ARTIC
L
E
Diagnosing risk factors alongside mass drug administration using
serial diagnostic tests
—
which test
fi
rst?
Louise Dyson
a,b,* and T. Déirdre Hollingsworth
ca
Mathematics Institute, University of Warwick, Zeeman Building, Coventry, CV4 7AL, UK;bSchool of Life Sciences, University of Warwick, Gibbet Hill Campus, Coventry, CV4 7AL, UK;cBig Data Institute, Li Ka Shing Centre for Health Information and Discovery,
University of Oxford, Old Road Campus, Oxford OX3 7LF, UK
*Corresponding author: Tel:+44 (0)24 765 24975; E-mail: [email protected]
Received 15 March 2018; revised 1 June 2018; editorial decision 8 June 2018; accepted 2 July 2018
Background:When tests are used in series to determine individual risk factors and infection status in a mass drug administration (MDA), the diagnostics, test order and subsequent treatment decisions (the testing algo-rithm) affect population-level treatment coverage and cost, but there is no existing framework for evaluating which algorithm optimizes any given outcome.
Methods:We present a mathematical tool (with spreadsheet implementation) to analyse the effect of test ordering, illustrated using treatment for onchocerciasis in an area where high-burden Loa loa co-infections present a known risk factor.
Results:The prevalence of the infection and risk factor have a non-linear impact on the optimal ordering of tests. Testing for the MDA infectionfirst always leaves more infected people untreated but fewer people with the risk factor being misclassified. The cost of the treatment given to infected individuals with the risk factor does not affect which algorithm is more cost effective.
Conclusions:For a given test and treat algorithm and its costs, the correct strategy depends on the expected prevalence. In most cases, when the apparent prevalence of the target infection is greater than the apparent prevalence of the risk factor, it is cheaper to do the risk factor testfirst, and vice versa.
Keywords:coverage, diagnostics, mass screen and treat (MSAT), population-level impact, sensitivity, specificity
Introduction
As we approach disease elimination, it becomes increasingly important to be able to enact interventions everywhere the dis-ease is endemic. This may require us to revisit communities, or individuals, in which treatment is complicated by the presence of risk factors that affect the treatment required, particularly for mass drug administration (MDA), a mainstay of neglected trop-ical disease (NTD) control.1The presence of risk factors can pre-vent a drug from being safely administered to the whole population, reducing the coverage of the campaign both through a reduction in population that can be safely treated and through reduced local support due to adverse reactions to the treatment. This undermines the MDA campaign, which requires high coverage in order to be effective. Although this problem is particularly relevant for NTDs, it is also seen in other diseases, and indeed the infrequent use of MDA outside of NTDs
is largely due to the lack of treatments with the right safety profile.
The combination of risk factors and multiple treatment regi-mens and diagnostic tests means that the design of the testing algorithm needs to be carefully considered. For example, there has recently been renewed interest in the possibility of MDA campaigns for malaria,2,3which could be MDA or mass screen
and treat (MSAT).2,4For an MSAT campaign where pregnancy is a risk factor,5 there might be a question of whether to offer women of child-bearing age a pregnancy test or a malaria test first. There are many ethical considerations in this scenario, but there are also practical, cost and efficacy considerations that would affect the choice of test and the treatment algorithm.6
Another example of screening forming part of an MDA is for onchocerciasis in areas that are co-endemic withLoa loa filaria-sis. Where these diseases are co-endemic, the usual MDA treat-ment (ivermectin) has a high risk of severe adverse events
©The Author(s) 2018. Published by Oxford University Press on behalf of Royal Society of Tropical Medicine and Hygiene.
(SAEs) if the individual has a high Loa loa microfilarial (mf) load.7Under the current World Health Organization guidelines,
areas with hypo-endemic onchocerciasis prevalence whereLoa loa is known to be present have been left untreated.8,9 The
question of how to eliminate onchocerciasis by delivering safe treatment in these co-endemic areas has recently been much debated.10–12 The development of the LoaScope,13 a mobile telephone–based video microscope, has made testing for Loa loain thefield more practical, leading to the‘test-and-not-treat strategy’, where individuals with highLoa loaloads are identified through individual-level testing and not treated for onchocercia-sis. This has recently been shown to be implementable in a population of more than 20 000 people.8
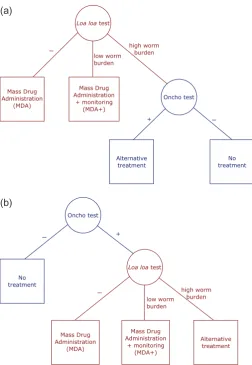
Prior to this demonstration of field implementation, there were concerns that an approach that required testing the whole population forLoa loawould be too time consuming for large-scale screening. In response, there was a proposal to possibly combine theLoa loa test with an onchocerciasis test and only use theLoa loatest for a small part of the population. For this example, the primary aim is to avoid SAEs by constraining the testing algorithm to ensure that everyone who is given the standard treatment for onchocerciasis has been tested forLoa loa.There are two possible testing algorithms (Figure1):
(1) Screen the population using a risk factor test and then treat everyone who is negative, increasing MDA treatment cover-age but, depending on the relative costs of the person-time running the tests, increasing costs.
(2) Screen with the MDA infection test and only use a risk factor test on those who are positive for the infection (in our example, treatment coverage is constrained by the low sen-sitivity of the onchocerciasis rapid test at low prevalence). It is not immediately obvious which of these algorithms is ‘best’in terms of efficacy and cost. This article seeks to address that question by developing a general framework applying it to this onchocerciasis/Loa loaexample.
It is important to note that since our research was under-taken a different solution is close to being implemented for onchocerciasis, in which each implementation unit is mapped to determine whether both onchocerciasis andLoa loaare present and, if so, each individual gives a blood sample that is tested for both diseases before treatment, increasing the sensitivity of the onchocerciasis test.
However, to our knowledge, the literature still lacks a frame-work for making a choice between serial testing and treatment algorithms on the basis of population-level impact. We note that a related question has been more widely studied in which multiple tests exist for the same disease, with different costs, specificities and sensitivities (e.g., for human immunodeficiency virus [HIV]).14
Again, the question of the ordering of these tests, which has been examined to determine the optimal ordering for diagnosis and cost, could be addressed using the tool outlined here. Our frame-work is relevant to any scenario in which a disease is present in a population that also displays some risk factor that increases the risk of SAEs when individuals are treated for a disease. It is important to note that this requires a test for the risk factor for which the sensitivity and specificity have been reliably determined under the circumstances in which the tool will be used.
The three outcomes we wish to balance are the number of people at risk of SAEs, the number of people infected with the disease that do not receive treatment and the total cost of the scheme, including the costs of tests and treatments. Factors that affect these outcomes include the sensitivities and specificities of the tests, the prevalence of the disease and the risk factor and the costs of the tests and treatments. We describe the method-ology used in the tool to calculate the outcomes and the general patterns that emerge. We have produced a spreadsheet tool that allows the user to specify these different factors and explore their effects on the described outcomes. We illustrate how the tool can be used to assess the optimal order of test and treatment decisions for onchocerciasis scenarios, but the same methods may be easily applied to compare proposed treatment algo-rithms for any disease with a co-endemic risk factor.
Methods
We consider a population of individuals, divided into six groups according to their onchocerciasis infection status (uninfected vs infected) and three levels of possible Loa loa infection (unin-fected vs low mf load vs high mf load). How best to specify the joint distribution of the two diseases (or MDA infection and risk factor) depends on the set of initial assumptions. If the two dis-eases are presumed to be independent, then the joint distribu-tion is just the product of the propordistribu-tion of individuals with each disease. In the case ofLoa loa, the proportion of the population that have no, low or high burdens ofLoa loacan be specified by assuming a negative binomial mf distribution and a threshold above which the burden is considered to be‘high’. Alternatively we can consider that the two infections may be correlated (as seen by Kelly-Hope et al.15), whereby having one disease may
make infection with the second more likely. While this last speci-fication is likely to be the most accurate, it requires additional data to inform the proportion of the population in each group and only affects our analysis of how the relative costs of the two schemes relate to the prevalence of the two diseases.
Note that our analysis of the risk of SAEs and the number of people with untreated onchocerciasis depends on both the true infection status of individuals as well as their test results. In contrast, our analysis of the relative costs of the two schemes relies only on the outcome of tests and not on the true under-lying status.
Spreadsheets implementing this analysis assuming either inde-pendence of the two diseases (TestnTreat_prevalences_independent. xlsx) or requiring co-infection information (TestnTreat_prevalences_ independent.xlsx) are provided as supplementaryfiles.
Assumptions
Since the difference between negative and low burdens ofLoa loahas little impact on treatment decision in our analysis, we will simplify the analysis by assuming that the Loa loa test always correctly identifies the presence or absence of Loa loa. Therefore in this article, the specificity and sensitivity of theLoa loatest refer only to whether the individual has a high or low mf burden. It would be straightforward to compute a similar analysis including uncertainty between negative and low Loa loatests, and our results would still hold.
Results
We now present an analysis of the two algorithms in Figure1 using the groups found in Table1.
Testing for MDA infection
fi
rst always results in more
untreated infected people
In general, using the MDA infection or, in the example, oncho-cerciasis test first results in a larger proportion of people who are infected with onchocerciasis and are not given a treatment. This can be seen by calculating the number of infected people that are untreated under each scheme. IfNO+ is the number of people who have onchocerciasis and we test for onchocerciasis first, then the number of untreated infected people is simply those who incorrectly tested negative for onchocerciasis, that is,
( −1 Osens)NO+, ( )1
where Osens is the sensitivity of the onchocerciasis test.
Conversely, if we test for Loa loafirst, then some people who would incorrectly test negative for onchocerciasis instead first test negative or low forLoa loaand thus receive treatment any-way. More specifically,
( −1 Osens)(( −1 Lsp)NL ,LO++Lsens L ,NHO+) ( )2
is the number of people infected with onchocerciasis who are untreated, where Lspand Lsensare the specificity and sensitivity
of the Loa loa test, respectively, and NL ,OL + and NL ,OH + are the number of onchocerciasis-positive people who have low and highLoa loaburdens, respectively. SinceNL ,OL ++NL ,OH +≤NO+ and (1−Lsp),Lsens≤1, then
( −1 Osens)(( −1 Lsp)NL ,LO++Lsens L ,NHO+)≤( −1 Osens)NO+ ( )3
and so testing for onchocerciasisfirst results in more untreated infected people than testing forLoa loafirst. More generally, if one test can lead directly to individuals not being considered for treatment (and the other does not), then doing that test first will lead to more untreated individuals.
Testing for MDA infection
fi
rst always results in fewer
people at risk of SAEs
For similar reasons, testing for onchocerciasisfirst also results in fewer people at risk of SAEs. In this case, people who have high Loa loaburdens and receive an MDA treatment are considered to be at risk of SAEs. Similar to the above section, there will be fewer people in this category when testing for onchocerciasis first, since some people who have high Loa loa burdens will (rightly or wrongly) test negative for onchocerciasis and thus receive no treatment. We may again calculate the number of people at risk of SAEs under each scheme. When the Loa loa test is givenfirst, the number of people with a highLoa loa bur-den that (incorrectly) test low forLoa loa(and thus are at risk of SAEs) is given by
( −1 Lsens)(NL ,HO++NL ,HO−), ( )4
(a)
[image:3.612.44.297.84.450.2](b)
whereNL ,OH −is the number of people with a highLoa loaburden without onchocerciasis. Conversely, if the onchocerciasis test is given first, then only those testing positive for onchocerciasis will be considered for treatment and of these, some will incor-rectly test low forLoa loa. The following population,
( −1 Lsens)(Osens L ,NHO++( −1 Ospec)NL ,HO−), ( )5
will therefore be at risk of SAEs. Since Osens≤1 and (1−Osp)≤1,
then
( − )( + )( − )( +( − ) )
( )
+ − + −
N N N N
1 L 1 L O 1 O ,
6
O O O O
sens L ,H L ,H sens sens L ,H spec L ,H
and so testing for onchocerciasis first always results in fewer people at risk of SAEs than testing forLoa loafirst. In general, if one test leads directly to people not being treated, and there is a risk of SAEs, then doing that testfirst will result in fewer peo-ple at risk of SAEs.
Costs of the two schemes
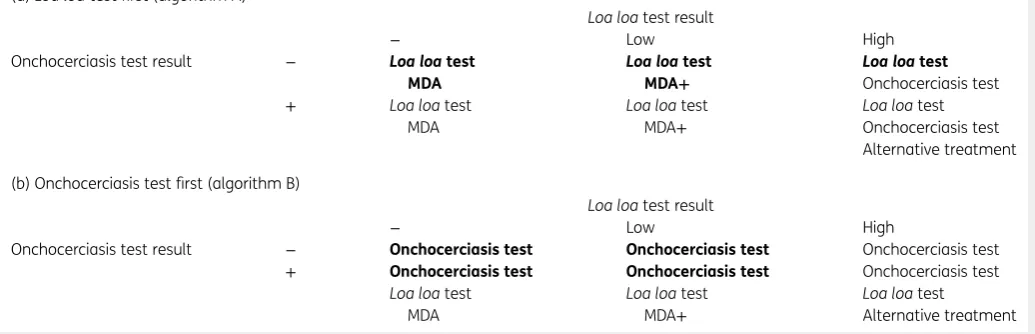
The tests and treatments that would be given under the two schemes are summarised in Table 1. The population is divided into six subpopulations based on their test results for the two diseases, then for each subpopulation we give the tests and treatments given for that subpopulation under the scheme. So, for example, if an individual tests positive for onchocerciasis (either because they have onchocerciasis or because they receive a false positive on the test) and demonstrates a lowLoa loaburden on their test, then on theLoa loa–first scheme (algo-rithm A) they will receive theLoa loatest and, on the basis of that, will be given the MDA treatment and will then be moni-tored for side effects. On the onchocerciasis-first scheme (algo-rithm B) they will be given the onchocerciasis test and, on the
basis of that, will be given theLoa loatest and, on the basis of those two results, will receive MDA treatment plus monitoring for side effects.
The cost of the alternative treatment does not affect
which scheme is more cost effective
To determine which scheme is more efficient we only need to con-sider the differences between the two schemes. In particular, the alternative treatment is only given to people who test positive for onchocerciasis and test high forLoa loa. Since this is the subgroup that we are required to identify, this group always receives both tests and the alternative treatment. Therefore the cost of the alter-native treatment does not affect which scheme is less expensive.
Which is cheaper?
The price of tests and treatment depends only on the outcomes of those tests and not the true disease status of the individuals tested. We will therefore defineNXT to be the number of people
that test asX. For example,NL OTh −is the number of people that, if they were tested, would present with a highLoa loaburden and would be negative for onchocerciasis, regardless of their actual disease status. The difference in cost between the two schemes can be seen by using the information in bold in Table1. This is given by (Loa loafirst—onchocerciasisfirst):
( [ ]+ − )+ ([ ] + − )
+ − −
( ) +
− − −
− − + +
N O N L
N N N
MDA L MDA O
L O O , , 7
T T
T T T
L O test test L O test test
L O test L O test L O test L
H L
where Ltest, Otest, [MDA] and [MDA]+are the costs of theLoa loatest,
onchocerciasis test, MDA treatment and MDA treatment plus obser-vation, respectively. Rearranging and using NL OT− −+NL OT− +=NLT−,
+ =
− +
NT NT NT
L OL L OL LLandN− −+N −+N −=N −
T T T T
[image:4.612.49.567.141.308.2]L O L OL L OH O, we obtain
Table 1.Tests and treatments employed for each algorithm (see Figure1) stratified by how individuals test for the two diseases. Differences between the two schemes are highlighted in bold
(a)Loa loatestfirst (algorithm A)
Loa loatest result
− Low High
Onchocerciasis test result − Loa loatest MDA
Loa loatest
MDA+
Loa loatest
Onchocerciasis test + Loa loatest
MDA
Loa loatest MDA+
Loa loatest Onchocerciasis test Alternative treatment
(b) Onchocerciasis testfirst (algorithm B)
Loa loatest result
− Low High
Onchocerciasis test result − Onchocerciasis test Onchocerciasis test Onchocerciasis test
+ Onchocerciasis test Onchocerciasis test Onchocerciasis test
Loa loatest MDA
Loa loatest MDA+
Loa loatest
− ( + )+[ ] +[ ]+ ( )
− − − − −
N O N N N N
L T T T MDA T MDA T . 8
test O test L LL L O L OL
We may see from this that theLoa loa–first scheme (algo-rithm A) is more likely to be cheaper at lower onchocerciasis prevalences and/or when theLoa loatest, the MDA treatment or the MDA treatment with observation are more expensive.
Up to this point we have made no assumptions about how the prevalence of the two infections affect each other. For example, it may be the case that individuals with onchocerciasis are also more likely to have high loads ofLoa loa. To progress with the analysis from here, however, we will assume that the two infections (and testing positive for the infections) are inde-pendent of each other. That is, individuals infected with oncho-cerciasis are no more or less likely to haveLoa loainfections. It is convenient at this point to use apparent prevalences (nXT=N NXT/ ) rather than populations (NXT), so that combinations
of populations are easily calculated. For example, the fraction of the population that tests negative forLoa loa and positive for onchocerciasis is given by nL OT− +=n nLT− OT+, and equation (8) becomes
− ( − )+[ ] ( − )+[ ] ( − )
( ) +
− − + +
n O n n n n n
L 1 MDA 1 MDA 1 ,
9
T T T T T T
test O test Lh L O LL O
usingnOT−= −1 nT+
O andnLT−+nLTL+ −1 nLTh. Solving equation (9) tofind when the two schemes are equal gives
= – ( − ) [ ]( − )+ +([ ] −[+ ]) ( ) + n n n n
1 1 O
MDA 1 L MDA MDA . 10
T
T
T T
O L
test
L test L
h
h L
FornOT+greater than in equation (10), it is cheaper to do the Loa loatestfirst, whereas for lower onchocerciasis prevalences it is cheaper to do the onchocerciasis testfirst (algorithm B). It is intuitive that low onchocerciasis prevalences result in the onchocerciasis-first algorithm being cheaper, since people who test negative for onchocerciasis receive no further tests or treat-ment. Figure2a gives an indication of the shape of these differ-ent regions. We note thatnT
LHis at most1−nLTL, since we keepnLTL as a parameter and require thatnT+nT+nT−=1
LH LL L .
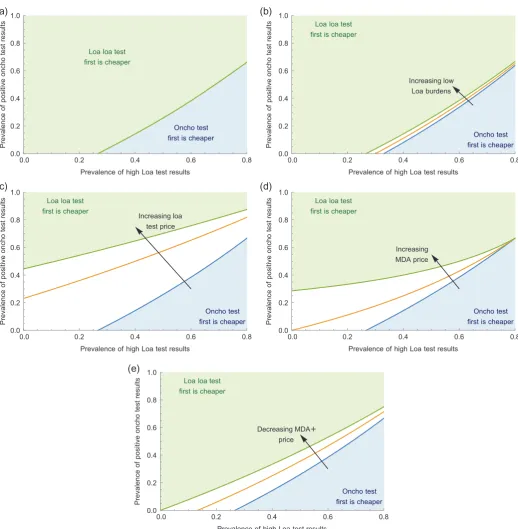
Since the costs of the various tests and treatments may be variable depending on the situation, we explore the effect of changing these parameters on this plot. It is clear from equa-tion (10) that the price of the onchocerciasis test merely scales with changes in the other parameters. In addition, increasing the apparent prevalence of lowLoa loaburdens (nT
LL; Figure2b), increasing the price of the Loa loa test (Ltest; Figure 2c) or decreasing the price of MDA treatment with observation ([MDA]+; Figure 2e) will have a similar effect. All of these changes will increase the number of positive onchocerciasis test results required before the Loa loa–first scheme (algorithm A) becomes cheaper. Increasing the price of MDA treatment, how-ever, will lead to a more curved dividing line, so that the region in which the onchocerciasis-first scheme is cheaper becomes much larger (Figure2d). This is due to the subpopulation with negative onchocerciasis andLoa loa results being untreated in the onchocerciasis-first scheme (algorithm B), while receiving MDA treatment under theLoa loa–first scheme. Since more peo-ple receive MDA treatments under theLoa loa–first scheme, this
becomes more expensive as the cost of the MDA treatments increases.
Conclusions
We have presented an analysis of two test-and-treat schemes: testing for the disease first or for the risk factor first. In our example scenario, the disease is onchocerciasis and the risk factor is co-infection withLoa loa. This illustrates that testing for the dis-ease first (algorithm B) will always result in more untreated infected people, but it will also result in fewer people at risk of SAEs. We note that if the sensitivity of the risk factor test is 100% (as is given forLoa loaby D’Ambrosio et al.13), then there are no
people at risk of SAEs from either scheme. In this case the scheme used will depend on the relative costs of the two possibil-ities. At low MDA infection prevalences the risk factor–first scheme is likely to be cheaper and, since it will result in fewer untreated infected people, would be the better choice (assuming 100% risk factor test sensitivity). At higher MDA infection prevalences, how-ever, the MDA disease test–first scheme (algorithm B) may be cheaper and so the decision may rest on how much each add-itional treated person costs. For any particular circumstance this may be calculated as ( −1 Osens)(NO+−( −1 Lsp)NL ,OL +−Lsens L ,ONH +) divided by equation (8). Note that to determine this it may be necessary to use the specificities and sensitivities of the diagnos-tics to convert between true underlying prevalences and the pro-portion of positive test results. We have provided a spreadsheet tool to assist with determining the relative costs and benefits of the schemes with given test and treatment costs and prevalences of the two diseases (see supplementaryfile).
It should be noted that we only consider here the risk of SAEs, the cost of the schemes and the proportion of infected people receiving treatment. The tool does not consider practicalities such as the need to take blood samples at a particular time of the day due to the diurnal periodicity of theLoa loamicrofilaria. Nor does the tool consider specific diagnostic tools. To test forLoa loa, one could use the CellScope Loa test, which has been shown to have 94% specificity and 100% sensitivity13
and requires blood samples in the middle of the day.16 For onchocerciasis one could use the
rapid format OV-16 antibody test,17which has demonstrated sensi-tivities between 76.5% and 81.1% with 100% specificity. We note that the OV-16 test was developed as a tool for mapping the preva-lence of onchocerciasis, not as a diagnostic test to determine when individuals receive treatment, as antibody tests cannot distinguish between past and current infections. Nonetheless, the tool pre-sented here is not test dependent and can be used in any situation in which the accuracy and cost of the different tests, the disease and risk factor prevalences and the cost of treatments are known.
The situation considered here shares some similarities with the question of parallel vs serial tests that has been analysed for dis-eases such as HIV14,18 or canine Leishmaniasis.19 However, when
either test, thus increasing the sensitivity at the expense of a lower specificity. Instead, we consider a case in which we are testing for two different diseases or risk factors in order to determine the cor-rect treatment strategy.
The following results are generically true in the context of MDA with a risk factor. If one test can lead to untreated indivi-duals (and the other does not), then doing that testfirst will lead to more (or equal) untreated individuals. If one test leads directly
(a) (b)
(c) (d)
[image:6.612.48.567.83.613.2](e)
Figure 2.Investigating the effect of changing test and treatment prices on which scheme is cheaper. (a) The top dividing line shows where the two schemes cost an equal amount taking the parameter values:[MDA 0.5, MDA]= [ ] =+ 1, O =2, L =1,nT=0.2
test test LL . (b)–(e) We change different values in the way indicated by the arrow to go from the bottom dividing line to the top dividing line. Note that the prevalence of highLoa loatest results (nT
Lh) is at most 0.8 sincenLT−+nT+nT=1
LL Lh and we taken =0.2
T
to people not being treated, and there is a risk of SAEs, then doing that testfirst will result in fewer (or equal) people at risk of SAEs. In addition, if the aim of both schemes is to identify a spe-cific subpopulation in order to administer a given treatment (the ‘alternative treatment’ in our scenario), then the cost of that treatment does not affect which scheme is more expensive.
Supplementary data
Supplementary data are available at Transactions online (http:// trstmh.oxfordjournals.org/).
Authors’contributions:TDH and LD conceived the study, designed the study protocol and interpreted the outputs; LD carried out the analysis and drafted the manuscript. Both authors read and approved thefinal manuscript. LD is the guarantor of the paper.
Acknowledgements:The authors are grateful to Dr. Katherine Gass at the Task Force for Global Health for extensive discussions and comments during the preparation of this manuscript. LD and TDH gratefully acknowledge funding of the NTD Modelling Consortium by the Bill and Melinda Gates Foundation in partnership with the Task Force for Global Health. The views, opinions, assumptions or any other information set out in this article should not be attributed to the Bill & Melinda Gates Foundation and the Task Force for Global Health or any person con-nected with them.
Funding:None.
Competing interests:None declared.
Ethical approval:Not required.
References
1 Hotez P, Aksoy S.PLOS Neglected Tropical Diseases: ten years of pro-gress in neglected tropical disease control and elimination…more or less. PLoS Negl Trop Dis. 2017;11(4):e0005355.
2 Brady OJ, Slater HC, Pemberton-Ross P, et al. Role of mass drug administration in elimination of Plasmodium falciparum malaria: a consensus modelling study. Lancet Glob Health. 2017;5(7):e680–87. 3 Newby G, Hwang J, Koita K, et al. Review of mass drug
administra-tion for malaria and its operaadministra-tional challenges. Am J Trop Med Hyg. 2015;93(1):125–34.
4 Okell LC, Griffin JT, Kleinschmidt I, et al. The potential contribution of mass treatment to the control ofPlasmodium falciparummalaria. PLoS One. 2011;6(5):e20179.
5 World Health Organization. Mass drug administration for falciparum malaria: a practical field manual. 2017. http://apps.who.int/iris/
bitstream/handle/10665/259367/9789241513104-eng.pdf? sequence=1.
6 Newby G, Hwang J, Koita K, et al. Review of mass drug administra-tion for malaria and its operaadministra-tional challenges. Am J Trop Med Hyg. 2015;93(1):125–34.
7 Kamgno J, Pion SDS, Tejiokem MC, et al. Randomized, controlled, double-blind trial with ivermectin on Loa loamicrofilaraemia: effi -cacy of a low dose (~25μg/kg) versus current standard dose (150 μg/kg). Trans R Soc Trop Med Hyg. 2007;101(8):777–85.
8 Kamgno J, Pion SD, Chesnais CB, et al. A test-and-not-treat strategy for onchocerciasis inLoa loa–endemic areas. N Engl J Med. 2017;377 (21):2044–52.
9 Mectizan Expert Committee and Technical Consultative Committee. Recommendations for the treatment of onchocerciasis with Mectizan in areas co-endemic for onchocerciasis and loiasis. June 2004. http://www.who.int/apoc/publications/englishmectccloarecs-june04.pdf.
10 Schlüter DK, Ndeffo-Mbah ML, Takougang I, et al. Using community-level prevalence of Loa loa infection to predict the proportion of highly-infected individuals: statistical modelling to support lymphatic filariasis and onchocerciasis elimination programs. PLoS Negl Trop Dis. 2016;10(12):e0005157.
11 Mackenzie CD, Homeida MM, Hopkins AD, et al. Elimination of onchocerciasis from Africa: possible? Trends Parasitol. 2012;28(1): 16–22.
12 Geary TG. A step toward eradication of human filariases in areas whereLoais endemic. MBio 2016;7(2):e00456-16.
13 D’Ambrosio MV, Bakalar M, Bennuru S, et al. Point-of-care quantifi ca-tion of blood-borne filarial parasites with a mobile phone micro-scope. Sci Transl Med. 2015;7(286):286re4.
14 World Health Organization. HIV testing strategies and algorithms. 2005. http://www.who.int/diagnostics_laboratory/documents/guidance/pm_ module4.pdf.
15 Kelly-Hope LA, Cano J, Stanton MC, et al. Innovative tools for asses-sing risks for severe adverse events in areas of overlapping Loa loa and otherfilarial distributions: the application of micro-stratification mapping. Parasit Vectors. 2014;7:307.
16 Kamgno J, Pion SD, Mackenzie CD, et al.Loa loamicrofilarial period-icity in ivermectin-treated patients: comparison between those developing and those free of serious adverse events. Am J Trop Med Hyg. 2009;81(6):1056–61.
17 Lipner EM, Dembele N, Souleymane S, et al. Field applicability of a rapid-format anti–Ov-16 antibody test for the assessment of oncho-cerciasis control measures in regions of endemicity. J Infect Dis. 2006;194(2):216–21.
18 Koblavi-Dème S, Maurice C, Yavo D, et al. Sensitivity and specificity of human immunodeficiency virus rapid serologic assays and testing algorithms in an antenatal clinic in Abidjan, Ivory Coast. J Clin Microbiol. 2001;39(5):1808–12.