Experimental investigation and analysis of three spear valve
designs on the performance of Turgo impulse turbines
D. S. Benzon, Hydropower Mechanical Engineer, Mott MacDonald Ltd, UK A. Židonis, Researcher, Lancaster University Renewable Energy Group, UK
A. Panagiotopoulos, Post-Doctoral Researcher, School of Mechanical Engineering, National Technical University of Athens, Greece
S. Petley, PhD Student, Lancaster University Renewable Energy Group, UK
G.A. Aggidis, Professor of Energy Engineering and Director of Lancaster University Renewable Energy Group & Fluid Machinery Group, Lancaster University, UK
J.S. Anagnostopoulos, Professor in Hydraulic Turbomachines, School of Mechanical Engineering, National Technical University of Athens, Greece
D.E. Papantonis, Professor and Director of the Hydraulic Turbomachines Lab, School of Mechanical Engineering, National Technical University of Athens, Greece
Abstract
Several numerical investigations into the impact of the spear and nozzle configuration of impulse turbine injectors can be found in the literature, however there is little or no experimental data available for the effect on Turgo impulse turbine performance. A recent 2D numerical Design of Experiments (DoE) study found that much steeper nozzle and spear angles than the industry standard produced higher efficiencies. This work was extended to compare the performance of an industry standard injector (with nozzle and spear angles of 80° and 55°) and an improved injector with much steeper angles of 110° and 70° using a full 3D simulation of the injector, guide vanes and first branch pipe. The impact of the jets produced by these injectors on the performance of a Turgo runner was also simulated. The results for both CFD tools used suggest that steeper injector nozzle and spear angles reduce the injector losses, showing an increase in efficiency of 0.76% for the Turgo 3D injector.
In order to investigate the numerical results from the previous studies further, three Turgo impulse turbine injectors were manufactured by Gilbert Gilkes & Gordon Ltd for testing on the 9” Gilkes HCTI Turgo rig at the Laboratory of Hydraulic Machines, National Technical University of Athens (NTUA). The injector designs tested were the standard (80/55) design, with nozzle and spear tip angles of 80° and 55° and the Novel 1 design (110/70) with nozzle and spear tip angles of 110° and 70° based on previously published CFD optimisation studies. The optimisations in the previous studies showed that the nozzle and spear angles in the upper limit of the investigated test plan, which was much higher than current industry guidelines, gave higher efficiencies. The DoE response surfaces in that study suggested that the optimum nozzle and spear angles may be even steeper and therefore an additional, third design (Novel 2) with even steeper angles (150/90) was also manufactured and tested.
This paper presents the experimental data obtained for the three injector designs which were tested in a Turgo model turbine at various rotating speeds and flow rates. The 70 kW Turgo was coupled to a 75kW DC generator which allowed continuous speed regulation. The inlet conditions into the Turgo model turbine were controlled by a high head adjustable speed multistage pump of nominal operation point Q=290 m3/h, H=130 m (coupled via a hydraulic coupler to a 200 kW induction motor) which pumped water from the 320 m3 main reservoir of the Lab. The tests were carried out in single jet and twin jet operation. Testing and calibration of all the sensors was carried out according to testing standard IEC 60193 Hydraulic turbines, storage pumps and pump-turbines – Model acceptance tests (IEC 60193:1999).
and are presented to qualitatively analyse the impact of each injector design on the disturbances on the outside of the jet.
A further 2D axisymmetric CFD analysis is carried out to validate the measurements and to analyse the mechanisms which lead to injector losses. The results found that the majority of the losses occur in the region just upstream of the nozzle exit, where the static pressure is converted into dynamic pressure and the flow accelerates. In the Standard design, this conversion begins sooner and the flow travels over a longer distance at higher velocities leading to an increase in the losses. The CFD results found the differences between the designs to be smaller than the experiments however the trend of the results was similar, suggesting that the steeper angle injectors achieve higher efficiencies and better jet quality. The next stage of this research is to carry out a CFD analysis of the three injector designs in 3D, including the guide vanes and branch pipes, to investigate the impact of the steeper angles on the secondary velocities within the jet and the impact this has on the runner performance.
1.
Introduction
The Turgo turbine was invented by Eric Crewdson of Gilkes in 1919 and is suitable for medium head applications. The turbine is an impulse machine and produces power by utilising an axially inclined high velocity water jet impinging on a number of blades. To date, there have been several studies where numerical techniques are used to model the performance of impulse turbine injectors [1-7]. Despite the Turgo sharing the same injector design with the Pelton turbine, studies that analyse the performance of injector designs experimentally [8-10] have been focussed on the Pelton turbine and there has been little research into the impact of the injector geometry on the performance of Turgo turbines. A review paper [11] into the experimental and numerical Turgo research shows that although some studies have been carried out using both CFD [12-15] and experimental techniques [16-20] the focus has been on the geometry of the runner, not the injectors. A recent study [21] used two modern commercial CFD software packages to compare the performance of a standard and improved impulse turbine injector and their impact on the performance of a Turgo runner. The results for both CFD tools suggest that steeper injector nozzle and spear angles will reduce the injector losses, showing an increase in efficiency of 0.76% for the Turgo 3D injector.
In the present study, experimental results are used to compare the performance of the standard and improved injector geometry presented in [21], as well as to examine an additional steeper nozzle and spear tip configuration for a Turgo test case. The standard configuration was tested and used as a datum for the comparison. The study was taken further using CFD simulations of the injectors in order to understand why both novel designs were more efficient than the standard design, as shown experimentally. 2D axisymmetric simulations of the injector were performed to analyse the effect of the nozzle and spear configuration on the flow patterns and formation of the free jet.
2.
Turgo Injector Testing
2.1 Injector designs and test rig
Fig.1. Turgo Nozzle and spear angle variations used in the tests.
As an increase in the nozzle and spear angle reduces the maximum flow rate the injector can accommodate, (i.e. for large spear travel the flow rate is lower at the cases of higher nozzle angles due to geometrical conditions) therefore the Novel 1 and Novel 2 injectors were scaled up in order to match the maximum flow rate of the Standard injector. The scaling used can be seen in Table 1, below.
Injector design Nozzle Angle [deg]
Spear Angle [deg]
Nozzle Diameter [mm]
Standard 80 55 78.00
Novel 1 110 70 81.25
Novel 2 150 90 84.70
Table 1-Turgo injector main dimensions
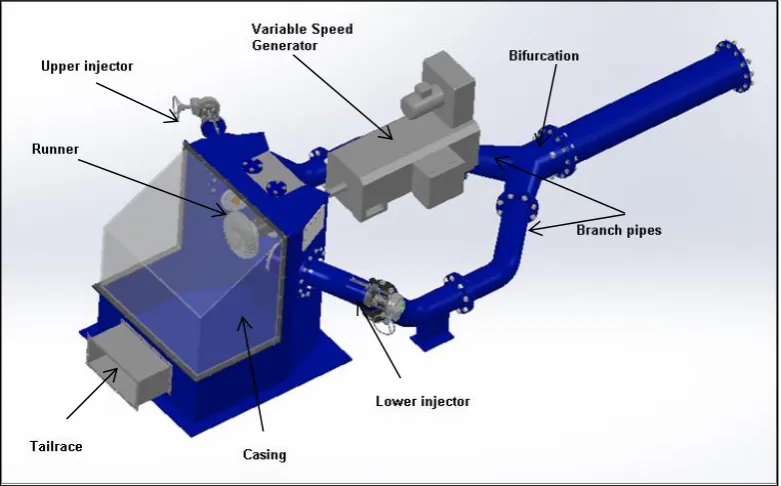
[image:3.595.73.464.486.729.2]The tests were carried out using a commercial Gilkes 9” Turgo design with a runner nominal diameter of 229 mm. The 70kW turbine has a rated head of 50m, single jet flow rate of 0.0654m3/s (Q11=0.176m3/s) and nominal speed of 1330rpm. The layout of the main components of the new Turgo test rig are shown in Fig.2 and an image of the completed test rig installed in the LHT is shown in Fig.3.
Fig.3. New Gilkes 9” Turgo test rig, Laboratory for Hydraulic Machines, NTUA
Testing and calibration of all the sensors was carried out according to testing standard IEC 60193 Hydraulic turbines, storage pumps and pump-turbines – Model acceptance tests (IEC 60193:1999).
The sensors used on the Turgo test rig and the details of their operation are given in Table 2 below. The total systematic uncertainty was calculated from the calibration error for each instrument as ±1.01%. The total random uncertainty, at 95% confidence using the Student’s T distribution (as recommended by the IEC60193 standards) was calculated at ±0.09%. This gives a total uncertainty of 1.02%. However, as the purpose of this study is to compare the difference in performance of the three injector designs, the systematic uncertainty can be disregarded when drawing comparisons.
Instrument Manufacturer and Model
Measured Parameter Range Calibration error Pressure sensors ESI Technology Ltd.,
model: Ellison-Pr3200
Net head (H) 0-10bar ±0.3%
Flow meter ABB, model: DE41F Flow rate (Q) 0-600m3/hr ±0.5%
Speed sensor Efectron, model: GA3005-ANKG
Rotational speed (n) 100 pulses/rev ±0.1%
Torque meter Datum electronics, model: M425
Torque (M) 0-600Nm ±0.3%
Table 2- details of the sensors used for the generation of the turbine hill charts
[image:4.595.75.521.537.684.2]𝑛11=𝐷2×√𝐻𝑛 (1)
𝑄11= 𝑄/𝑁𝑗
𝐵2×√𝐻 (2)
𝑃𝑜𝑢𝑡= 𝑀𝑚𝜔 (3)
𝑃𝑖𝑛= 𝜌𝑔𝐻𝑄 (4)
𝜂 =𝑃𝑜𝑢𝑡
𝑃𝑖𝑛 (5)
Where n11 is the unit speed, Q11is the unit flow rate,𝜂is the efficiency, n is the rotational speed of the runner, H
is the net head, Q is the flow rate, Njis the number of jets, M is the torque measured on the turbine shaft, ρ is the
density of water and g is the acceleration due to gravity. ρ and g were calculated according to the tables provided in the testing standards (IEC60193:1999).
For each test point, 180 readings are taken from the pressure, torque, flow and speed sensors over a period of 90 seconds. From these voltage readings, the pressure, flow rate, speed and torque can be calculated using the calibration curves for each instrument and used to determine the efficiency.
2.2 Injector test plan
The Turgo injector test plan was constructed to incorporate lower flow rates than normally tested. Eight flow rates were selected, ranging from a unit flow rate, Q11, of 0.03 m3/s to 0.25 m3/s. The spear position was adjusted in 0.25 mm increments in order to match the flow rates as closely as possible for each injector design. For each flow rate, four rotational speeds were tested, with unit speeds, n11, from 38 rpm to 50 rpm. As the maximum spear travel is restricted by the worm gear to around 43.5 mm we were unable to test the injectors up to the fully open position so instead we tested to a maximum flow rate of around 0.0997 m3/s (Q11=0.27m3/s). The unit flow rate Q11 is plotted against the spear travel/standard injector diameter (s/Ds) for each injector in Fig.4.
Fig.4. Flow curve comparison for the Standard, Novel 1 and Novel 2 injectors
0 0.05 0.1 0.15 0.2 0.25 0.3
0 0.1 0.2 0.3 0.4 0.5 0.6
Q11
[m
3/s]
s/Ds
Standard Novel 1 Novel 2
2.3 Injector test results
For each single jet flow rate at n11=42 rpm (which is the closest test speed to the nominal n11 of 43 rpm) the jet was photographed in order to investigate the impact of the nozzle and spear angles on the jet surface quality. The two lowest flow rates (Q11=0.03-0.07 m3/s), where the disturbances on the outside of the jet and the jet dispersion are greatest, are shown in Fig.5. The higher flow rates (Q11=0.11-0.25 m3/s), where there are less disturbances in the jet, are shown in Fig.6. What is interesting from these images is that for the steeper angled designs (Novel 1, Novel 2) the jet dispersion (beyond the vena Contracta) is more pronounced, particularly at the lowest flow rate (Fig.5). As the spear opening is increased, the jets of the three injectors become more similar, although the disturbances on the outside of the steeper angled designs are slightly more pronounced (Fig.6).
Standard Novel 1 Novel 2
Q11=0.03 m3/s
Q11=0.07 m3/s
Standard Novel 1 Novel 2
Q11=0.11 m3/s
Q11=0.19 m3/s
Q11=0.25 m3/s
All turbine efficiency measurements have been normalised against the highest recorded efficiency value. For the lowest flow rate (Q11= 0.03 m3/s or ~10% of the maximum flow rate), the normalised efficiencies were very low (below 85%) and the results were rather spurious (Fig.7 and Fig.8).As can be seen in Fig.5, the Standard injector produces a more stable jet for such a small flow rate, which results in higher turbine efficiency for both single and twin jet operation (Figs. 7 and 8). This difference is in the range of 5%-10% against Novel 2 design, whereas Novel 1 shows a less consistent performance (Figs. 7 and 8).
Fig.7. Single jet operation at Q11=0.03 m3/s
Fig.8. Twin jet operation at Q11=0.03 m3/s/injector
The higher jet dispersion seen for the Novel designs at low flow rates is likely due to the steeper nozzle angles that cause a more sudden change in direction of the water at the nozzle exit. Moreover, the spear travel from closed position for a particular low flow rate becomes smaller for steeper angles, and this may give rise to non-symmetric effects of possible very small imperfections or tolerances in the spear valve injector manufacture.
60 65 70 75 80 85
34 38 42 46 50 54
N
o
rm
al
ised
e
ff
ic
ie
n
cy
[%
]
n11 [rpm]
Standard Injector Novel 1 Injector Novel 2 Injector
60 65 70 75 80 85
34 38 42 46 50 54
N
o
rm
al
ised
e
ff
ic
ie
n
cy
[%
]
n11 [rpm]
The attainable efficiencies become quite high in the entire loading range of the turbine above that lowest flow rate, namely for Q11=0.07-0.27 m3/s, as can be seen in Figs. 9 and 10. Although the images in Fig. 6 give the impression that the Standard design produces a cleaner looking jet overall, the turbine efficiency with the steeper angled designs are considerably higher up to about Q11= 0.2 m3/s or ~70% of the maximum flow (Figs. 9 and 10).
The Novel 2 injector seems to perform best overall, and this is consistent with the results obtained in previous 2D injector simulations [21]. The achieved turbine efficiency with this injector is of the order of 0.5-1% higher than Standard design, for both single and twin jet operation (Figs. 9 and 10, respectively), at least up to the Best Efficiency Point loading (BEP single jet: Q11= 0.177 m3/s, n11= 43 rpm).
The performance of the Novel 1 design is similar to the Standard injector for single jet operation and between the other two designs for twin jet operation (Figs. 9 and 10). This behaviour may be attributed to possible very small differences between the two similar Novel 1 injectors’ design or installation.
Fig.9. Turgo injector efficiency comparison at n11=42rpm-single jet
94.0 95.0 96.0 97.0 98.0 99.0 100.0
0.05 0.10 0.15 0.20 0.25 0.30
N
o
rm
al
ised
e
ff
ic
ie
n
cy
[%
]
Q11 [m^3/s]
Fig.10. Turgo injector efficiency comparison at n11=42 rpm- twin jet
Fig.11 and Fig.12 show the variation in normalised efficiency with n11 at Q11= 0.19 m3/s which is closest to the BEP flow of Q11=0.177 m3/s. The results show that the Novel 2 injector performs better than the Standard injector across all unit speeds, for both single and twin jet operation, with the differences being greater at higher speeds. For single jet operation, the Novel 1 injector is very similar to the Standard injector but performs better during twin jet operation. As mentioned previously, this could be a result of slight differences in the geometry or fitting of the two Novel 1 injectors.
Fig.11. Single jet operation at Q11= 0.19 m3/s
94.0 95.0 96.0 97.0 98.0 99.0 100.0
0.05 0.10 0.15 0.20 0.25 0.30
N
o
rm
al
ised
e
ff
ic
ie
n
cy
[%
]
Q11 [m^3/s]
Standard Novel 1 Novel 2
96 96.5 97 97.5 98 98.5 99 99.5 100
34 38 42 46 50 54
N
o
rm
al
ised
e
ff
ic
ie
n
cy
[%
]
n11 [rpm]
Fig.12. Twin jet operation at Q11= 0.19 m3/s/injector
3.
Discussion
According to the experimental results, the new injector designs with steeper nozzle and spear angles provided an increase in the overall efficiency of the Turgo turbine. To have a better insight on why these design modifications have improved the performance, CFD analysis of the flow in the injectors has been carried out. The flow in the last section was modelled as a steady state axisymmetric case using the ANSYS Fluent software. The Volume of Fluid (VOF) multiphase model was used together with a RANS turbulence model, k-ω SST.
A grid convergence study has indicated that a very dense mesh containing 0.5 million mesh elements is required to accurately capture the flow behaviour. The solution is successfully converging with all residuals reaching a target of 10-7 using the Coupled Scheme (Pressure-Velocity) and double precision.
All the results were analysed using the equations presented below. The interest is to identify where the most energy is lost as the water escapes the injector into the air domain with atmospheric pressure. Eq. 1 was used to calculate the losses that are accumulated between the inlet plane and any selected downstream reference plane.
𝐿𝑟𝑒𝑓 = (1 − 𝑃𝑟𝑒𝑓
𝑃𝑖𝑛) ∙ 100% (1)
where Lref is the losses in the reference region, Pin is the power at the inlet plane and Pref is the power at the
reference plane.
The fluid power, Pref, at any selected reference plane is calculated using Eq. 2.
𝑃𝑟𝑒𝑓= ∫ (𝑝 +𝜌𝑢
2
2 ) ∙ 𝑢)
𝐴 𝑑𝐴 = ∑ 𝑝𝑛1 𝑖∙ 𝑢𝑖∙ 𝐴𝑖+ ∑ 𝜌𝑢𝑖2
2 ∙ 𝑢𝑖∙ 𝐴𝑖 𝑛
1 (2)
where pi is the static (gauge) pressure, ρi is the fluid density, and ui the fluid velocity at each individual mesh cell,
i, A is the area at the cross-section and n is the number of cells in A at this section. The two terms on the right side represent the fluid power due to pressure (potential energy) and to kinetic energy of the fluid, respectively.
96 96.5 97 97.5 98 98.5 99 99.5 100
34 38 42 46 50 54
N
o
rm
al
ised
e
ff
ic
ie
n
cy
[%
]
n11 [rpm]
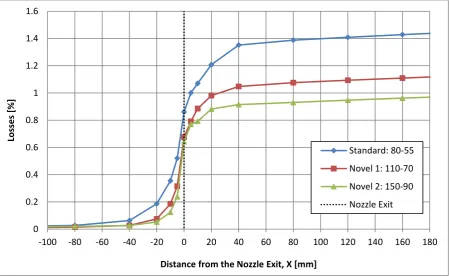
The accumulated injector losses at various reference locations are presented in Fig. 13. All these simulations were performed at the Best Efficiency Point conditions of the tested Turgo turbine. The vast amount of energy was lost right upstream and right downstream the nozzle exit. This was true for all the three injector designs that were analysed in this study. The CFD results agree with the experimental data showing that the Standard injector design is the least efficient and the Novel2 is the best design. The energy losses in the Standard design injector were 0.3 to 0.5% higher than in the two novel designs, whereas the experimental results show even larger differences. This indicates that the 3D flow structure details in the distributor, such as secondary flows that can affect both the jet quality and the runner performance, remain more pronounced through the Standard than the Novel injector designs. This was also shown in the numerical results of [21] obtained by 3D modelling of spear valve injectors.
It was also numerically shown, that modelling a complete 3D injector geometry amplifies the difference between the steeper and the shallower injector angle designs. These results, might explain why the experimental results also showed a larger difference between the losses when compared to the 2D axisymmetric CFD results.
Fig. 13. Aggregation of the injector losses upstream and downstream of the nozzle exit for different injector designs.
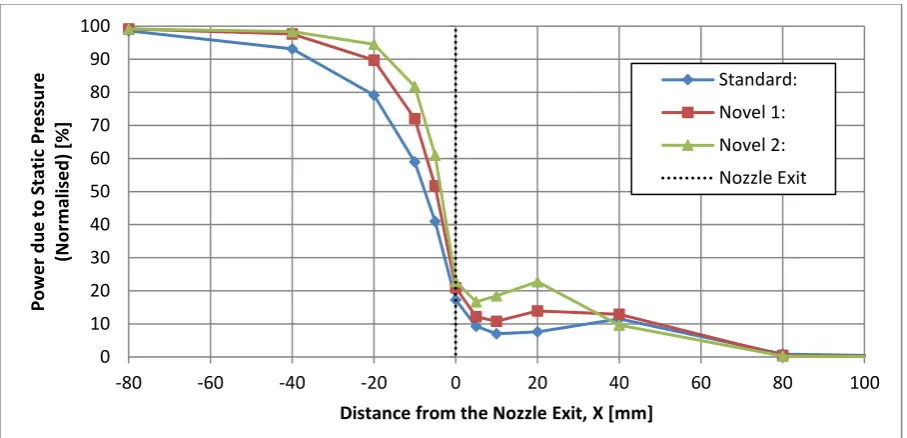
This behaviour can be explained with the aid of Fig. 14 that presents the variation of only the potential fluid power (gauge pressure) at various reference planes through the injector. The potential energy is gradually converted into kinetic energy, as the flow is approaching the nozzle exit and accelerates due to the cross section reduction (see Fig. 1). Drastic power conversion for all injectors can be observed in the region up to about 20 mm upstream of the nozzle exit, while the Novel2 design exhibits the steepest curve (Fig. 14). This happens because with this design the flow path area between spear and nozzle walls remains larger until almost the nozzle lips (Fig. 1). As a result, the acceleration of the flow in the injector is delayed, and consequently, the hydraulic (friction) losses are kept smaller.
Fig. 14 shows that a small amount (~20% for all injectors) of potential energy remains in the flow after the exit from the nozzle, and it is completely converted into velocity of the free jet at about 80 mm downstream (Fig. 14).
0 0.2 0.4 0.6 0.8 1 1.2 1.4 1.6
-100 -80 -60 -40 -20 0 20 40 60 80 100 120 140 160 180
Losse
s
[%
]
Distance from the Nozzle Exit, X [mm]
[image:12.595.74.524.262.538.2]Fig. 14. Change in the amount of potential fluid power for different injector designs. Results are normalised to the inlet power.
Finally, in addition to hydraulic losses in the injector, the quality of the jet, defined by the uniformity of its velocity profile and the smoothness of its surface, is another important factor as the jet is interacting with the blades of the Turgo runner. As it was shown in a previous study [21], the steeper angled nozzle and spear can produce a better quality jet than the standard injector design.
4.
Conclusions
A standard and two novel Turgo hydro turbine injector designs were experimentally tested, showing the impact of steeper nozzle and spear angles on the jet quality and the hydraulic performance of the injector and the turbine runner. The measurements of the model Turgo turbine’s efficiency showed that, with the exception of the extremely low flow rates, the injectors with steeper angles performed better, achieving an increase in efficiency of the order of 0.5-1% compared to the standard design, for a broad operating range below and above the best efficiency point. For very low turbine load (~10% of the maximum flow rate), the deformation of the jet and the associated drop in efficiency is more pronounced in the injectors with steeper angles, and this should be considered in (rare) cases that a turbine must operate under such conditions. The experimental results were confirmed by CFD analysis of the injectors, by simulating the 2D axisymmetric case of the injector’s final stage, were the vast majority of the losses occur. Although numerically the differences between the designs were found to be smaller, the trend of the results was similar, suggesting that the steeper angle injectors achieve higher efficiencies and better jet quality.
The present results contradict the preferred historical designs, which use much shallower nozzle and spear angles, and introduce new design guidelines for the spear valve injectors, which are also applicable to the more popular Pelton impulse hydro turbines.
Acknowledgements
The authors would like to thank Lancaster University Renewable Energy Group and Fluid Machinery Group, Gilbert Gilkes and Gordon Ltd and the Laboratory of Hydraulic Turbo Machines at the National Technical University of Athens.
0 10 20 30 40 50 60 70 80 90 100
-80 -60 -40 -20 0 20 40 60 80 100
Pow e r d u e to S tat ic Pr e ssur e (N o rm al ised ) [% ]
Distance from the Nozzle Exit, X [mm]
References
1. Catanase, A., M. Barglazan, and C. Hora, Numerical Simulation of a free jet in Pelton Turbine, in The 6th International Conference on Hydraulic Machinery and Hydrodynamics2004, Scientific Bulletin of the Politehnica University of Timisoara, Timisora, Romania.
2. Jošt, D., P. Mežnar, and A. Lipej. Numerical prediction of Pelton turbine efficiency. in 25th IAHR Symposium on Hydraulic Machinery and Systems. 2010. IOP Conf. Series: Earth and Environmental Science 12 (2010) 012080.
3. Muggli, F., et al., Numerical and experimental analysis of Pelton turbine flow. Part 2: the free surface jet flow, in 20 th IAHR Symposium2000.
4. Santolin, A., et al., Numerical investigation of the interaction between jet and bucket in a Pelton turbine. Proceedings of the Institution of Mechanical Engineers, Part A: Journal of Power and Energy 2009 223: 721, 2009. DOI: 10.1243/09576509JPE824.
5. Staubli T., et al. Jet quality and Pelton efficiency. in Hydro 2009. 2009. Lyon.
6. Veselý, J. and M. Varner, A case study of upgrading 62.5 MW Pelton turbine, in International Conference: IAHR 20012001: Prague.
7. Xiao, Y., et al., Numerical and experimental analysis of the hydraulic performance of a prototype Pelton turbine, in Institution of Mechanical Engineers, Part A: Journal of Power and Energy2014. p. 46-55. 8. Gass, M. and H. Water, Modification Of Nozzles For The Improvement Of Efficiency Of Pelton Type
Turbines, in Proceedings of the HydroVision Conference2002.
9. Staubli, T. and H.P. Hauser. Flow Visualization - a Diagnosis Tool for Pelton Turbines. in IGHEM2004. 2004. Lucerne, Switzerland.
10. Zhang, Z. and M. Casey, Experimental studies of the jet of a Pelton turbine. Proceedings of the Institution of Mechanical Engineers, Part A: Journal of Power and Energy, 2009. 221(8): p. 1181-1192
11. Benzon, D.S., G.A. Aggidis, and J.S. Anagnostopoulos, Development of the Turgo Impulse turbine: Past and present. Applied Energy, 2016. 166: p. 1-18.
12. Anagnostopoulos, J., et al., Optimal design and experimental validation of a Turgo model Hydro turbine, in 11th Biennial Conference on Engineering Systems Design and Analysis, A. 2012, Editor 2012. p. 157-166.
13. Anagnostopoulos, J.S., G. Aggidis, and D.E. Papantonis, Parametric Design and Optimization of Turgo Turbine Runners, in HYDRO 2015 Conference2015: Bordeaux, France.
14. Anagnostopoulos, J.S. and D.E. Papantonis, Flow Modelling and Runner Design Optimization in Turgo Water Turbines. World Academy of Science, Engineering and Technology 2007, 2007. P206-211.
15. Correa, J., J.D. Andrade, and M. Asuaje, A Preliminary Analysis of a Turgo Type Turbine CFD Simulation Designed With an Integrated Dimensional Methodology, in 24th Symposium on Fluid Machinery2012: Rio Grande, Puerto Rico, USA, July 8–12, 2012.
16. Cobb, B.R., Experimental Study of Impulse Turbines and Permanent Magnet Alternators for Pico-hydropower Generation, in A THESIS Submitted to Oregon State University in partial fulfillment of the requirements for the degree of Master of Science2012: Presented July 8, 2011 Commencement June 2012. 17. Gaiser, K., et al., An experimental investigation of design parameters for pico-hydro Turgo turbines using
a response surface methodology. Renewable Energy, 2016. 85(0): p. 406-418. 18. Webster, J., Hydraulic impulse turbines of high specific speed. 1973.
19. Williamson, S.J., B.H. Stark, and J.D. Booker, Experimental optimisation of a low-head pico hydro turgo turbine, in Proceedings of the 3rd IEEE international conference on sustainable energy technologies2012. p. 322-7.
20. Williamson, S.J., B.H. Stark, and J.D. Booker, Performance of a low-head pico-hydro turgo turbine. Applied Energy, 2013. 102: p. 1114–26.
21. Benzon, D.S., et al., Numerical Investigation of the Spear Valve Configuration on the Performance of Pelton and Turgo Turbine Injectors and Runners. Journal of Fluids Engineering, 2015. 137(11): p. 111201-111201. 22. Benzon, D.S., et al., Impulse turbine injector design improvement using Computational Fluid Dynamics.
The Authors
Dr D. S. Benzon graduated Mechanical Engineering and received a Ph.D. from Lancaster University in the optimisation of impulse turbines and injectors using CFD and experimental testing. He has published several research papers on hydro power and tidal power and currently works for the global engineering consultancy firm Mott MacDonald Ltd on Hydro and Tidal power projects across the globe.
Dr A. Židonis graduated in Mechanical Engineering from Lancaster University, UK, and received his Ph.D. in hydroturbine optimisation using Computational Fluid Dynamics from the same university. He is a member of Lancaster University Renewable Energy Group who specialises in numerical modelling, process automation, design optimisation and experimental testing. For his academic achievements, Audrius has received the Lancaster University Dean’s Award for PhD Excellence (Dec 2014) winning the competition among all the PhD students within the Faculty of Science and Technology. Based on the work completed during his PhD that was funded by Gilbert Gilkes and & Gordon Ltd, Audrius has published 8 journal papers (peer reviewed). Currently, his main activity is providing R&D and engineering consulting in private sector.
Dr A. Panagiotopoulos graduated in Mechanical Engineering from National Technical University (NTUA) of Athens, Greece, and received his Ph.D. in optimisation of impulse turbines based on both in-house and commercial CFD codes and extended experimental investigation. Part of the Ph.D was conducted in Lancaster University in collaboration with the Lancaster University Renewable Energy Group. He is a member of the Laboratory of Hydraulic Turbomachines in NTUA working as a post-doctoral researcher with 4 scientific publications in international journals (peer reviewed). Simultaneously, he is working as freelancer in the fields of design modelling and CFD.
S. Petley is a Ph.D. student in Mechanical Engineering at Lancaster University, and received his MEng degree in Sustainable Engineering from the same university in 2014. His research interests include the design, simulation and experimental testing of hydraulic machinery. Specifically, his Ph.D. research relates to the optimisation of impulse turbine casings, which is funded by Gilbert Gilkes and & Gordon Ltd.
Professor G.A. Aggidis, is Professor of Energy Engineering at Lancaster University, UK, and Director of Lancaster University Renewable Energy Group & Fluid Machinery Group. He trained with Mather & Platt Ltd, Manchester, UK and was Director and Engineering Development Manager for the Fluid Machinery, and Hydropower UK company, Gilbert Gilkes & Gordon Ltd. He has over 150 research papers, designs, developments and 12 patent contributions in the field of fluid machinery and renewable energy, developed turbines for hydro power generation projects and has physical research prototypes of fluid machinery operating successfully worldwide. He has a strong focus on engineering science applied to industry-led requirements in renewable energy and fluid machinery. His main research area is in computational and experimental modelling, control and the economics of novel fluid machinery applied to energy and renewables, including wave, tidal and hydro power.
Professor J.S. Anagnostopoulos graduated in Mechanical Engineering from the National Technical University of Athens, Greece, and received his Ph.D. in Computational Fluid Mechanics from the same University. He worked for several years as post-doctoral researcher in the NTUA and as R&T consultant in the private sector where he has been involved in feasibility studies for various industrial innovations. He has participated in more than 40 research projects, and has more than 100 scientific publications in international journals and conferences. Also, he has developed a number of advanced computer codes for the simulation of various fluid mechanisms in industrial applications, as well as for modelling and optimisation of hydroelectric and hybrid energy systems with pumped storage. He is Professor in Hydraulic Turbomachines and Installations at the School of Mechanical Engineering, NTUA, Greece and his current research activities include flow simulation and hydrodynamic design in pumps and hydroturbines.