Engineering FEA Sintering Model Development for Metal Supported SOFC
R. Chatzimichaila, R. Dawsona, S. Greena, D. Sullivanb, S. Mukerjeeb and M. Selbyb
a Lancaster Univeristy Engineering Dept, Gillow Avenue, Lancaster LA1 4YW, UK b Ceres Power Ltd, Viking House, Foundry Lane, Horsham, RH13 5PX, UK
In a collaboration between Ceres Power and Lancaster University, funded by Innovate UK, an engineering FEA model is being developed to further understand the manufacturing processes, such as the densification of the ceria based electrolyte. In these models material properties, such as the Thermal Expansion Coefficient, Young’s Modulus, layer densification rates and creep are critical inputs. These properties, when interacting with the applied thermal processes, give rise to stresses within the layers which can result in permanent deformation and residual stresses at the end of the process steps at room temperature. A deep analytical understanding of these material-process interactions can be used to optimise sintering time, energy usage, residual part stresses or distortion in a rapid and low cost way through the use of validated CAE models. Results will be presented from the modelling techniques for an example metal supported SOFC to demonstrate the importance of the above mentioned properties. Sensitivity study results will also be presented to show the impact of variability of the manufacturing process.
Introduction
Ceres Power is continuing to make excellent progress in the development of its low temperature metal supported SOFC design (the ‘Steel Cell’) based predominantly around the use of Ceria. This unique design architecture allows for a robust, low cost, subsidy free fuel cell product, whilst retaining the advantages of fuel flexibility, high efficiency and low degradation.
The combination of low operating temperature (and thus the ability to use low-cost materials in the stack and balance of plant), metal support and careful optimization of the microstructure of the ceramic layers allows both low stack and BOP cost and very high robustness to real-world operating conditions, whilst maintaining high efficiency using real world fuels, as for conventional SOFCs.
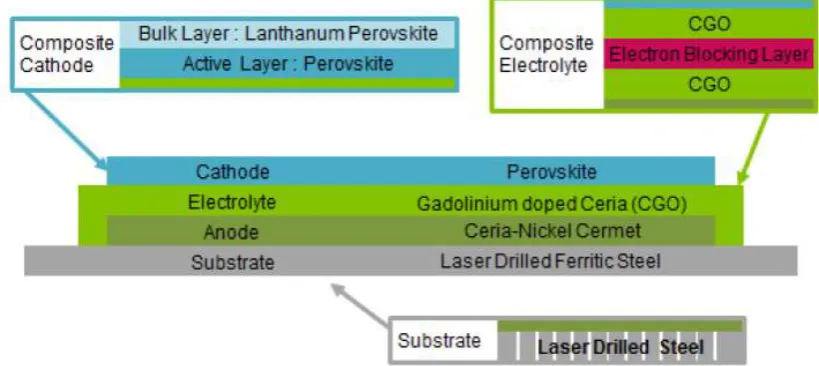
cathode. The cathode has a conventional structure of a thin active layer where the oxygen reduction reaction occurs and a thicker bulk layer for current collection. The cathode electro-catalyst and current collector are perovskites; the exact choice of perovskites contributes significantly to the outstanding stability of the cells to thermal cycling. The combination of these materials allows the Steel Cell to operate at low temperatures (500 – 620 °C) compared to conventional SOFCs, but also have great mechanical robustness, whilst maintaining high volumetric power density (Figure 1).
One of the main reasons that the Steel Cell is so robust is its unique manufacturing process. The combination of materials preparation and processing give the Steel Cell high mechanical stability and performance. Understanding the stress evolution and distribution during manufacturing as well as the residual stresses after is very important, because it gives an insight to how the cell will behave under the desired operating conditions, further enhancing the rapid development of the Ceres Power products (1, 2).
[image:2.595.91.501.335.518.2]For this work the principles of the Steel Cell manufacturing process were simulated by means of Finite Element Analysis. The aim was to understand the deformation as well as the maximum stresses and stress distribution during and after the Steel Cell manufacturing process.
Figure 1. Schematic representation of a Ceres Power Steel Cell.
Methods and materials
Simulation approach
The use of Finite Element Analysis is very important for understanding SOFC development during its manufacturing process. Since the Steel Cell is a combination of a metal substrate and ceramic layers with different thicknesses, it is essential to have an insight of how these materials behave under high temperatures.
cell thickness and at the interfaces between layers as well. The layers that are simulated are the substrate, anode and thick-film electrolyte layer. These layers constitute the most significant parts of the manufacturing process, the successful formation of which largely dictate the overall form and residual stress levels of the complete cell. Therefore, the simulation primarily concentrated on the formation of these layers and the results presented here exclude the remaining processing steps towards the full cell.
Hence, for the purposes of this work coupons of steel substrate with anode and electrolyte layers are simulated through the sintering process using the software ABAQUS. The details of the model’s setup are presented below.
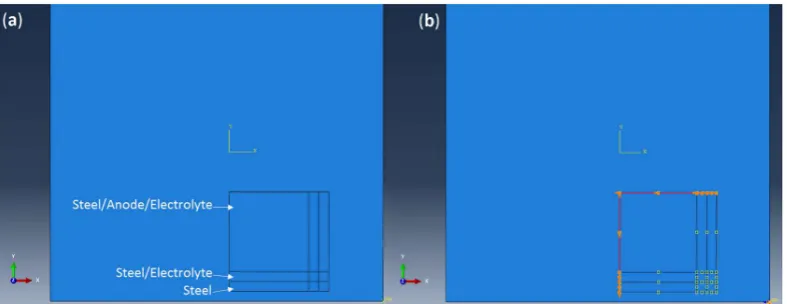
Assembly. The coupons (100 x 100 mm) are placed on a flat rigid surface through the whole simulation (Figure 2a).
Steps. As the ceramics become denser during sintering, it is very important to understand how the steel behaves during this process. To ensure that the simulation runs without computational problems as well as reflect the manufacture of the Steel Cell, in this modelling experiment the sintering is achieved in two steps, one that heats up to 700 °C and a second one that goes to the sintering temperature. During this sintering process the electrolyte densifies effectively increasing the elastic modulus of the layer and imparting strain in the system. This is then followed by cooling steps, one step per 200 °C until room temperature. The Time period of every step was consistent with those typical of the manufacturing processes used in practice. This thermal history is a computational artifact rather than a description of how the cells are actually fired; this is an acceptable approximation that leads to efficient computing times and acceptable validation.
Interactions. ABAQUS captures the frictional interaction and hard contact between the cell and the rigid surface that the cell is placed on during processing
Mesh. The element type is automatically generated by ABAQUS to be S4R, which are thin shell 4 node linear elements, the size is setup to be 4 mm and the number of elements is 145.
Boundary conditions. To minimise the need for computational resources, symmetry boundary conditions were applied on the x and y axes (Figure 2b).
[image:3.595.102.496.557.709.2]The sensitivity study performed for this work aims in understanding the dominant variables that affect the final state of the coupon cell, in terms of deformation, peak electrolyte stress during sintering and residual stresses at room temperature after electrolyte layer formation. The variables were simulated at a highest and a lowest value considered likely. A Full Factorial, 2 level, 5 factor experimental design was applied to the following variables were selected:
Peak temperature
Anode and Electrolyte layer thicknesses
Anode and Electrolyte Young’s Moduli, where the highest value is 10% more than the nominal and the lowest is 10% less.
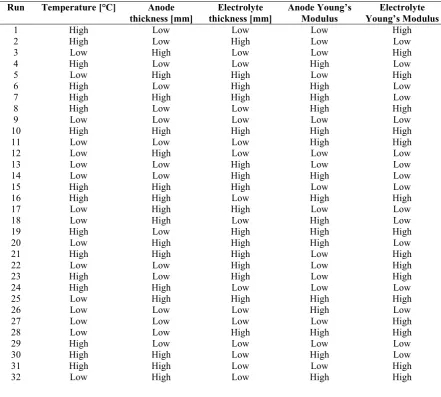
The sensitivity study models were generated by the software Minitab and are presented in Table 1. The substrate’s thickness remains constant.
Materials input
One of the greatest features of the Steel Cell is the novelty of the ceramics used, which are manufactured at Ceres Power. For this reason, all the material properties were measured with the equipment available in the business and at Lancaster University.
For the purposes of these simulations the properties of the following materials were measured:
• Anode: CGO based NiO ceramic • Electrolyte: CGO based ceramic • Substrate: Ferritic steel (2).
As the sintering process is being modelled, the following material properties are required: Thermal expansion Coefficient, Young’s Modulus, density and creep. The sintering simulation captures the evolution of layer stiffness and strain during the formation of the dense electrolyte and porous cermet anode.
The thermal expansion was measured by using Linseis L75 Platinum Series Dilatometer. The samples were bars of 20 mm in length and 5 mm in width. The obtained data was Δl against temperature, which was used to calculate the Thermal Expansion Coefficient using Equation 1.
α=Δl/(l0ΔT) [1]
Where α is the Thermal Expansion Coefficient, l is the length of the sample, l0 is the
initial length of the sample at room temperature and ΔT is the temperature difference. The sintering shrinkage profiles of the ceramics were also obtained by using the dilatometer and helped inform the layer sintering model in ABAQUS. Pellets of 4-5 mm length were made for this purpose. The powder preparation mimicked the manufacturing process to ensure that the green density was the same as on the Steel Cell. Using SEM analysis it was confirmed that the pellets had the same microstructure as the layers on the cell.
The creep model that was used for this simulation is the hyperbolic sine model, which captures the effect of temperature and stress on creep strain rate and it is calculated from Equation 2 (3).
The data used to calculate the creep as well as Young’s Modulus were obtained from Ceres Power’s library. The steel’s material properties were provided from the manufacturer. As the materials used on the Steel Cell is proprietary information, no further details can be reported in this work. The responses of the set of materials used for these simulations have been validated for the current version of the Steel Cell.
TABLE I. Sensitivity study models.
Run Temperature [°C] Anode thickness [mm] Electrolyte thickness [mm] Anode Young’s Modulus Electrolyte Young’s Modulus 1 2 3 4 5 6 7 8 9 10 11 12 13 14 15 16 17 18 19 20 21 22 23 24 25 26 27 28 29 30 31 32 High High Low High Low High High High Low High Low Low Low Low High High Low Low High Low High Low High High Low Low Low Low High High High Low Low Low High Low High Low High Low Low High Low High Low Low High High High High Low High High Low Low High High Low Low Low Low High High High Low High Low Low High High High Low Low High Low Low High High High Low High Low High High High High High Low High Low Low High Low Low Low Low Low Low Low High Low High High High Low High High Low Low High Low High Low High High High Low Low Low Low High High Low High Low High Low High High Low High Low High Low Low High Low High High Low Low Low Low High Low Low High Low High High High Low High Low High High Low Low High High Results
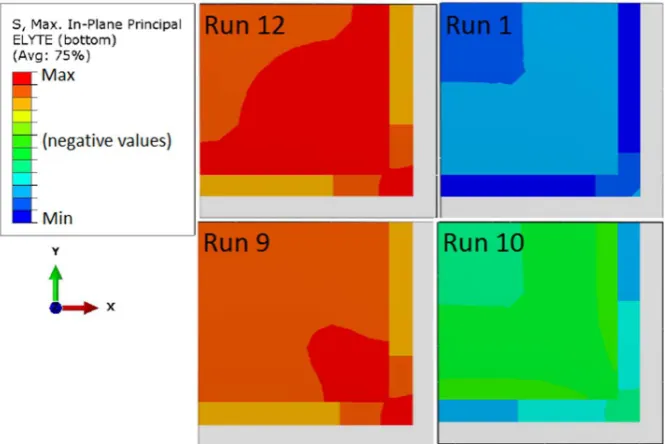
The maximum stresses during sintering, as well as the residual stresses and distortion afterwards, in the electrolyte layer of the coupons were studied. Representative contour plots are shown in Figures 3 – 5. ABAQUS shows the tensile stresses with positive values (Figure 1) and the compressive with negative (Figure 2).
After this heating process the coupon is distorted in the middle having a convex shape with the active part of the cell (anode and electrolyte) uppermost, as shown in Figure 5.
[image:6.595.89.511.170.288.2]Note: The stress gradient transition seems discontinuous, due to an edge singularity in the section where the anode is present, which is expected in the geometry of an FEA model.
[image:6.595.131.464.332.554.2]Figure 3. Maximum stresses during the sintering process.
Figure 5. Distortion after sintering.
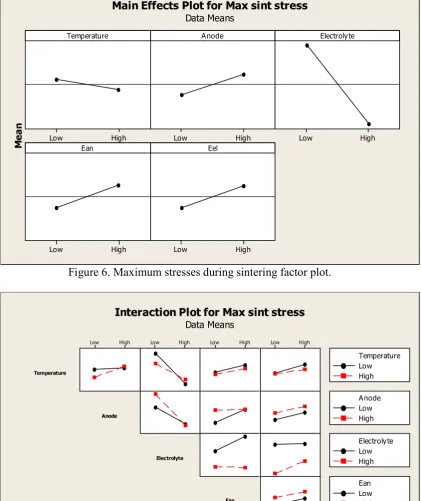
Maximum stresses during sintering
In Figure 6 it is very clear that the factor that affects the maximum stresses during sintering is the electrolyte thickness, with the strongest interaction being between this factor and the peak temperature. This is expected as the electrolyte shrinkage and thermal expansion coefficient difference give rise to creep deformation in the steel.
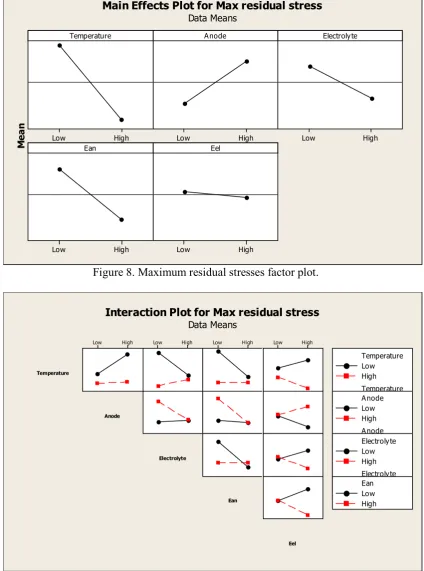
Residual stresses
As stress relaxation is a function of temperature, the residual stresses on the coupon cell after the sintering process are mostly affected by the peak temperature. However, Figure 8 shows that the strongest interactions are related to the electrolyte (electrolyte thickness with anode’s Young’s Modulus and electrolyte thickness with electrolyte’s Young’s Modulus).
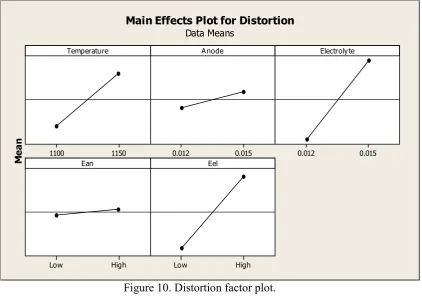
Distortion
Distortion, as shown in Figure 10, is mostly affected by the variables associated with the electrolyte. From Figure 11 though, the strongest interactions are between the Young’s Modulus of the ceramics.
High
Low Low High Low High
High
Low Low High
Temperature
M
ea
n
Anode Electrolyte
Ean Eel
Main Effects Plot for Max sint stress
[image:8.595.108.530.103.605.2]Data Means
Figure 6. Maximum stresses during sintering factor plot.
High
Low Low High Low High Low High
Temperature
Anode
Electrolyte
Ean
Eel
Low High Temperature
Low High Anode
Low High Electrolyte
Low High Ean Interaction Plot for Max sint stress
[image:8.595.107.531.389.677.2]Data Means
High
Low Low High Low High
High
Low Low High
Temperature
M
ea
n
Anode Electrolyte
Ean Eel
Main Effects Plot for Max residual stress
[image:9.595.102.527.103.675.2]Data Means
Figure 8. Maximum residual stresses factor plot.
High
Low Low High Low High Low High
Temperature
Anode
Electrolyte
Ean
Eel
Low High Temperature
Low High Temperature
Low High Temperature
Low High Temperature Low High Anode
Low High Anode
Low High Anode Low High Electrolyte
Low High Electrolyte
Low High Ean Interaction Plot for Max residual stress
[image:9.595.107.525.387.677.2]Data Means
1150
1100 0.012 0.015 0.012 0.015
High
Low Low High
Temperature
M
ea
n
Anode Electrolyte
Ean Eel
Main Effects Plot for Distortion
[image:10.595.108.531.88.384.2]Data Means
Figure 10. Distortion factor plot.
High
Low Low High Low High Low High
Temperature
Anode
Electrolyte
Ean
Eel
Low High Temperature
Low High Anode
Low High Electrolyte
Low High Ean Interaction Plot for Distortion
[image:10.595.107.531.94.681.2]Data Means
Figure 13. Distortion interaction plot.
In summary, this paper demonstrates the development of a model that allows for the prediction of manufacturing stresses in the Steel Cell. This model has huge benefits in enhancing the understanding and optimisation of future designs of both the part geometry and the process itself. It demonstrates the ability of this technique to fine tune the manufacturing processes for next generation of steel cells to reduce process waste in a lean manufacturing environment.
Further work
To further understand what other variables affect the Steel Cell during sintering, more sensitivity studies can be performed. As mentioned above, since the material properties are some of the most important inputs of the model, different materials development processes can be modelled and then validated, such as sintering ramp rates. The rate with which the ceramics compact is critical to the stresses induced to the part. In addition, since the steel is the stiffest component, further models can be created to understand how it affects the final state of the cell. Creep, elastic properties and thickness studies can be performed, along with the combination of the ceramics’ properties. The interaction results will give valuable information towards further developing the Steel Cell, by designing an even more robust and lower cost manufacturing process
Acknowledgments
This research is part of the KTP project between Lancaster University and Ceres Power Ltd and was partially funded by Innovate UK.
References
1. R. Leah, A. Bone, M. Lankin, M. Rahman, E. Hammer, A. Selcuk, A. Clare, S. Mukerjee and M. Selby, Proceedings of the 12th European SOFC and SOE forum, A0303, Chapter 02 (2016).
2. R. Leah, A. Bone, M. Lankin, A. Selcuk, M. Rahman, A. Clare, L. Rees, S. Phillip, S. Mukerjee and M. Selby, ECS Trans., 68 (1), 35 - 107 (2015).
3. H. Schlegl, R. Dawson, Proceedings of the 12th European SOFC and SOE forum, B0815, 109 - 119 (2016).