Giant interneurons (GIs) are important components of the neural circuitry controlling escape behavior in many invertebrates (Wine and Krasne, 1982; Eaton, 1984; Camhi, 1988; Gras and Hörner, 1992). In arthropods, including insects and crustaceans, a wealth of information is available about the physiology and functional significance of these key interneurons (Wine and Krasne, 1982; Glanzman and Krasne, 1983; Ritzmann and Pollack, 1986; Camhi, 1988; Hörner, 1992; Hörner et al. 1997c; Yeh et al. 1997).
The giant fiber system in orthopteran insects such as crickets or cockroaches consists of bilaterally symmetrical pairs of interneurons whose somata are located in the terminal ganglion (TG). Their axons ascend the ventral nerve cord contralateral to the cell bodies (Roeder, 1948; Mendenhall and Murphey, 1974; Jacobs and Murphey, 1987) all the way to the thoracic and head ganglia (Parnas and Dagan, 1971; Kämper, 1981; Kohstall-Schnell and Gras, 1994). The GIs receive excitatory input via cholinergic synapses (Sattelle, 1985) from cercal receptors mediating afferent input from the cerci, which are paired abdominal sensory organs that react to deflections of the
wind-sensitive filiform hairs on their surface (Edwards and Palka, 1974; Palka and Olberg, 1977; Tobias and Murphey, 1979; Kämper, 1984; Kanou and Shimozawa, 1984).
Electrophysiological studies in orthopteran insects have shown that the responses to wind stimuli in GIs can be modulated by the biogenic amines octopamine, serotonin or dopamine (Goldstein and Camhi, 1991; Weisel-Eichler and Libersat, 1996; Meusen et al. 1997). Moreover, the strength of the synaptic coupling between the interneurons and their efferent motor targets in thoracic ganglia is also influenced by biogenic amines (Casagrand and Ritzmann, 1992; Weisel-Eichler and Libersat, 1996). The probable neuronal sources of amines have been described at the cellular level by immunocytochemistry in crickets (Spörhase-Eichmann et al. 1992; Hörner et al. 1995, 1996).
Despite the available information about the effects of amines on the giant fiber pathway, the precise target sites and the cellular mechanisms of aminergic modulation are not well understood. For example, in intact preparations, it has been difficult to differentiate between the direct effects of amines Printed in Great Britain © The Company of Biologists Limited 1998
JEB1529
The electrophysiological properties of cultured giant interneurons isolated from the terminal ganglion of adult crickets (Gryllus bimaculatus) were investigated using whole-cell patch-clamp techniques. To allow for unequivocal identification of these interneurons in cell culture, a protocol for fast and selective labeling of their cell bodies was established. Prior to cell dissociation, the giant interneurons were backfilled through their axons in situ with a fluorescent dye (dextran tetramethylrhodamine). In primary cell cultures, the cell bodies of giant interneurons were identified among a population of co-cultured neurons by their red fluorescence.
Action potentials were recorded from the cell bodies of the cultured interneurons suggesting that several types of voltage-activated ion channels exist in these cells. Using clamp recording techniques, four voltage-activated currents were isolated and characterized.
The giant interneurons express at least two distinct K+ currents: a transient current that is blocked by
4-aminopyridine (4×10⁻³mol l−1) and a sustained current
that is partially blocked by tetraethylammonium (3×10⁻²mol l−1) and quinidine (2×10⁻⁴mol l−1). In
addition, a transient Na+ current sensitive to 10−7mol l−1
tetrodotoxin and a Ca2+current blocked by 5×10⁻⁴mol l−1
CdCl2have been characterized. This study represents the
first step in an attempt to analyze the cellular and ionic mechanisms underlying plasticity in the well-characterized and behaviorally important giant interneuron pathway in insects.
Key words: invertebrate, insect, cricket, Gryllus bimaculatus, ventral nerve cord, electrophysiology, identified neuron, cell culture, escape behaviour, giant interneuron.
Summary
Introduction
VOLTAGE-ACTIVATED CURRENTS IN IDENTIFIED GIANT INTERNEURONS
ISOLATED FROM ADULT CRICKETS GRYLLUS BIMACULATUS
PETER KLOPPENBURG1 ANDMICHAEL HÖRNER2,*
1Section of Neurobiology and Behavior, Cornell University, Seeley G. Mudd Hall, Ithaca, NY 14853, USA and
2Institute for Zoology and Anthropology, Department of Cell Biology, University of Göttingen, Berliner Straße 28,
D-37073 Göttingen, Germany
*Author for correspondence (e-mail: [email protected])
on the interneurons themselves and indirect effects due to modulation of their synaptic inputs.
In the present study, we describe a method of identifying in culture the somata of GIs that have been isolated from the TG of adult crickets. Similar methods have been used to label vertebrate (Dale, 1991) and insect (Hayashi and Levine, 1992) motoneurons prior to placing them in culture. By taking advantage of the controlled conditions provided by cell culture, we have characterized voltage-activated outward and inward currents using whole-cell patch-clamp recording techniques. This approach allows us to investigate the intrinsic physiological properties of interneurons that are devoid of their synaptic inputs. Such studies provide the basis for future voltage-clamp investigations of plasticity in this anatomically and functionally well-described neuronal pathway.
Preliminary results from these studies have been published in abstract form (Hörner et al. 1997a,b).
Materials and methods Animals
Adult male and female crickets (Gryllus bimaculatus de Geer) were used in these experiments. The animals were housed in crowded breeding colonies, fed ad libitum, and kept under a constant 12 h:12 h L:D photoperiod at 28 °C.
Backfilling of giant interneurons
Animals were mounted ventral side up in a wax dish, and the ventral sclerites anterior to the TG were removed. To allow selective labeling of the GI somata located in the TG, the abdominal connectives were exposed. The connectives were cut posterior to the fifth abdominal ganglion and immersed for 30 s in a small Vaseline trough filled with distilled water. Subsequently, the cut ends of the connectives were immersed in 1 % (w/v) dextran tetramethylrhodamine (Mr3000, anionic, lysine-fixable; Molecular Probes, Eugene, OR, USA) in distilled water. To prevent drying of the preparation and leakage of the dye, the incubation chamber was carefully sealed with Vaseline. For backfilling the somata of GIs, preparations were kept in the dark at 5 °C for 2–4 h.
The number of labeled neurons filled was checked with an epifluorescence microscope, and photographs were taken of some of the preparations (Zeiss Axioskop equipped with an epifluorescence illumination and appropriate filter set; excitation at 546 nm; beam splitter, 580 nm; emission at 590 nm).
Cell culture
After backfilling, the TGs from four cold-anesthetized crickets were pooled and rinsed thoroughly in cold sterile culture saline (see below). Prior to dissociation of neurons, the outer sheaths of the ganglia were removed. Neurons were cultured according to methods originally described by Hayashi and Hildebrand (1990). Ganglia were immersed in cold sterile culture saline containing (in mmol l−1): 149.9 NaCl, 3 KCl, 3
CaCl2, 0.5 MgCl2, 10 Tes, 11 D-glucose as well as 6.5 g l−1
lactalbumin hydrolysate, 5 g l−1 TC yeastolate (Difco), 10 %
fetal bovine serum (FBS), 100 i.u. ml−1 penicillin and
100µg ml−1streptomycin, adjusted to pH 7 (with NaOH) and
360 mosmol l−1 (with mannitol). For tissue dissociation, the
desheathed ganglia were subsequently transferred into Hanks’ Ca2+- and Mg2+-free buffered salt solution containing
0.5 mg ml−1collagenase (Worthington) and 2 mg ml−1dispase
(Boehringer Mannheim, grade II, protease neutral) for 2 min at 37 °C. Dissociation of neurons was aided by trituration with a fire-polished Pasteur pipette. The enzyme treatment was terminated by centrifugation (at 1000 rpm for 10 min in a benchtop centrifuge) of the cells through 6 ml of culture saline (see above) and then through an equal volume of culture medium. The culture medium was Leibovitz’s L15 medium (Gibco) to which was added (per 500 ml; see Hayashi and Hildebrand, 1990): 185 mg of alpha-ketoglutaric acid, 200 mg of fructose, 350 mg of glucose, 335 mg of malic acid, 30 mg of succinic acid, 1.4 g of TC yeastolate, 1.4 g of lactalbumin hydrolysate, 0.01 mg of niacin, 30 mg of imidazole and 2.5 ml of stable vitamin mix as well as 10 % FBS, 100µg ml−1
streptomycin and 100 i.u. ml−1 penicillin. The medium was
adjusted to pH 7 (with NaOH) and 360 mosmol l−1 (with
mannitol) and sterilized by filtration (0.22µm pore size) prior to use. After centrifugation (at 1000 rpm for 10 min in a benchtop centrifuge), the cells were resuspended in a small volume of culture medium (100µl per dish, cells from four TGs were plated in three dishes) and allowed to settle and adhere to the surface of culture dishes coated with concanavalin A (Sigma, 200µg ml−1) and laminin
(Collaborative Biomedical Products, 2µg ml−1). The cultures
were placed in a humidified incubator at 26 °C. The cells were used for electrophysiological experiments within 1–2 days, but they could be maintained in culture for 10–20 days.
Physiological recordings
Whole-cell gigaohm seal recordings were performed at room temperature (20 °C) according to methods described by Hamill et al. (1981). Electrodes (1–4 MΩ) were made from borosilicate glass (100µl micropipettes, o.d. 1.71 mm, i.d. 1.32 mm, VWR Scientific, West Chester, Pasadena, CA, USA) using a Flaming-Brown puller (P-87, Sutter Instrument Corp., San Rafael, CA, USA) and filled with a solution containing (in mmol l−1): 150
potassium aspartate, 10 NaCl, 2 MgCl2, 1 CaCl2, 10 EGTA, 2
ATP and 5 Hepes, adjusted to pH 7 (with KOH) and to 330 mosmol l−1(with mannitol). An Olympus IMT-2 inverted
microscope equipped with epifluorescence and Hoffman modulation contrast optics (Modulation Optics Inc., Greenvale, New York, USA) was used to visualize cells and to aid in the placement of patch electrodes on cells. The fluorescent illumination, which was necessary for cell identification, was used only briefly to prevent photodamage to the cells. To facilitate the formation of high-resistance (GΩ) seals, the culture medium was replaced with insect saline immediately before recording. The insect saline contained (in mmol l−1): 150
Whole-cell recordings were made using an Axopatch 1B amplifier (Axon Instruments, Foster City, CA, USA). The cells were examined both in current-clamp and in voltage-clamp mode. The data were digitized using a TL-1 or Digidata 1200 interface (both Axon instruments) and pClamp 6 software (Axon Instruments) run on a Gateway 2000 Spacecow i30486 PC. The electrophysiological data were sampled at intervals of 100µs and filtered at 2 kHz with a four-pole Bessel filter. Junction potentials were nullified prior to seal formation, and the pipette and membrane capacitances were compensated for. Series resistance compensation of 60–80 % was also applied. In addition, in most recordings, a P/4 protocol (see Armstrong and Bezanilla, 1974) was used. The software programs pClamp 6, Axograph 3 (Axon Instruments) and Delta Graph (Deltapoint) were used for data analysis.
Current isolation
Individual ionic currents were isolated using a combination of pharmacological agents, ion substitution and appropriate voltage protocols. A transient Na+ current (I
Na) was blocked using tetrodotoxin (TTX, 10−7mol l−1), while Ca2+ currents (ICa) were blocked with CdCl2 (5×10⁻⁴mol l−1). To confirm that the CdCl2block of ICawas effective in eliminating Ca2+ -activated K+ currents, in some experiments Ba2+was used in place of extracellular Ca2+. A transient K+ current (I
A; nomenclature adapted from Connor and Stevens, 1971) was blocked with 4-aminopyridine (4-AP, 4×10⁻³mol l−1), while a sustained K+ current (I
K(V)) was selectively blocked by quinidine (2×10⁻⁴mol l−1). In addition, tetraethylammonium (TEA+, 3×10⁻²mol l−1) blocked I
K(V) and Ca2+-activated K+ currents (IK(Ca)). As noted above, the latter currents were also eliminated when Ca2+currents were blocked by CdCl
2. CsCl replaced potassium aspartate in electrodes when all K+currents had to be blocked.
The voltage-dependence of activation of IA and IK(V) was determined by converting the peak currents to peak conductances (g) and scaling them as a fraction of the calculated maximal conductance (gmax). The equilibrium potential (EK) was calculated using the Nernst equation, assuming that the intracellular K+concentration is equal to the K+ concentration in the pipette solution. The resulting conductance/voltage (g/V) curve was fitted to a third-order (n=3) and a first-order (n=1) Boltzmann equation of the following form:
g/gmax = 1/{1 + exp[(VA−V)/s]}n, (1) where gmaxis the maximal conductance and s is a slope factor. For the third-order Boltzmann fit, VAis the voltage at which half-maximal activation of the individual gating steps occurs, assuming a third-order activation relationship according to the model of Hodgkin and Huxley (1952). For the first-order Boltzmann fit, VA(=V0.5) is the voltage of half-maximal activation of the peak current. For INa and ICa, the voltage-dependence was analyzed from current/voltage plots.
Steady-state inactivation for all currents was measured from a holding potential of −60 mV throughout. Voltage presteps of
200–1000 ms duration were delivered at 5 or 10 mV increments starting from −100 mV. Each prestep was followed by test pulses to −10 mV or +20 mV, and the peak current was measured. The data, normalized as a fraction of the calculated maximal conductance (for IA, IK(V)) or current (for INa), were fitted with a first-order Boltzmann equation based on the model of Hodgkin and Huxley (1952; equation 1). To determine the conductance/voltage or current/voltage curves, the isolated current data from different experiments were pooled and averaged (for details, see figure legends).
Time constants τ for activation and inactivation were determined by fitting the rising or falling phase of the currents with multiexponential curve-fitting routines provided within the pClamp 6 software package using the equation:
where Inand τnare the maximal amplitudes and time constants, respectively, of the different components, t is time and I0is the amplitude of current that does not inactivate with time. If the activation was too fast for reliable fitting, the time to peak current was measured instead.
Results
Labeling and identification of giant interneurons
By backfilling connectives with dextran tetramethylrhodamine for 2–4 h, we reliably stained the cell bodies of GIs in the TG (Fig. 1A). A good correlation was found between the numbers of somata labeled and the duration of dye application. With their large-diameter axons, the cell bodies of the GIs were always the first to show staining. The interneurons were easily identified by the position of the somata in the ganglion (Fig. 1A,B) and by the characteristic shape of their major dendrites. The morphological features of neurons labeled with dextran tetramethylrhodamine were indistinguishable from those injected with the dye Lucifer Yellow (Fig. 1A,C,D).
Using epifluorescence, labeled somata displaying a strong red fluorescence were easily detectable against the weak background fluorescence in the culture dish (Fig. 2A). In this way, the GIs were differentiated from other neurons. A typical culture dish contained 0–5 labeled GI cell bodies (typically cells from four animals were plated out in three culture dishes). No obvious differences were detected between labeled and unlabeled cells. After identification of the GIs, their electrophysiological properties were investigated using the whole-cell patch-clamp technique in current- and voltage-clamp mode.
Tissue culture
Neurons that were freshly dissociated from ganglia of adult animals readily attached within 1–2 h to the surface of a culture dish. Very thin filopod-like processes were detectable in the phase-contrast microscope at high magnification 2–3 h after (2)
−t
τ1
I = I0+ I1exp + ... + Inexp ,
Fig. 1. Identification of giant interneurons (GIs) in the terminal ganglion (TG) of the cricket Gryllus
bimaculatus. (A) Whole-mount
preparation of the TG showing the location of somata from GIs as revealed by backfilling of both connectives with dextran tetramethylrhodamine and viewed with epifluorescence illumination (montage of two planes of focus; anterior is up; incubation time 2.5 h; cell bodies from GIs are partially out of focus; compare with B–D). The soma of the medial GI (MGI, upper right arrowhead) is located in an anterior position contralateral to the major branchings (lower left arrowhead) in the synaptic region, and its ascending axon crosses the ganglionic midline via a commissure (middle arrowhead). The cell body of the lateral GI (LGI, upper left arrow) is located in a more posterio-lateral region contralateral to the dendritic arborizations (lower right arrow). (B) Schematic drawing of the morphology of GIs in the TG as revealed by cobalt backfilling (nomenclature according to Jacobs and Murphey, 1987). (C) Single cell staining of an MGI after intracellular injection of the fluorescent dye Lucifer Yellow into the major inner branch, which connects to the neurite and soma in the other ganglion hemisphere (montage of two planes of focus; arrowheads are as in A). (D) Single cell staining of an LGI after intracellular
injection of the fluorescent dye Lucifer Yellow at the site where the axon emerges from the dendritic region (montage of two planes of focus; arrows are as in A). N8–N10, nerves 8–10. Scale bars, 100µm.
B
7-1a 7-2a
8-2a
9-1b
9-2a
9-3a
10-3a
10-2a 11-1a
N10 N9 N8 8-1a
(MGI)
[image:4.609.208.562.548.731.2]9-1a (LGI)
plating. Small primary neurites were seen after 1 day, and cells survived in culture for up to 3 weeks. After 1 week in culture, widely distributed arborizations could be observed in many of the cultured neurons. The different shapes and patterns of the arborizations growing from the somata suggested the presence of different cell types in the cultures (Fig. 2B,C).
Current-clamp recordings
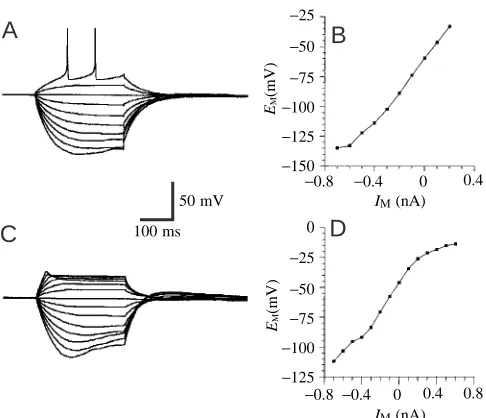
Current-clamp recordings from two identified GIs are shown in Fig. 3A,C. The resting potentials of the cultured GIs measured immediately after breaking into the cells ranged from −40 mV to −60 mV. This value is similar to values observed in GIs in intact ganglia (Meusen et al. 1997; Heblich and Hörner, 1998). However, because the pipette solution diffuses into the cell as soon as the membrane is ruptured (Pusch and Neher, 1988), these values may differ slightly from the true resting potential. In contrast to recordings under in vivo conditions (Murphey, 1973; Murphey et al. 1977; Meusen et al. 1997; see also Discussion), many of the GIs generated action potentials
in response to depolarizing current injection (Fig. 3A), suggesting the existence of at least two types of voltage-activated ion channels. Cells with lower (i.e. more positive) membrane potentials often did not fire action potentials when depolarized from the resting potential (Fig. 3C). However, action potentials could often be triggered in these cells if the depolarizing pulse was preceded by a hyperpolarizing step, suggesting that the low resting potential had led to inactivation of Na+channels.
Linearly increasing hyperpolarizing current pulses produced linearly increasing membrane potentials. However, at potentials more negative than approximately −100 mV, a characteristic ‘sag’ trajectory (Fig. 3A,C) was seen, which resulted in non-linear current–voltage relationships (Fig. 3B,D). This finding indicates the presence of a slow hyperpolarization-activated inward current in many of these neurons. Occasionally observed post-inhibitory rebound after hyperpolarization (Fig. 3C) supports this hypothesis.
Voltage-clamp recordings
When depolarizing voltage steps were delivered from a holding potential of −60 mV, a fast transient inward current was seen, followed by a sustained outward current (data not shown). Both the inward and outward currents are a combination of several ionic currents. Using ion substitution, pharmacological reagents and appropriate voltage protocols, several components were isolated from the inward and outward currents.
Outward currents
To measure outward currents, the transient inward current (INa) was blocked using TTX (10−7mol l−1) and Ca2+currents were blocked with CdCl2 (5×10⁻⁴mol l−1). Experiments in which the intra- and extracellular K+ concentrations were varied suggest that K+ is the major charge carrier of the outward current. Moreover, when Ca2+or Na+ currents were blocked, the magnitude and form of K+ current profiles were altered, suggesting that Ca2+- and Na+-sensitive K+ currents might exist in GIs. These were not explored further. During CdCl2 block of ICa, replacement of extracellular Ca2+ with Ba2+ had no further effect on the outward currents. In this study, we focus on voltage-activated ion-insensitive K+ currents, of which at least two exist in these neurons (Fig. 4A,B): (1) a transient current (IA) and (2) a sustained current (IK(V)). Both currents could be completely abolished by using K+-free patch pipette solutions. Both currents were seen in all neurons investigated, but the ratio between IAand IK(V) showed considerable variation.
Transient K+current (I A)
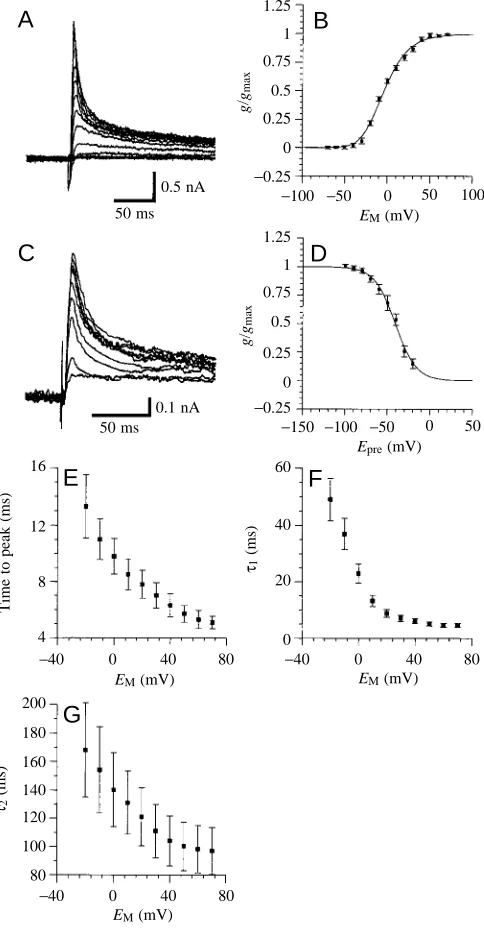
To measure IA(Fig. 5; N=6), the cells were superfused with saline containing 10−7mol l−1TTX, 2×10⁻⁴mol l−1 quinidine and 5×10⁻⁴mol l−1CdCl
2. IA activates at voltages above −40 to −30 mV and shows a rapid activation followed by a decay due to inactivation during a maintained depolarizing voltage step (Fig. 5A,B). Both activation and inactivation kinetics are
−150 −125
−0.8 −0.4 0 0.4
−0.8 −0.4 0 0.4 0.8
IM(nA)
IM(nA)
EM
(mV)
EM
(mV)
−100 −75 −50 −25
−125 −100 −75 −50 −25 100 ms
50 mV
0
A
B
[image:5.609.53.296.69.278.2]D
C
Fig. 3. Current/voltage (I/V) relationships from two giant interneurons (GIs) in culture. Current-clamp recordings during injection of current pulses with varying amplitudes (300 ms, 100 pA steps). Voltages were measured at the end of the current pulses. (A) Example of a GI with a high resting potential (−59 mV). The neuron starts to generate action potentials at voltages more positive than approximately −40 mV. (B) I/V relationship based on the recording shown in A. The cell input resistance, determined from the linear part of the I/V plot, is 140 MΩ. (C) Example of a GI with a low resting potential (−47 mV). The neuron does not generate spikes when depolarized from this membrane potential, but shows strong rectification during injection of depolarizing currents. (D) I/V relationship based on the recording shown in C. The cell input resistance, determined from the linear part of the I/V plot, is 125 MΩ. Both cells show a ‘sag’ trajectory when stepped to membrane potentials around −100 mV (or more negative), resulting in a reduction in the slope of the I/V plot in the negative voltage range.
voltage-dependent (Fig. 5A–D). The time to peak current decreased with increasing command voltage steps (Fig. 5E). IA inactivates with a short (τ1) and a long (τ2) time constant, both of which decreased when command voltages were increased (Fig. 5F,G).
Once inactivated, inactivation must be removed by hyperpolarization to allow a new activation. The conductance/ voltage relationship for steady-state activation (Fig. 5B) shows a typical voltage-dependence for activation of IAand was fitted to third- and first-order Boltzmann equations (equation 1). These fits show a half-maximal activation for the individual gating steps at −27.4 mV (s=−17.4), leading to half-maximal activation of the peak-current at −3.6 mV (s=−13.2; see Materials and methods for details). The voltage-dependence of the steady-state inactivation (Fig. 5C,D) is fitted well by a first-order Boltzmann equation (equation 1). The voltage for half-maximal inactivation was −40.8 mV (s=+12.3).
Sustained K+current
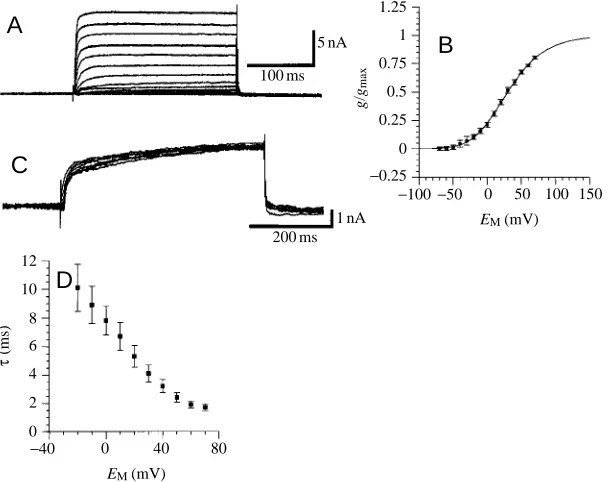
To isolate IK(V) (Fig. 6; N=8), the cultured neurons were superfused with saline containing 10−7mol l−1 TTX, 4×10⁻³mol l−14-AP and 5×10⁻⁴mol l−1CdCl
2. IK(V)activates at voltages above −50 to −40 mV (Fig. 6A,B). The isolated IK(V) did not decay during maintained depolarizing voltage steps (compare Fig. 6A,B with Fig. 5A,C). The conductance/voltage relationship for steady-state activation (Fig. 6B) was typical for IK(V). The curves were fitted with third- and first-order Boltzmann equations (equation 1). The third-order curve shows half-maximal activation for each gating step at −15.2 mV (s=−33.4), leading to half-maximal activation of the peak-current at +23.3 mV (s=−21.4). IK(V) showed little or no inactivation (Fig. 6C) even with depolarizations lasting 1 s or longer. IK(V) activates with a
A
B
100 ms [image:6.609.85.246.74.187.2]50 nA
Fig. 4. Voltage-activated K+ currents recorded from two different
giant interneurons in 10−7mol l−1 tetrodotoxin and 5×10⁻⁴mol l−1
CdCl2 (holding potential −70 mV; potential steps from −70 mV to
+70 mV in 10 mV increments). The current profiles consist of at least two components: (1) a transient current (IA) and (2) a sustained
current (IK(V)). Note the different ratios of IA to IK(V) in the two
different neurons in A and B.
−0.25 0
−100 −50 0 50
EM(mV)
EM(mV)
EM(mV)
0.25 0.5 0.75 1 1.25
−0.25 0
16 60
200
180
80 100 120 140 160
40
20
0 4
8 12
−150
−40 0 40 80 −40 0 40
−40 0 40 80
−100 −50 0
Epre(mV)
0.25 0.5 0.75 1 1.25
B
50 ms 0.5 nA
50 ms 0.1 nA
g
/gmax
g
/gmax
Time to peak (ms)
τ1
(ms)
τ2
(ms)
A
D
C
F
E
G
EM(mV)
100
80 50
Fig. 5. Transient K+current (IA). (A) Current traces for steady-state
activation of IA (holding potential −60 mV; following a 500 ms
prepulse to −90 mV, voltage was stepped from −70 mV to +70 mV in 10 mV increments). (B) Conductance/voltage (g/V) relationship for steady-state activation of IA. Conductances were calculated assuming
an equilibrium potential for K+, E
K, of −91.6 mV (see Materials and
methods). Values are means ±S.E.M. from six experiments, expressed
as a fraction of the calculated maximal conductance gmax. The curve
is a fit of a third-order Boltzmann equation with the following variables: VA=−27.4 mV; s=−17.4 (see equation 1). (C) Current
traces for steady-state inactivation of IA(holding potential −60 mV).
Test pulses (+20 mV) were preceded by 100 ms voltage pulses between −100 mV and −20 mV in 10 mV increments. (D) Conductance/voltage relationship for steady-state inactivation of IA. The curve is a fit of a first-order Boltzmann equation with the
following variables: V0.5=−40.8 mV; s=+12.3. (E) Time to the peak
current/voltage relationship for activation of IA. (F,G) Time constant
(τ)/voltage relationship for the fast (F; τ1) and slow (G; τ2) time
constants observed for inactivation of IA. Values are means ±S.E.M.
from six experiments. EM, membrane potential; Epre, voltage of the
[image:6.609.316.558.280.745.2]single time constant τ, which decreased with increasing command voltage steps (Fig. 6D).
Inward currents
To analyze the inward currents, outward currents were blocked by substituting Cs+for K+in the patch pipette solution and by adding 3×10⁻²mol l−1TEA+ and 4×10⁻³mol l−14-AP to the extracellular solution. The remaining inward current consisted of a rapidly activating/inactivating component and a more slowly inactivating component. The transient component was a Na+ current, and most of the sustained component represented a Ca2+current.
Na+currents
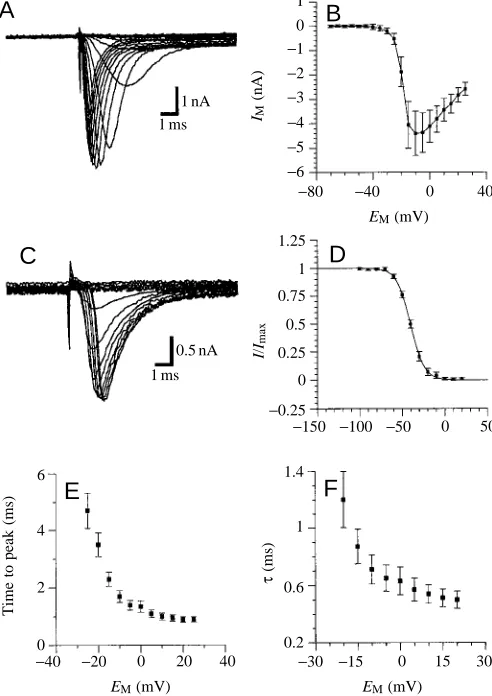
To measure INa (Fig. 7; N=3), the cultured cells were superfused with saline containing 4×10⁻³mol l−1 4-AP, 3×10⁻²mol l−1TEA+and 5×10⁻⁴mol l−1Cd2+. The remaining inward current could be blocked by 10−7mol l−1TTX and was reversibly eliminated when choline chloride replaced NaCl in the extracellular solution (data not shown). INaactivates and inactivates very rapidly (Fig. 7A). Once inactivated, inactivation must be removed by hyperpolarization prior to a new activation. In many recordings from GIs, INa appeared abruptly during gradual increases in the voltage steps, indicating imperfect voltage control (data not shown). The possible reasons for this are considered in the Discussion. Recordings indicating poor voltage control have not been included in the quantitative data analysis. The current/voltage relationship for steady-state activation (Fig. 7B), determined from the peak currents, was typical for activation for INa. The current is activated at potentials more positive than −35 to −30 mV, and the maximum current is seen at approximately −10 mV. This current decreased with more positive test pulses as they approached the Na+equilibrium potential (+68 mV; this
value was calculated using the Nernst equation and assuming that the intracellular Na+ concentration is equal to the Na+ concentration in the pipette solution).
The voltage-dependence of steady-state inactivation (Fig. 7C,D) is fitted well by a first-order Boltzmann equation (equation 1). The voltage for half-maximal inactivation was −40.4 mV (s=+8). Activation and inactivation kinetics for INa are both voltage-dependent. The time to peak current decreased with increasing command voltage steps (Fig. 7E). INa inactivates with a single time constant that decreased with increasing command voltage steps (Fig. 7F).
When the transient Na+ current was recorded under the conditions described, we often detected a sustained component to the inward current (Fig. 7A,C). This component was not blocked by CdCl2(5×10⁻⁴mol l−1) but could be eliminated by TTX (10−7mol l−1; data not shown), indicating the presence of a sustained Na+current.
Ca2+currents
To study ICa (Fig. 8; N=4), the cultured cells were superfused with saline containing 10−7mol l−1 TTX, 4×10⁻³mol l−1 4-AP and 3×10⁻²mol l−1 TEA+. I
Ca could be blocked by CdCl2(5×10⁻⁴mol l−1) and was eliminated when CaCl2in the extracellular solution was substituted by MgCl2. ICa activated rapidly and inactivated slowly during a maintained depolarizing voltage step (Fig. 8A). The current/voltage relationship for steady-state activation (Fig. 8B) for the peak currents shows a typical voltage-dependence for activation for ICa. This current was activated at command potentials more positive than −40 to −30 mV, with a maximum at approximately −10 mV. The current decreased during more positive test pulses as they approached the Ca2+ equilibrium potential (more positive than +45 mV, estimated using the Nernst equation and assuming that the intracellular
A
B
C
D
1.25
−0.25 0 0.25 0.5 0.75 1
g
/gmax
−100−50 0 50 100 150
EM (mV)
12
0 2 4 6 8 10
τ
(ms)
−40 0 40 80
EM (mV)
100 ms
200 ms 5 nA
[image:7.609.265.568.73.314.2]1 nA Fig. 6. Sustained K+current (I
K(V)). (A) Current traces
for steady-state activation of IK(V) (holding potential
−70 mV; voltage was stepped from −70 mV to +70 mV in 10 mV increments). (B) Conductance/voltage (g/V) relationship for steady-state activation of IK(V).
Conductances were calculated assuming an equilibrium potential for K+, E
K, of −91.6 mV (see Materials and
methods). Values are means ± S.E.M. from eight experiments, expressed as a fraction of the calculated maximal conductance gmax from each experiment. The
curve is a fit of a third-order Boltzmann equation with the following variables: VA=−15.2 mV; s=−33.4 mV.
(C) Current traces for steady-state inactivation of IK(V)
determined by applying voltage pulses (1000 ms) between −100 mV and −40 mV in 10 mV increments prior to test pulses to +20 mV (holding potential −60 mV). Data for steady-state inactivation of IK(V) are
not plotted because IK(V) does not show obvious
Ca2+concentration is much lower than 1 mmol l−1). Activation kinetics for ICa are voltage-dependent (Fig. 8E); the time to peak current decreased when command voltage steps of increasing amplitude were applied. The inactivation kinetics varied between recordings from different GIs. Steady-state inactivation of ICa(Fig. 8C,D) was measured from a holding potential of −60 mV. Decreasing voltage steps (−100 mV to −10 mV; 10 mV increments; 1000 ms) were followed by a test
pulse to −10 mV. Steady-state inactivation increased with the amount of depolarization of the prestep.
Generally, ICadecreased by more than 50 % within several minutes. This ‘rundown’ was increased with the number and particularly the amplitude of depolarizing voltage steps. Substituting Ca2+with Ba2+increased the maximum amplitude of the current, indicating that these ion channels were more permeable to Ba2+ than to Ca2+. However, this increase in conductance often led to a loss of voltage control, and we did not therefore study the Ba2+currents in greater detail.
Discussion
In this paper, we describe a method that allows the identification of giant interneurons (GIs) in primary cell culture. To ensure an unequivocal identification of the GIs in co-culture with other neurons, the cell bodies of the GIs were backfilled with a fluorescent dye prior to dissociation. Under controlled cell culture conditions, the voltage-activated currents of the GIs were investigated using whole-cell patch-clamp recording techniques. Several ionic currents were
A
B
C
D
E
0
−4 −3 −2 −1
IM
(nA)
−110 −55 0
Epre(mV)
−60 −30 0 30 60
EM(mV)
−40 0 40
EM(mV)
10 ms
25 ms 1 nA
1 nA
25
20
15
10
5
0
Time to peak (ms)
0
−15 −10 −5
IM
[image:8.609.306.560.70.315.2](nA)
Fig. 8. Ca2+current (ICa). (A) Current traces for steady-activation of
ICa(holding potential −60 mV; voltage was stepped from −40 mV to
−5 mV in 5 mV increments). (B) Current/voltage relationship for steady-state activation of ICa. Values are means ±S.E.M. from peak currents measured in four experiments. (C) Current traces for steady-state inactivation of ICa (holding potential −60 mV; the original
traces show test pulses to −10 mV preceded by 1000 ms voltage pulses between −90 mV to −10 mV in 10 mV increments). (D) Current/voltage relationship for steady-state inactivation of ICa.
Values are means ± S.E.M. from peak currents measured in four experiments. (E) Time to peak current/voltage relationship for activation of ICa. IM, membrane current; EM, membrane potential;
Epre, voltage of the prestep.
A
B
C
E
F
D
10
−6 −5 −4 −3 −2 −1
IM
(nA)
1.25
−0.25 0 0.25 0.5 0.75 1
I/
Imax
6
0 2 4
Time to peak (ms)
1.4
0.2 0.6 1
τ
(ms)
−80 −40 0 40
EM(mV)
1 ms
1 ms 1 nA
0.5 nA
−150 −100 −50 0 50
−40 −20 0 20 40
EM(mV)
−30 −15 0 15 30
EM(mV)
Fig. 7. Transient Na+ current (I
Na). (A) Current traces for
steady-state activation of INa (holding potential −70 mV; voltage was
stepped from −55 mV to +20 mV in 5 mV increments). (B) Current/voltage relationship for steady-state activation of INa.
Values are means ± S.E.M. from peak currents measured in three experiments. (C) Current traces for steady-state inactivation of INa
(holding potential −60 mV; test pulses to +20 mV were preceded by 1000 ms voltage pulses between −100 mV to +20 mV in 10 mV increments). (D) Current/voltage relationship for steady-state inactivation of INa. Values are means ± S.E.M. from three
experiments, expressed as a fraction of the maximal current Imax
from each experiment. The curve is a fit of a first-order Boltzmann equation with the following variables: V0.5=−40.4 mV; s=+8.
(E) Time to peak current/voltage relationship for activation of INa.
(F) Time constant (τ)/voltage relationship for inactivation of INa.
Values are means ± S.E.M. from three experiments. IM, membrane
[image:8.609.43.289.76.424.2]isolated and characterized using pharmacological, voltage and ion-substitution protocols. The data on the GIs presented here provide the basis for future investigations into the cellular mechanisms underlying the plasticity of this important neuronal circuit controlling escape behavior in crickets and many other arthropods.
Identification of giant interneurons in primary cell culture
Dextrans have been successfully used as in vivo dyes for specific retro- and anterograde neuronal labeling (Schmued et
al. 1990; Dale, 1991; Pfahlert and Lakes-Harlan, 1997) or for
mapping cell fate during development (e.g. Rovainen, 1991). Our results show that the GIs in the TG can be selectively labeled in vivo by conventional backfilling using the dye dextran tetramethylrhodamine. The cell bodies and the major dendrites of the GIs were easily detected in situ using an epifluorescent microscope, revealing all the major morphological features of these interneurons described previously using other methods (Mendenhall and Murphey, 1974; Jacobs and Murphey, 1987; Meusen et al. 1997). The yield of labeled GIs in culture (compared with the number of neurons labeled in situ) ranged between 5 and 25 %, which was sufficient for the type of electrophysiological recordings reported here. Since the labeled GI cell bodies were visible even when illuminated with a conventional light source in the dissecting microscope, this method may also prove valuable for visualizing living neurons for electrophysiological investigations in semi-intact preparations.
In our experiments, the Mr3000 dextrans were superior to dextrans with higher relative molecular masses and also to other tracers (Altman and Tyrer, 1980; Strausfeld et al. 1983; Kita and Armstrong, 1991; Hayashi and Levine, 1992) in terms of the shorter exposure times necessary for specific, yet complete, labeling of GI cell bodies. The dye did not seem to leak out of the stained neurons nor did it show any significant bleaching or phototoxicity during the brief exposure to ultraviolet light necessary for cell identification. The labeling was visible in GI cell bodies for several days in cell culture.
The neurons survived for up to 3 weeks under the chosen culture conditions. Even though the cells were dissociated from adult crickets, the neurons formed extensive branchings during 2 weeks in culture, permitting the differentiation of cell types (Fig. 2B,C). However, electrophysiological recordings were made exclusively from neurons cultivated for 1–2 days. Despite the fact that these neurons could not be categorized morphologically at this stage, the GIs were easy to recognize among co-cultured cells because of their fluorescent labeling. Thus, the procedure described allows recording from positively identified GIs immediately after plating. This reduces the influence of the cell culture conditions on receptor/channel expression often observed in insect neurons (Tribut et al. 1991; Kirchof and Bicker, 1992). In addition, the spherical shape of the cell bodies without large neuritic arborizations is advantageous for good voltage control in voltage-clamp experiments (see also below).
Isolation of currents in identified giant interneurons
Current-clamp recordings from dextran-tetramethyl-rhodamine-labeled GIs revealed resting potentials similar to those found in vivo (Murphey, 1973; Murphey et al. 1977; Kämper, 1984; Kohstall-Schnell and Gras, 1994; Meusen et al. 1997; Heblich and Hörner, 1998). This observation confirms that the chosen backfilling procedure did not cause obvious changes in the physiological properties of the GIs (see also below).
Spikes recorded from neurons in vivo and in vitro suggest the presence of activated currents in GIs. In voltage-clamp experiments, we have so far been able to isolate four voltage-activated components, including K+, Na+ and Ca2+ currents. The properties of these currents are in many aspects similar to those of currents found in other cell types in insect preparations [Pichon and Boistel, 1967; Thomas, 1984; Christensen et al. 1988; Nightingale and Pitman, 1989; Lapied et al. 1990; Stankiewicz et al. 1993; Grolleau and Lapied,
1994, 1995; Wicher et al. 1994; Mills and Pitman, 1997 (cockroach); Byerly and Leung, 1988; O’Dowd and Aldrich, 1988; Solc and Aldrich, 1988; Baker and Salkoff, 1990; Leung and Byerly, 1991; Saito and Wu, 1991; Hevers and Hardie, 1995 (Drosophila); Hardie and Weckström (1990) (fly); Schäfer et al. 1994 (honeybee); Laurent, 1991; Bermudez et
al. 1992; Benson, 1993 (locust); Zufall et al. 1991; Hayashi
and Levine, 1992; Mercer et al. 1996 (hawkmoth)].
K+currents
As in many other preparations, the K+current found in GIs consists of a transient and a sustained component. IAactivates and inactivates rapidly and is blocked by relatively low concentrations of 4-AP, as reported for other systems. IA is half-maximally activated at approximately −4 mV (s=−13). This is 20–60 mV more positive than described in blowfly monopolar cells (Hardie and Weckström, 1990), Drosophila photoreceptors (Hardie, 1991; Hevers and Hardie, 1995) or cockroach dorsal unpaired median (DUM) neurons (Grolleau and Lapied, 1995). This value is slightly more negative than that found in honeybee Kenyon cells (Schäfer et al. 1994). The voltage for half-maximal inactivation (−41 mV; s=+12) is very close to that described in honeybee Kenyon cells (Schäfer et
al. 1994) and is 10–60 mV more positive than that for IA in blowfly monopolar cells (Hardie and Weckström, 1990),
Drosophila photoreceptors (Hardie, 1991; Hevers and Hardie,
1995), cockroach DUM neurons (Grolleau and Lapied, 1995) or in many cultured Drosophila central nervous system (CNS) neurons (Solc and Aldrich, 1988; Saito and Wu, 1991).
In all GIs, we found both, IAand IK(V); however, their ratio showed considerable variation. K+currents play an important role in shaping the spike form and in determining the excitability of neurons (see Hille, 1992). It has been shown that the properties of neurons are largely determined by the types of ion channel and the rate of channel expression for the different channel types (see, for example, Baro et al. 1997). It will be interesting in the future to determine, using in vivo voltage-clamp recordings from identified GIs, whether the different ratios of K+currents observed in cultured GIs can be attributed to distinct GI types, possibly reflecting their specific physiological properties and functions.
Na+currents
Our recordings from the cell bodies of cultured GIs show large Na+spikes, suggesting the presence of Na+channels on the soma or close to the recording site. This is in contrast to in
vivo recordings from the GI cell bodies in intact ganglia, which
reveal low-amplitude action potentials indicating passive spike propagation from the site of spike initiation remote from the cell body (Murphey, 1973; Murphey et al. 1977; Kohstall-Schnell and Gras, 1994; Meusen et al. 1997; Heblich and Hörner, 1998). However, transient Na+currents recorded from cell bodies of cultured insect neurons have been described in a number of different insect species [Byerly and Leung, 1988; O’Dowd and Aldrich, 1988; Saito and Wu, 1991 (Drosophila); Schäfer et al. 1994 (honeybee); Hayashi and Levine, 1992; Mercer et al. 1996 (hawkmoth)]. This suggests that cultured insect neurons often express Na+ channels on the soma or in newly generated processes close to it. Another factor that may have induced the changes in the electrophysiological properties in cultured GIs could be the complete loss of synaptic input. Murphey and Levine (1980) showed that deafferentation of cricket GIs in vivo causes changes in their response characteristics.
Despite the observation that the neurons investigated did not have large processes, INa often appeared abruptly during a gradual increase in the voltage steps, indicating imperfect control of space voltage. This observation suggests that at least some of the Na+ channels are not located on the soma membrane but instead on newly formed processes. Although these very fine processes could not be discerned in labeled GI somata in the epifluorescence microscope because of high-intensity ultraviolet-light- induced fluorescence, they were detectable using phase contrast optics at high magnification. The spikes observed in GIs in vitro are therefore probably due to a novel expression of Na+channels, supporting the argument presented above.
The transient Na+ current of the GIs activates at voltages above −35 to −30 mV and has its maximum at approximately −10 mV. This is similar to transient Na+currents observed in other insect neurons [Byerly and Leung, 1988; O’Dowd and Aldrich, 1988; Saito and Wu, 1991 (Drosophila); Schäfer et
al. 1994 (honeybee); Hayashi and Levine, 1992; Mercer et al.
1996 (hawkmoth); Tribut et al. 1991 (cockroach)].
The voltage for half-maximal inactivation (−40 mV; s=+8)
is 13 mV more positive than the value described in honeybee Kenyon cells (Schäfer et al. 1994). While recording the transient Na+ current, we usually observed a persistent TTX-sensitive component. Persistent Na+ currents have also been described in other insect neurons [Saito and Wu, 1991 (Drosophila); Schäfer et al. 1994 (honeybee)]. However, further experiments are necessary to confirm that the persistent current observed in the GIs is indeed due to a Na+current.
Ca2+currents
ICa in the GIs activates rapidly and is followed by a slow inactivation. ICaactivates at voltages above −40 to −30 mV and has its maximum at −10 mV. This is similar to Ca2+ currents described in other insect neurons [Byerly and Leung, 1988; Saito and Wu, 1991 (Drosophila); Schäfer et al. 1994 (honeybee); Hayashi and Levine, 1992 (hawkmoth); Mills and Pitman, 1997 (cockroach)]. Recordings from different GIs reveal variability in the inactivation kinetics. The reason for this must be determined in future experiments. Substituting Ca2+ with Ba2+ increased the maximum amplitude of the current, indicating that these ion channels are more permeable to Ba2+than to Ca2+, as has also been described for many other neuron types (see Hille, 1992). Since a Ba2+-induced increase in conductance often led to loss of voltage control, we did not study the Ba2+currents in greater detail. For the same reason, we did not attempt to compare inactivation kinetics between Ca2+and Ba2+currents in this study.
In most experiments, ICashowed a considerable ‘rundown’ over the recording time. It has been reported in some cell types that the rundown is slower when Ca2+is replaced with Ba2+, indicating a Ca2+-dependent inactivation or regulation of I
Ca (e.g. Schäfer et al. 1994). In our experiments, the observed ‘rundown’ appeared to be accelerated with increasingly positive voltage pulses. The Ca2+ influx, however, did not increase further, but started to decrease at membrane potentials more positive than approximately −10 mV owing to the equilibrium potential of Ca2+. This observation suggests that at least part of the observed ‘rundown’ was voltage-dependent. Further electrophysiological studies are necessary to compare the pharmacological profile of the Ca2+channels present in GIs with those described in other insects (Mills and Pitman, 1997).
Concluding remarks
During this study, we have gathered evidence for the existence of several other currents not described in detail here. For example, hyperpolarization during the current-clamp recordings revealed a characteristic ‘sag’ trajectory, often in conjunction with post-inhibitory rebound, suggesting the presence of a hyperpolarization-activated slow inward current in GIs. Such currents have been found in many cell types that have post-inhibitory rebound properties and show bistability of the membrane potential (see Hartline and Graubard, 1992).
the presence of Ca2+- and Na+-sensitive K+ currents. Ca2+ -dependent [Schäfer et al. 1994 (honeybee); Thomas, 1984; (cockroach); Wegener et al. 1992 (locust)] and Na+-dependent K+ currents have also been found in vertebrates and invertebrates (Bader et al. 1985; Hartung, 1985; Dale, 1993; Grolleau and Lapied, 1994). Future studies will be necessary to investigate these currents in detail.
In conclusion, the approach described here permits the investigation of individually identified GIs from the TG of adult crickets in primary cell culture. The intrinsic properties of these interneurons isolated from their synaptic inputs can be studied selectively. In conjunction with the in vitro experiments described here, we are currently studying the effects of biogenic amines on the cholinergic sensory-to-giant pathway in intact preparations using in vivo voltage-clamp techniques. Our long-term goal is to investigate, using a parallel in vitro and in vivo approach, the cellular mechanisms underlying the aminergic modulation observed in the giant fiber pathway.
We thank John Hildebrand for his generous support at an early stage of this study. We also thank Ed Kravitz for his hospitality during the writing of this manuscript at the Marine Biological Laboratory, Woods Hole, and for his very helpful comments on an earlier draft. Thanks are also due to Rolf Heblich for providing whole-mount preparations of Lucifer-Yellow-filled GIs. We are grateful to Marion Knierim-Grenzebach for her skillful and patient help with the figures. This paper is dedicated to ‘crickets in space’ onboard the Neurolab Mission of the NASA space shuttle flight STS-90 (STS-90). The present work has been supported by the DFG (SFB 406, C5), the Alexander von Humboldt Foundation (stipend to M.H.) and the Grass Foundation (Grass Fellowship to P.K.).
References
ALTMAN, J. S. ANDTYRER, N. M. (1980). Filling selected neurons with
cobalt through cut axons. In Neuroanatomical Techniques (ed. N. J. Strausfeld and T. A. Miller), pp. 373–402. New York, Heidelberg: Springer.
ARMSTRONG, C. M. AND BEZANILLA, F. (1974). Charge movement
associated with the opening and closing of the activation gates of the Na channels. J. gen. Physiol. 63, 533–552.
BADER, C. M., BERNHEIM, L. AND BERTRAND, D. (1985).
Sodium-activated potassium current in cultured avian neurones. Nature 317, 540–542.
BAKER, K. AND SALKOFF, L. (1990). The Drosophila shaker gene codes for a distinctive potassium current in a subset of neurons.
Neuron 2, 129–140.
BARO, D. J., LEVINI, R. M., KIM, M. T., WILLMS, A. R., LANNING, C.
C., RODRIGUEZ, H. E. AND HARRIS-WARRICK, R. M. (1997). Quantitative single-cell-reverse transcription-PCR demonstrates that A-current magnitude varies as a linear function of shal gene expression in identified stomatogastric neurons. J. Neurosci. 17, 6597–6610.
BENSON, J. A. (1993). The electrophysiological pharmacology of
neurotransmitter receptors on locust neuronal somata. In
Comparative Molecular Neurobiology (ed. Y. Pichon), pp.
390–413. Basel: Birkhäuser Verlag.
BERMUDEZ, I., BEADLE, D. J. AND BENSON, J. A. (1992). Multiple
serotonin activated currents in isolated, neuronal somata from locust thoracic ganglia. J. exp. Biol. 165, 43–60.
BYERLY, L. ANDLEUNG, H.-T. (1988). Ionic currents of Drosophila
neurons in embryonic cultures. J. Neurosci. 8, 4379–4393. CAMHI, J. M. (1988). Escape behavior in the cockroach: distributed
neural processing. Experientia 44, 401–408.
CASAGRAND, J. L. AND RITZMANN, R. E. (1992). Biogenic amines
modulate synaptic transmission between identified giant interneurons and thoracic interneurons in the escape system of the cockroach. J. Neurobiol. 23, 644–655.
CHRISTENSEN, B. N., LARMET, Y., SHIMAHARA, T., BEADLE, D. AND
PICHON, Y. (1988). Ionic currents in neurones cultured from
embryonic cockroach (Periplaneta americana) brains. J. exp. Biol.
135, 193–214.
CONNOR, J. A. ANDSTEVENS, C. F. (1971). Voltage-clamp studies of
a transient outward membrane current in gastropod neural somata.
J. Physiol., Lond. 213, 21–30.
DALE, N. (1991). The isolation and identification of spinal neurons that control movement in the Xenopus embryo. Eur. J. Neurosci. 3, 1025–1035.
DALE, N. (1993). A large, sustained Na+- and voltage-dependent K+
current in spinal neurons of the frog embryo. J. Physiol., Lond. 462, 349–372.
EATON, R. C. (1984). (ed.) Neural Mechanisms of Startle Behavior. New York, London: Plenum Press.
EDWARDS, J. S. ANDPALKA, J. (1974). The cerci and abdominal giant
fibres of the house cricket, Acheta domesticus. I. Anatomy and physiology of normal adults. Proc. R. Soc. Lond. B 185, 83–103.
GLANZMAN, D. L. AND KRASNE, F. B. (1983). Serotonin and
octopamine have opposite modulatory effects on the crayfish’s lateral giant escape reaction. J. Neurosci. 3, 2263–2269.
GOLDSTEIN, R. S. AND CAMHI, J. M. (1991). Different effects of
biogenic amines dopamine, serotonin and octopamine on the thoracic and abdominal portions of the escape circuit in the cockroach. J. comp. Physiol. A 168, 103–112.
GRAS, H. ANDHÖRNER, M. (1992). Wind-evoked escape running of
the cricket, Gryllus bimaculatus. I. Behavioural analysis. J. exp.
Biol. 171, 189–214.
GROLLEAU, F. AND LAPIED, B. (1994). Transient Na+-activated K+
current in beating pacemaker isolated adult insect neurosecretory cells (DUM neurones). Neurosci. Lett. 167, 46–50.
GROLLEAU, F. ANDLAPIED, B. (1995). Separation and identification of
multiple potassium currents regulating the pacemaker activity of insect neurosecretory cells (DUM neurons). J. Neurophysiol. 73, 160–171.
HAMILL, O. P., MARTY, A., NEHER, E., SAKMANN, B. ANDSIGWORTH,
R. F. (1981). Improved patch-clamp techniques for high resolution current recording from cell-free membrane patches. Pflügers Arch.
391, 85–100.
HARDIE, R. C. (1991). Voltage-sensitive potassium channels in
Drosophila photoreceptors. J. Neurosci. 11, 3079–3095.
HARDIE, R. C. AND WECKSTRÖM, M. (1990). Three classes of
potassium channels in large monopolar cells of the blowfly
Calliphora vicina. J. comp. Physiol. A 167, 723–736.
HARTLINE, D. K. ANDGRAUBARD, K. (1992). Cellular and synaptic
properties in the crustacean stomatogastric nervous system. In
(ed. R. M. Harris-Warrick, E. Marder, A. I. Selverston and M. Moulins), pp. 31–85. Cambridge, MA: MIT Press.
HARTUNG, K. (1985). Potentiation of a transient outward current by
Na+influx in crayfish neurones. Pflügers Arch. 404, 41–44.
HAYASHI, J. H. ANDHILDEBRAND, J. G. (1990). Insect central olfactory
neurons in primary culture. J. Neurosci. 10, 848–859.
HAYASHI, J. H. AND LEVINE, R. B. (1992). Calcium and potassium
currents in leg motoneurons during postembryonic development in the hawkmoth Manduca sexta. J. exp. Biol. 171, 15–42.
HEBLICH, R. ANDHÖRNER, M. (1988) Amine-induced modulations of
the giant fibre pathway in the cricket terminal ganglion. In
Göttingen Neurobiology Report 1998, Proceedings of the 26th Göttingen Neurobiology Conference, vol. 2 (ed. N. Elsner and R.
Wehner), p. 602. Stuttgart, New York: Thieme.
HEVERS, W. AND HARDIE, R. C. (1995). Serotonin modulates the
voltage dependence of delayed rectifier and shaker potassium channels in Drosophila photoreceptors. Neuron 14, 845–856. HILLE, B. (1992). (ed.) Ionic Channels of Excitable Membranes.
Sunderland, MA: Sinauer Assoc. Inc.
HODGKIN, A. L. ANDHUXLEY, A. F. (1952). A quantitative description
of membrane current and its application to conduction and excitation in nerve. J. Physiol., Lond. 117, 500–544.
HÖRNER, M. (1992). Wind-evoked escape running of the cricket
Gryllus bimaculatus. II. Neurophysiological analysis. J. exp. Biol. 171, 215–245.
HÖRNER, M., HELLE, J. AND SCHÜRMANN, F. W. (1996). The
distribution of histamine-immunoreactive neurones in the ventral nerve cord of the cricket, Gryllus bimaculatus. Cell Tissue Res.
286, 393–405.
HÖRNER, M., KLOPPENBURG, P. AND HEBLICH, R. (1997a).
Electrophysiology of identified cultured giant interneurons from adult crickets. Verh. dt. zool. Ges. 90, 10.
HÖRNER, M., KLOPPENBURG, P. AND HEBLICH, R. (1997b).
Characterization of ionic currents from identified cricket giant interneurons in primary cell culture. In Göttingen Neurobiology
Report 1997, Proceedings of the 25th Göttingen Neurobiology Conference, vol. 2 (ed. N. Elsner and H. Wässle), p. 780. Stuttgart,
New York: Thieme.
HÖRNER, M., SPÖRHASE-EICHMANN, U., HELLE, J., VENUS, B. AND
SCHÜRMANN, F. W. (1995). The distribution of β-tyrosine
hydroxylase-, dopamine- and serotonin-immunoreactive neurones in the ventral nerve cord of the cricket, Gryllus bimaculatus de Geer. Cell Tissue Res. 280, 583–604.
HÖRNER, M., WEIGER, W. A., EDWARDS, D. H. ANDKRAVITZ, E. A.
(1997c). Excitation of identified serotonergic neurons by escape command neurons in lobsters. J. exp. Biol. 200, 2017–2033.
JACOBS, G. A. ANDMURPHEY, R. K. (1987). Segmental origins of the
cricket giant interneuron system. J. comp. Neurol. 265, 145–157.
KÄMPER, G. (1981). Untersuchungen zur Erzeugung, Rezeption und
Verarbeitung von niederfrequentem Schall bei Grillen. Dissertational thesis, University of Köln, Germany.
KÄMPER, G. (1984). Abdominal ascending interneurons in crickets:
responses to sound at the 30-Hz calling-song frequency. J. comp.
Physiol. A 155, 507–520.
KANOU, M. AND SHIMOZAWA, T. (1984). A threshold analysis of cricket cercal interneurons by an alternating air-current stimulus. J.
comp. Physiol. A 154, 357–365.
KIRCHOF, B. ANDBICKER, G. (1992). Growth properties of larval and
adult locust neurons in primary cell culture. J. comp. Neurol. 323, 411–422.
KITA, H. ANDARMSTRONG, W. (1991). A biotin-containing compound
N-(2-aminoethyl)biotinamide for intracellular labeling and
neuronal tracing studies: comparison with biocytin. J. Neurosci.
Meth. 37, 141–150.
KOHSTALL-SCHNELL, D. AND GRAS, H. (1994). Activity of giant
interneurones and other wind-sensitive elements of the terminal ganglion of the walking cricket. J. exp. Biol. 193, 157–181.
LAPIED, B., MALECOT, C. O. ANDPELHATE, M. (1990). Patch-clamp
study of the properties of the sodium current in single isolated adult aminergic neurons. J. exp. Biol. 151, 387–403.
LAURENT, G. (1991). Evidence for voltage-activated outward currents
in the neuropilar membrane of locust non-spiking local interneurons. J. Neurosci. 11, 1713–1726.
LEUNG, H. T. AND BYERLY, L. (1991). Characterization of single calcium channels in Drosophila embryonic nerve and muscle cells.
J. Neurosci. 11, 3047–3059.
MENDENHALL, B. ANDMURPHEY, R. K. (1974). The morphology of
cricket giant interneurons. J. Neurobiol. 5, 565–580.
MERCER, A. R., KLOPPENBURG, P. AND HILDEBRAND, J. G. (1996).
Serotonin-induced changes in the excitability of cultured antennal-lobe neurons of the sphinx moth Manduca sexta. J. comp. Physiol. A 178, 21–31.
MEUSEN, H. C., HEBLICH, R., HÖRNER, M. AND SCHÜRMANN, F. W.
(1997). Aminergic modulation of wind-sensitive giant-interneurons in the cricket terminal ganglion. Verh. dt. zool. Ges. 90, 12. MILLS, J. D. AND PITMAN, R. M. (1997). Electrical properties of a
cockroach motor neuron soma depend on different characteristics of individual Ca components. J. Neurophysiol. 78, 2455–2466.
MURPHEY, R. K. (1973). Characterization of an insect neuron which
cannot be visualized in situ. In Intracellular Staining Techniques (ed. S. B. Kater and C. Nicholson), pp. 135–150. Berlin, Heidelberg, New York: Springer.
MURPHEY, R. K. ANDLEVINE, R. B. (1980). Mechanisms responsible
for changes observed in response properties of partially deafferented insect interneurons. J. Neurophysiol. 43, 367–382.
MURPHEY, R. K., PALKA, J. ANDHUSTERT, R. (1977). The
cercus-to-giant interneuron system of crickets. II. Response characteristics of two giant interneurons. J. comp. Physiol. A 119, 285–300.
NIGHTINGALE, W. D. ANDPITMAN, R. M. (1989). Ionic currents in the
soma of an identified cockroach motoneurone recorded under voltage clamp. Comp. Biochem. Physiol. 93A, 85–93.
O’DOWD, D. K. ANDALDRICH, R. W. (1988). Voltage clamp analysis of sodium channels in wild-type and mutant Drosophila neurons.
J. Neurosci. 8, 3633–3643.
PALKA, J. ANDOLBERG, R. (1977). The cercus-to-giant interneuron
system of crickets. III. Receptive field organization. J. comp.
Physiol. A 119, 301–317.
PARNAS, I. ANDDAGAN, D. (1971). Functional organization of giant
axons in the central nervous system of insects: new aspects. Adv.
Insect Physiol. 8, 95–144.
PFAHLERT, C. ANDLAKES-HARLAN, R. (1997). Responses of insect
neurones to neurotrophic factors in vitro. Naturwissenschaften 84, 163–165.
PICHON, Y. ANDBOISTEL, J. (1967). Current–voltage relations in the
isolated giant axon of the cockroach under voltage-clamp conditions. J. exp. Biol. 47, 343–355.
PUSCH, M. AND NEHER, E. (1988). Rates of diffusional exchange
between small cells and a measuring pipette. Pflügers Arch. 411, 204–211.
RITZMANN, R. E. ANDPOLLACK, A. J. (1986). Identification of thoracic
ROEDER, K. (1948). Organization of the ascending giant fibre system in the cockroach (Periplaneta americana). J. exp. Zool. 108, 243–261.
ROVAINEN, C. M. (1991). Labeling of developing vascular
endothelium after injection of rhodamine-dextran into blastomeres of Xenopus laevis. J. exp. Zool. 259, 209–221.
SAITO, M. AND WU, C.-F. (1991). Expression of ion channels and mutational effects in giant Drosophila neurons differentiated from cell division-arrested embryonic neuroblasts. J. Neurosci. 11, 2135–2150.
SATTELLE, D. B. (1985). Acetylcholine receptors. In Comprehensive
Insect Physiology, Biochemistry and Pharmacology, vol. 11 (ed. G.
A. Kerkut and L. I. Gilbert), pp. 395–434. Oxford: Plenum Press.
SCHÄFER, S., ROSENBOOM, H. ANDMENZEL, R. (1994). Ionic currents
of Kenyon cells from the mushroom body of the honeybee. J.
Neurosci. 14, 4600–4612.
SCHMUED, K., KYRIAKIDIS, L. AND HEIMER, L. (1990). In vivo
anterograde and retrograde axonal transport of the fluorescent rhodamine-dextran-amine, Fluoro-Ruby, within the CNS. Brain
Res. 526, 127–134.
SOLC, C. K. ANDALDRICH, R. W. (1988). Voltage-gated potassium channels in larval CNS neurons of Drosophila. J. Neurosci. 8, 2556–2570.
SPÖRHASE-EICHMANN, U., VULLINGS, H. G. B., BUIJS, R. M., HÖRNER,
M. ANDSCHÜRMANN, F. W. (1992). Octopamine-immunoreactive
neurons in the central nervous system of the cricket, Gryllus
bimaculatus. Cell Tissue Res. 268, 287–304.
STANKIEWICZ, M., PELHATE, M., MALECOT, C. O. AND DUVAL, A.
(1993). Transient K+ current and periaxonal potassium
accumulation in the giant axon of the cockroach Periplaneta
americana. J. Insect Physiol. 39, 1075–1082.
STRAUSFELD, N. J., SINGHSEYAN, H., WOHLERS, D. ANDBACON, J. P.
(1983). Lucifer Yellow histology. In Functional Neuroanatomy (ed. N. J. Strausfeld), pp. 132–155. New York, Heidelberg: Springer.
THOMAS, M. V. (1984). Voltage-clamp analysis of a calcium-mediated
potassium conductance in cockroach (Periplaneta americana) central neurones. J. Physiol., Lond. 350, 159–178.
TOBIAS, M. AND MURPHEY, R. K. (1979). The response of cercal
receptors and identified interneurones in the cricket (Acheta
domesticus) to airstreams. J. comp. Physiol. 129, 51–59.
TRIBUT, F., LAPIED, B., DUVAL, A. AND PELHATE, M. (1991). A
neosynthesis of sodium channels is involved in the evolution of the sodium current in isolated adult DUM neurons. Pflügers Arch. 419, 665–667.
WEGENER, J. W., TARELIUS, E. AND BREER, H. (1992).
Characterization of calcium-dependent potassium channels in antennal receptor neurones of Locusta migratoria. J. Insect Physiol.
38, 237–248.
WEISEL-EICHLER, A. ANDLIBERSAT, F. (1996). Neuromodulation of
flight initiation by octopamine in the cockroach. J. comp. Physiol. A 179, 103–112.
WICHER, D., WALTHER, C. ANDPENZLIN, H. (1994). Neurohormone D
induces current changes in cockroach central neurons. J. comp.
Physiol. A 174, 507–515.
WINE, J. J. ANDKRASNE, F. B. (1982). The cellular organization of crayfish escape behavior. In The Biology of Crustacea, vol. 4 (ed. D. C. Sandemann and H. L. Atwood), pp. 241–292. London, New York, San Francisco: Academic Press.
YEH, S.-R., MUSOLF, B. E. ANDEDWARDS, D. H. (1997). Neuronal adaptations to changes in the social dominance status of the crayfish. J. Neurosci. 17, 697–708.
ZUFALL, F., STENGL, M., FRANKE, C., HILDEBRAND, J. G. ANDHATT,