It was only in the early 1950s that Hans Lissmann from the University of Cambridge demonstrated that certain African fish produce weak electric signals in the water using their electric organ (Lissmann, 1951). Lissmann and Machin (1958) later employed a conditioned training procedure to show that these weakly electric fish use their electric organ discharges (EODs) for detecting objects with electrical properties different from those of the surrounding water. Such objects cause distortions in the three-dimensional electric field generated around the fish by each EOD. As a result, the current flowing through epidermal electroreceptor organs is altered compared with the current flowing in the absence of an object. Each object projects a kind of ‘electric image’ onto the skin surface, which consists of an area where the EOD-evoked current density has changed (Caputi et al., 1998; Rasnow, 1996). The image depends on the object’s electrical properties, size, shape and distance. The electroreceptor cells in each electroreceptor organ respond to the voltage drop across the skin and thus report the local current flowing to the brain via afferent fibres (Zakon, 1987). This process in which the fish detects objects by the distortions that they cause in its own EODs is called
active electrolocation (Bastian, 1986; Lissmann and Machin, 1958; von der Emde, 1998b). The term is contrasted with passive electrolocation, which consists of passively detecting electric fields emitted by other sources (Kalmijn, 1987).
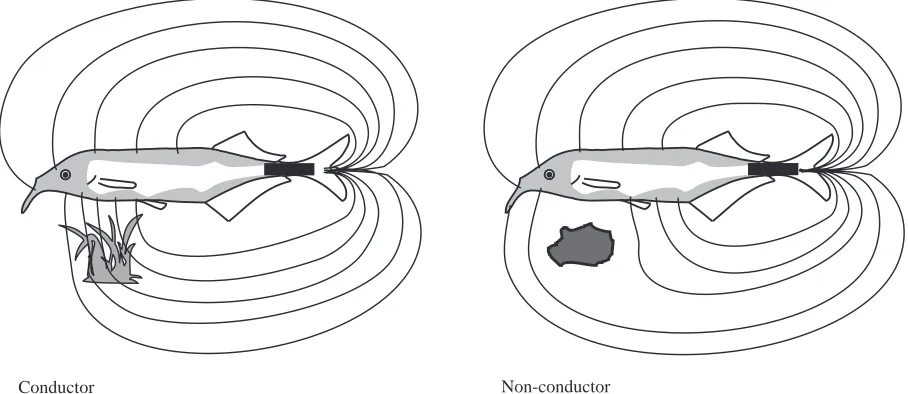
The electric image is defined as the change in the spatial pattern of electric current flow evoked by an object compared with the situation without an object present. Two different types of electric images are projected onto the fish’s skin depending on the electrical impedance of the object under investigation. Conductors with impedance values lower than that of the surrounding water ‘attract’ electrical current lines because more current flows through the low-impedance object compared with the water it replaces. This leads to a higher density of current entering the skin of the fish opposite the object and thus to a larger voltage drop at those electroreceptors closest to the object (Fig. 1). Surrounding the edge of the electric image, there usually exists a small zone that experiences the opposite, i.e. a reduction in perceived EOD amplitude (Figs 2, 3), giving the electric image a ‘Mexican hat’ profile (Caputi et al., 1998). A non-conductor or an object with a higher impedance than that of the water causes JEB2081
Weakly electric fish produce electric signals (electric organ discharges, EODs) with a specialised electric organ creating an electric field around their body. Objects within this field alter the EOD-induced current at epidermal electroreceptor organs, which are distributed over almost the entire body surface. The detection, localisation and analysis of objects performed by monitoring self-produced electric signals is called active electrolocation.
Electric fish employ active electrolocation to detect objects that are less than 12 cm away and have electric properties that are different from those of the surrounding water. Within this range, the mormyrid Gnathonemus petersii can also perceive the distance of objects. Depth perception is independent of object parameters such as size, shape and material. The mechanism for distance determination through electrolocation involves calculating the ratio between two parameters of the electric image that the object projects onto the fish’s skin.
Electric fish can not only locate objects but can also
analyse their electrical properties. Fish are informed about object impedance by measuring local amplitude changes at their receptor organs evoked by an object. In addition, all electric fish studied so far can independently determine the capacitative and resistive components of objects that possess complex impedances. This ability allows the fish to discriminate between living and non-living matter, because capacitance is a property of living organisms. African mormyrids and South American gymnotiforms use different mechanisms for capacitance detection. Mormyrids detect capacitance-evoked EOD waveform distortions, whereas gymnotiforms perform time measurements. Gymnotiforms measure the temporal phase shift of their EODs induced at body parts close to the object relative to unaffected body parts further away.
Key words: object detection, electric image, localisation, depth perception, capacitance detection, Gnathonemus petersii, Eigenmannia.
Summary
Introduction
ACTIVE ELECTROLOCATION OF OBJECTS IN WEAKLY ELECTRIC FISH
GERHARD VON DER EMDE*
Institut für Zoologie, Universität Bonn, Poppelsdorfer Schloss, 53115 Bonn, Germany
*e-mail: [email protected]
opposite effects compared with a conductor. Electrical current cannot flow, or flows less, through such objects, causing a thinning of current lines at skin areas neighbouring such objects (Fig. 1). This in turn leads to a lower amplitude perceived by the electroreceptors in the centre of the electric image. Again, there is a small area surrounding the centre zone where current is increased (Fig. 3).
In addition to the sign of the electrical impedance of an object, the electric image informs the fish about another object property. All electric fish tested so far can determine whether a natural object has capacitative electrical properties, i.e. whether the impedance of the object is complex. This is achieved by monitoring a change in local EOD waveform, which is only caused by complex impedances or by detecting temporal shifts of the electrical signal (von der Emde, 1998a). This topic is dealt with in detail later in this article.
Detection and localisation of objects
Lissmann and Machin (1958) showed that weakly electric fish can detect an object by active electrolocation alone. They used various types of plastic or metal rods, which were hidden inside an electrically transparent porous cylinder, and trained the fish to approach or avoid the rods. Thus, they were able to measure detection thresholds by varying the diameter of the rod. Other methods for studying active electrolocation involve natural behaviours of the fish, such as the so-called ‘novelty response’, a transient change in the emission frequency of EODs caused by the sudden appearance and detection of a novel object. Using this novelty response, mormyrid fish were shown to be able to detect plastic or aluminium objects up to a distance of 2–8 cm, the exact distance depending on object size (Heiligenberg, 1976; Push and Moller, 1979). Fish also respond to complex impedances of objects depending on the
capacitative component of the impedance and on the frequency content of the fish’s EODs (Meyer, 1982; von der Emde and Zelick, 1995). Several fish species tend to hover near stationary or slowly moving objects and maintain a constant distance to them. Since they fail to follow and often even collide with electrically transparent objects, they must use active electrolocation for this ‘electromotor response’. This behaviour was used to study active electrolocation quantitatively, demonstrating the dependence of electrolocation performance on object size, distance and impedance in different fish species (Bastian, 1989; Heiligenberg, 1976, 1977).
Electric fish orient in complete darkness by analysing the electric image that objects project onto their skin surface (Fig. 2). Different parameters of the image can provide different types of information about an object. The location of the image on the skin tells the fish where the object is located, relative to its own body coordinates. For example, when only receptors at the fish’s head are influenced by an object, the fish knows that the object must be located close to its head. The sign of the amplitude change reported by the electroreceptors to the fish’s brain informs the animal about the general nature of the object’s impedance, i.e. whether the impedance of the object is lower or higher than that of the water. The phase-shift and/or the EOD waveform distortions convey information about the capacitative properties of the object. Other aspects such as object size or shape, the exact value of its impedance and the object distance must be computed through a process of calculations involving several image parameters. It is not clear how many, if any, of the latter object properties a fish can unequivocally determine, because of possible ambiguities in many image parameters. For example, the size of the voltage change caused by an object depends on the size, impedance and distance of an object in an interdependent manner. Other
[image:2.609.77.531.506.703.2]Conductor Non-conductor
senses, such as the mechanosensory lateral line system, can sometimes solve some ambiguities (von der Emde and Bleckmann, 1998). Fish often engage in so-called ‘probing motor acts’, a series of motor behaviours performed close to an object under investigation (Toerring and Belbenoit, 1979; Toerring and Moller, 1984). These behaviours might inform the animal about object features such as shape or size and thereby support active electrolocation.
Depth perception during active electrolocation
As a rule of thumb, the range of active electrolocation is limited to approximately one body length of an electric fish. The range depends not only on the size of the fish, and thus on the relative amplitude of the emitted EODs, but also on object size and object impedance. The effect of an object in modulating the transepidermal voltage decays rapidly with object distance (to the power −1.7 of the object’s distance;
Bastian, 1986). Large objects and objects of extreme impedance (either very low impedance, such as that of metal objects, or very high impedance, such as that of plastic objects) impose the largest change in transepidermal voltage and thus can be detected even further away. For example, a metal or plastic cube with a side length of 3 cm is detected up to a distance of approximately 12 cm by a 12 cm long Gnathonemus petersii (S. Schwarz and G. von der Emde, unpublished results). Very small objects and objects with impedances similar to that of water are only detected when they are close to the fish. A 12 cm long G. petersii, for instance,
detects small insect larvae (chironomids) during its search for food only up to a distance of approximately 2 cm (von der Emde and Bleckmann, 1998).
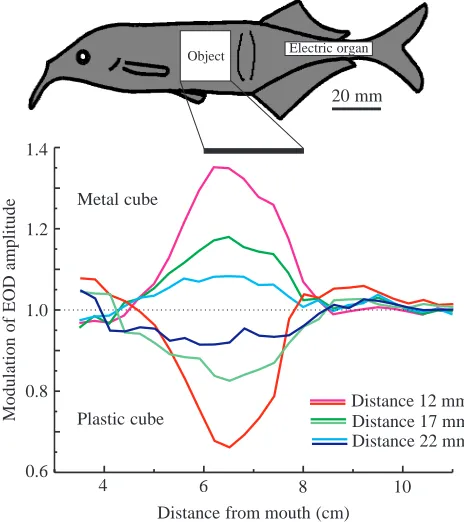
Are weakly electric fish able to determine the distance to an object they have electrolocated? Distance measurement to novel objects was thought to be hardly possible, because several parameters of the electric image change simultaneously when an object moves away from an electrolocating fish. Even worse, all these parameters depend on other object features such as size and impedance. In general, it can be said that an object at a close distance has a strong effect on the pattern of electrical current through the electroreceptors. Fig. 2 shows that the electric image of a spherical metal object consists of a centre zone with an increased amplitude and a smaller rim zone with a decreased amplitude. If the same object is placed at a greater distance from the fish, the diameter of the electric image widens (Figs 2, 3). This is in contrast to visual images on the retina, where an object at a large distance produces a smaller image compared with one located close by. An increase in object distance not only causes an increase in electric image size but also reduces the maximum amplitude in both the centre and rim zones. Thus, the overall image amplitude decreases, reducing the overall contrast of images of far-away objects.
A hypothesis on how electric fish might determine the
Electric organ
[image:3.609.51.297.71.267.2]Electric organ
Fig. 2. Principle of electric image generation by a spherical metal object at two different distances from the fish. Electric image size and amplitude change with object distance. Electric images have a ‘Mexican hat ‘ profile (Caputi et al., 1998). An object far from the fish’s skin (top) produces a large electric image with a relatively small amplitude differences between the central and outer image areas (indicated by shading). When the same object comes closer (bottom), the size of the image decreases and the maximum amplitude and edge contrast increase.
Object
20 mm
Metal cube
Plastic cube
Modulation
of
EOD
amplitude
Distance from mouth (cm) 1.4
0.6 1.2
1.0
0.8
4
Distance 12 mm Distance 17 mm Distance 22 mm
6 8 10
Electric organ
[image:3.609.323.555.375.636.2]distance of a small isolated object during active electrolocation was formulated by Rasnow (1996) and Rasnow and Bower (1997). According to this hypothesis, it is sufficient for the fish to measure the relative width of the electric image for unambiguous distance information. However, the animal’s use of image width or image amplitude for depth perception must confront the problem that both these parameters are also affected by object size and impedance. For example, if a larger sphere with an impedance somewhat higher than that of metal is placed as close to the fish as in the lower diagram of Fig. 2, it could produce an almost identical image to that shown in the upper diagram in Fig. 2. Thus, distance determination faces severe problems if the fish does not know the object whose distance it wants to determine.
To test whether distance determination of unknown objects is indeed possible, we performed behavioural discrimination experiments with individuals of the African pulse-type electric fish G. petersii (Schwarz, 1997; von der Emde et al., 1998). Animals were trained in a food-rewarded two-alternative forced-choice task to discriminate between two objects placed at different distances behind two gates in a mesh wall. Fish had to investigate each object without passing through the gate, determine its distance, and then choose the object closest to its gate by swimming through the corresponding opening.
All trained fish learned to discriminate between two such objects based only on their distances within 3–5 weeks. Controls showed that the fish employed only active electrolocation (Schwarz, 1997; von der Emde et al., 1998). We first offered the fish two identical objects of different size, such as two metal cubes, two plastic cubes, two metal spheres, two metal plates or two metal pyramids. To measure distance discrimination thresholds, the distance of one object was held constant, while the second object was moved in steps from greater distances towards the distance of the reference object until the fish could no longer discriminate between the two objects. A rate of successful discrimination of 70 % was defined as the discrimination threshold.
In all cases, fish discriminated the distance of two identical objects without any problem. Threshold values for successful distance discrimination depended on object size and on the distance from the gate of the closer object. Large objects and objects placed closer to the gate (smaller gate distance) yielded smaller thresholds. For example, when two 125 cm3 metal
cubes were used as test objects, the distance discrimination threshold was approximately 0.4 cm when the closest object was 2 cm behind the observation gate. When the gate distance increased to 6 cm, the distance discrimination threshold increased to 3 cm. When gate distances were held constant at 2 cm, but smaller (27 cm3) cubes were used, the threshold value
increased to 0.8 cm (Schwarz, 1997).
The results obtained with two identical objects could theoretically be based on measurements of the electric image amplitude or size rather than on object distance (see above). Therefore, in subsequent experiments, we offered the fish two different objects. When we offered the fish two objects of different size, they could still easily discriminate the distances
of the two objects. Moreover, fish never made any systematic errors, for example judging the larger object to be closer because of the larger amplitude it produced at the receptors (Figs 2, 3). Similar results were obtained when we offered the fish two objects of different shape, e.g. a metal pyramid versus a metal cube, or two objects made from different material, e.g. a metal cube and a plastic cube. Again, fish could always determine object distance, irrespective of the size, shape or material of the object (Schwarz, 1997; von der Emde et al., 1998).
In summary, our behavioural results clearly demonstrate that
G. petersii can measure object distances as such during active
electrolocation. In our experiments, the fish were not relying on other cues besides distance cues, because in that case they should have made mistakes when they had to compare the distance of unknown objects differing in parameters such as object size, shape or material (impedance). We therefore conclude that our fish were able to solve the ambiguity problems described above that might arise when unknown objects are electrolocated. Hence, the fish have real three-dimensional depth perception, an ability that had not been demonstrated before in the electrosensory world.
How do weakly electric fish measure the distance to an object? A first clue to this question arose when we looked at the electric images that objects project onto the skin surface of an electrolocating G. petersii. We measured these images two-dimensionally, i.e. we placed an object at a certain distance from a discharging, but sedated, fish and measured local EODs close (approximately 1 mm) to its body along the lateral electroreceptive surface (Fig. 3). Using this method, we obtained rostro-caudal sections of the electric images of the objects used in the behavioural experiments. We compared the images of each object placed at up to seven different distances from the fish, looking for image parameters that depended only on object distance but not on other object features such as size, shape or impedance.
object distance, irrespective of size, shape or material for most objects.
A comparison with visual cues might make the proposed parameter combination a little more comprehensible (Metzner, 1998). Each object casts an image like an ‘electrical shadow’ on the body surface of the fish, which becomes larger when the object is further away. In addition, the edges of the shadow become ‘fuzzier’ and the maximum ‘darkness’ of the shadow decreases. This results in a smaller ratio of maximum slope of intensity change at the image’s edge over maximum darkness of the image. The ratio of fuzziness over amplitude is the parameter the fish uses to sense distance.
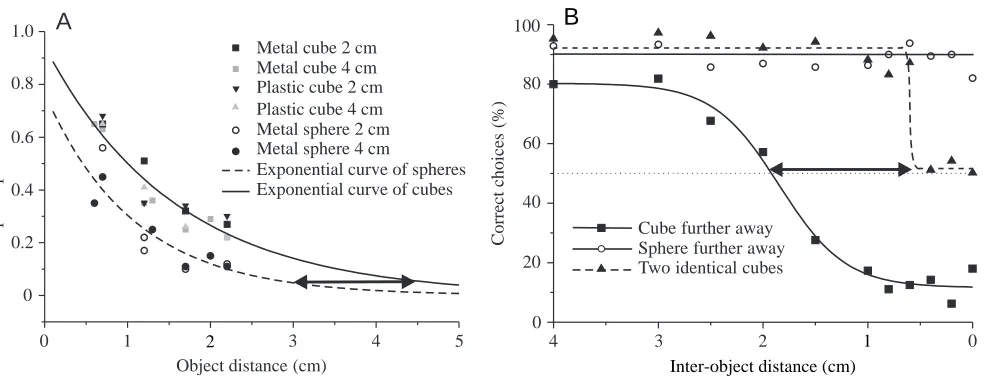
The electric image measurements also revealed that metal spheres (which were made very precisely to be exactly spherical) yielded slope/amplitude ratios that were smaller than those of other objects placed at the same distance (Fig. 4A). We hypothesised that, if the fish indeed used slope/amplitude ratios to determine object distance, then they should make mistakes when electrolocating spheres: they should judge spheres to be located further away than cubes, even if their actual distances were identical. In particular, we predicted that, at a gate distance of 3 cm, the misjudgement of spheres should have a value of approximately 1.5 cm (double arrow in Fig. 4A). Thus, ideally round metal spheres gave us the unique
opportunity to put our hypothesis that fish use slope/amplitude ratios for depth perception to the test.
The results of behavioural training experiments, during which three individuals of G. petersii had to compare the distances of a metal sphere with those of a metal cube of the same diameter, nicely confirmed our hypothesis (Fig. 4B). All the fish tested indeed made the predicted mistakes: they consistently misjudged the distance of the sphere by estimating its distance to be approximately 1.5 cm greater than that of a cube placed at an identical distance (double arrow in Fig. 4B). This result corresponded well to the value we had predicted from our electric image measurements (Fig. 4A) (Schwarz, 1997; von der Emde et al., 1998).
The proposed mechanism for depth perception in mormyrids is different from all spatial orientation mechanisms demonstrated so far in other species, such as stereoscopic vision in toads (Collett, 1977), accommodation in chameleons (Harkness, 1977) or bat echolocation (Schnitzler et al., 1985). It differs from other mechanisms because the fish can employ a single stationary array of electroreceptors and perform three-dimensional depth perception without any time or spectral measurements. Distance discrimination is very accurate, as long as no ideal spherical objects are electrolocated. Very recent evidence even suggests that fish might be able to
Slope/amplituderatio Correct choices
(%)
Object distance (cm) 1.0
0.8
0.6
0.4
0.2
0
0 1 3 4 5 4 3 2 0
0 20 40 60 80 100
Cube further away Sphere further away Metal cube 2 cm
Metal cube 4 cm Plastic cube 2 cm Plastic cube 4 cm Metal sphere 2 cm Metal sphere 4 cm
Exponential curve of spheres Exponential curve of cubes
A
2
B
1 Inter-object distance (cm) Two identical cubes
[image:5.609.66.559.72.261.2]compensate for errors, which occur when natural objects that resemble spheres are electrolocated. When a fish was trained for a considerable period with highly variable types of objects, the electrical illusions described above for metal spheres disappeared almost completely (G. von der Emde and S. Schwarz, unpublished results). This indicates that the fish could recognise the shape of an object and take the ‘errors’, which occur during distance measurement of objects of certain geometrical forms, into account. The fish might ‘subtract’ this error from the distance value obtained while calculating the slope/amplitude ratio and thus arrive at an accurate distance estimate for that particular object. Further experiments have to be conducted to verify this hypothesis.
Analysis of object properties
As mentioned above, electric fish can detect not only the sign of the amplitude change occurring at their electroreceptor organs during electrolocation (and thus determine whether an object has a lower or higher impedance than the surrounding water) but also the presence of capacitative object properties. In their natural habitat, living objects mainly possess complex impedances with a considerable capacitative component
(Heiligenberg, 1973; Schwan, 1963; von der Emde, 1990). Animate objects consist of many membrane-enclosed spaces containing fluids of different ionic composition and different impedances, thus resembling a complex three-dimensional accumulation of mini-condensers. Thus, living matter, such as water plants, fishes and insect larvae, has capacitative properties. Stones or other inanimate objects, in contrast, possess mainly resistive or ohmic properties.
Capacitance detection in mormyrids
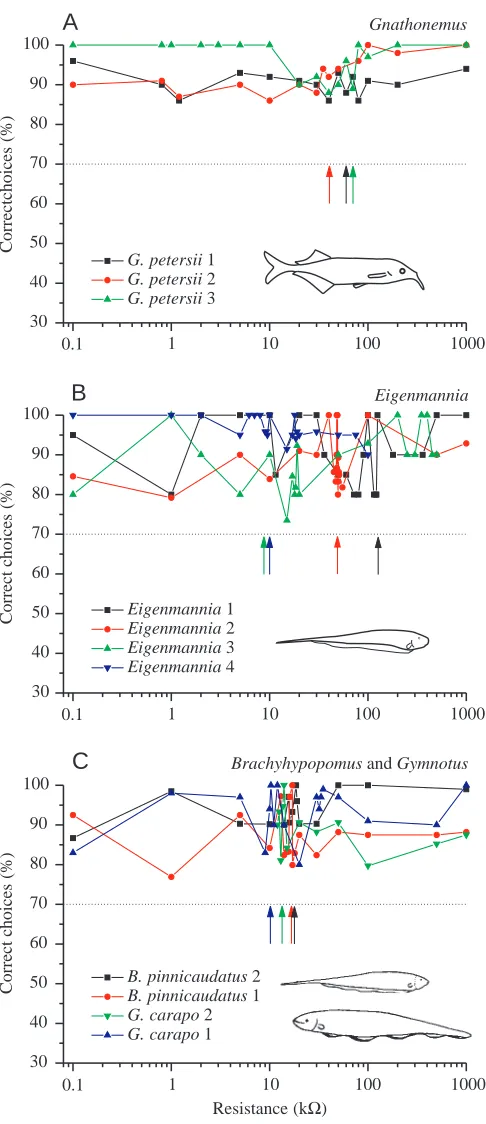
In behavioural experiments, we could show that several species of mormyrid weakly electric fish, all of which emit short, pulse-type EODs (see, for example, Fig. 5A), can discriminate unequivocally between all capacitative and resistive objects tested (Fig. 6A), an ability termed ‘capacitance detection’ (von der Emde, 1990; von der Emde and Ringer, 1992). G. petersii, for example, never confused a capacitative object with capacitative values between approximately 300 pF and 300 nF with any resistive object of identical geometry, even when the impedance of the two objects, and thus the locally occurring EOD peak-to-peak amplitude, was identical (von der Emde, 1990). Because natural capacitative objects in the
0 0 10 20 30 40 50 60 70
Frequency (Hz)
Amplitude
Eigenmannia sp.
Amplitude
0
B
Frequency (Hz)
Amplitude
0.5 ms
Amplitude
0
0 200 400 600 800 1000 1200 1400
5000 0
Gnathonemus petersii
A
5 ms
10000 15000 20000
[image:6.609.74.520.362.689.2]500 1000 1500 2000 2500 3000
freshwater streams the fish inhabit possess capacitative properties of a similar range of values (Heiligenberg, 1973; Schwan, 1963; von der Emde, 1990), our results demonstrated that G. petersii is probably able to discriminate between living and inanimate objects in its natural habitat. These results also demonstrated that mormyrids cannot use EOD amplitude parameters alone for capacitance detection, because this method does not provide the fish with unequivocal capacitance cues.
Recordings of the local signals that stimulate individual electroreceptor organs of a G. petersii during electrolocation revealed which signal parameters are altered when a fish electrolocates a capacitative or a resistive object (Fig. 7A). Resistive objects only affect signal amplitude: the higher the impedance of an object, the lower is the locally occurring EOD amplitude. Capacitative objects, in contrast, affect two stimulus parameters: (i) the local EOD amplitude and (ii) the local EOD waveform and timing. EOD amplitude is inversely correlated with object impedance, as is the case with resistive objects. The local EOD waveform is distorted in a manner that depends on the capacitative value of the object (Fig. 7A). For the types of object used in our experiments (for details, see von der Emde, 1990) and for a water conductivity of 50µS cm−1
(which corresponds to values found in natural habitats; von der Emde, 1993), waveform distortions were maximal for a 1 nF capacitative object. For larger or smaller capacitive values, waveform distortions decreased, such that objects with capacitances larger than 300 nF or smaller than 300 pF induced almost zero pulse distortions. This range of capacitative values corresponds nicely to the detectable range of capacitances shown behaviourally (see above). Interestingly, timing cues within the local EOD changed only little even with the most effective 1 nF object. The maximal changes in timing of the main positive-to-negative zero-crossing of the EOD was only 3µs, while in the presence of capacitative objects that were still detectable by the fish, timing differences were smaller than 500 ns (von der Emde and Bleckmann, 1992).
Further behavioural and physiological experiments confirmed our hypothesis that mormyrids employ waveform cues to detect capacitative properties (summarised in von der Emde, 1998b). The fish can even measure EOD waveform distortions, as well as EOD amplitude, quantitatively and independently from one another, revealing an extreme sensitivity for the analysis of the electrical properties of objects during electrolocation (von der Emde and Ronacher, 1994). We excluded the use of timing cues as well as measurements of the frequency composition of the local EOD for capacitance detection (von der Emde and Zelick, 1995).
How do mormyrids measure local EOD waveform in order to detect capacitative object properties? To answer this question, we recorded from afferents of single electroreceptor
Eigenmannia
Brachyhypopomus and Gymnotus Gnathonemus
B
C
A
30 40 50 60 70 80 90 100
Correct choices
(%)
Eigenmannia 1 Eigenmannia 2 Eigenmannia 3 Eigenmannia 4
30 40 50 60 70 80 90 100
Correct choices
(%)
Resistance (kΩ) B. pinnicaudatus 2 B. pinnicaudatus 1 G. carapo 2 G. carapo 1 0.1
30 40 50 60 70 80 90 100
Correctchoices
(%)
G. petersii 1 G. petersii 2 G. petersii 3
1 10 100 1000
0.1 1 10 100 1000
[image:7.609.52.295.68.630.2]0.1 1 10 100 1000
organs, called mormyromasts (Bell et al., 1989; Szabo and Fessard, 1965), while stimulating them with natural, waveform-distorted EODs (von der Emde and Bleckmann,
1992, 1997). Mormyromasts contain two types of electroreceptor cell, the A- and B-cells (Szabo and Wersäll, 1970), which are innervated separately. Our experiments showed that both types of receptor cell encode signal amplitude, but that only the B-cells are highly sensitive to EOD waveform distortions. Afferents from A- and B-receptors project to two separate zones in the cortex of the electrosensitive lateral line lobe (ELL) in the medulla, each of which contains a somatotopic map of the electroreceptive body surface of the fish. Like A-afferents, neurons in the medial zone of the ELL, which is innervated only by A-type afferents, respond to EOD amplitude changes, but not to EOD waveform distortions. In contrast, units in the dorsolateral zone of the ELL respond very sensitively to EOD waveform distortions caused by capacitative objects in the vicinity of the fish (von der Emde and Bell, 1994). Efferent units of both ELL zones project to the lateral nucleus of the torus semicircularis in the midbrain, probably to the same location within this nucleus (Bell, 1986).
These results led us to formulate a hypothesis on how mormyrids discriminate between resistive and capacitative object properties (Fig. 8). We postulate a ‘subtraction mechanism’, which compares the input of A- and B-afferent fibres to the brain. A resistive object near the fish alters the locally occurring EOD amplitude, but does not distort the waveform (Fig. 8, right side). The amplitude change is
Gnathonemus
Amplitude
Inside positive
Inside negative 0
50 kΩ object 6 nF object 1 nF object
Eigenmannia
Head-to-tail-EOD 500 kΩ object 20 nF object
2 ms
A
B
[image:8.609.50.277.76.470.2]125 µs
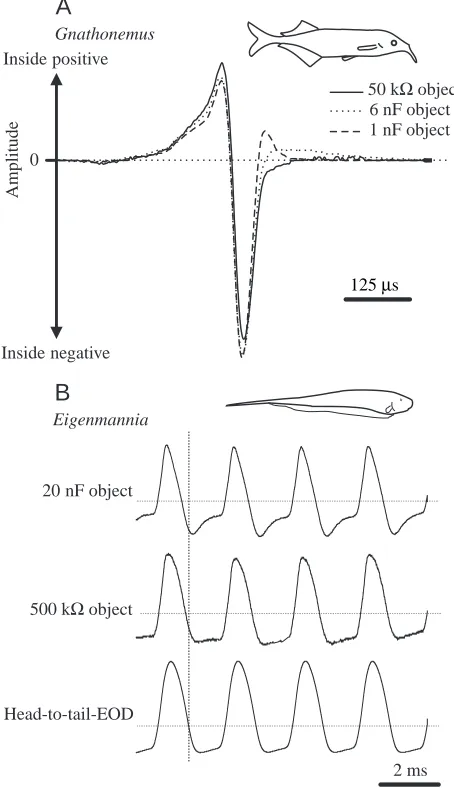
Fig. 7. Effects of different types of object on the local electric organ discharges (EODs) of Gnathonemus petersii (A) and Eigenmannia (B). Local EODs were recorded differentially with two small carbon electrodes placed close to the pore of an electroreceptor organ of each fish. (A) The solid line represents the local EOD recorded in the presence of a 50 kΩ object, a waveform that was identical to the simultaneously recorded head-to-tail EOD. Dotted and dashed lines show EODs in the presence of two types of capacitative object. The peak-to-peak amplitudes of all EODs shown were normalised to the same values. (B) The upper trace shows the local EOD recorded in the presence of a 20 nF capacitative object, the middle trace that recorded in the presence of a 500 kΩresistive object. The lower trace shows the simultaneously recorded head-to-tail EOD. EOD amplitudes were normalised. Dotted lines indicate 0 mV. The vertical dashed line marks the timing of the zero-crossing of the positive-to-negative transient of the head-to-tail EOD. Note that the EODs of G.
petersii are waveform-distorted by capacitative objects, while timing
cues are affected only minimally. In contrast, large time shifts are induced in the EOD of Eigenmannia by the 20 nF object.
Capacitative object
Resistive object
Electric organ
[image:8.609.322.549.76.274.2]‘reported’ to the brain by the A- and B-afferent fibres. A subtraction of the similar changes in A- and B-inputs yields zero, leading to the identification of a resistive object. In contrast, a capacitative object will cause waveform distortions in addition to a change in EOD amplitude (Fig. 8, left side). A-afferent fibres do not respond to waveform changes and thus still ‘report’ the amplitude change caused by the object to the brain. B-fibres are affected not only by amplitude changes but also by changes in EOD waveform, the latter being proportional to the capacitative value of the object. As a consequence, B-fibres provide a much larger input to the postulated central ‘subtraction mechanism’ than A-fibres. Subtraction of A- and B-fibre inputs cancels out the amplitude change caused by the object and leaves a value that corresponds to the value of the capacitance of the object under investigation.
Initial electrophysiological experiments provide evidence that the proposed subtraction mechanism might indeed exist in the brain of G. petersii. We found areas in the lateral nucleus of the torus in which field potential changes occurred in response to EOD waveform distortions. While the responses in the ELL were found to be proportional to the size of the waveform distortion, the responses in the lateral toral nucleus appear to depend on particular capacitative values (Mohr and von der Emde, 1998). Whether single neurones in these areas fire independently of signal amplitude and thus constitute a direct correlate of the postulated subtraction process must be demonstrated in future experiments.
Capacitance detection in gymnotiforms
The results found in mormyrid fish raise the question of whether other weakly electric fish also perform capacitance detection and, if so, whether they use the same mechanism as pulse-type mormyrid fish. Additional experiments to answer these questions were conducted with South American gymnotiform fish. Gymnotiforms have evolved their electric sense independently from the African mormyrids (Bullock et al., 1982; New, 1997), resulting in a different organisation of electric organs as well as of peripheral and central electrosensory structures. We tested both pulse-type gymnotiforms with EODs like those of G. petersii and wave-type fish with electric organs that discharge continuously, resulting in a quasi-sinusoidal wave-type EOD (Fig. 5B).
Several individuals of two pulse-type gymnotiform species,
Brachyhypopomus pinnicaudatus and Gymnotus carapo, as
well as several individuals of the wave-type species
Eigenmannia sp., were trained to discriminate between
capacitative and resistive objects in experiments that were similar to those described above for G. petersii. All three species could perform capacitance detection (Fig. 6A–C). Moreover, in all three species, the natural range of detectable capacitative values includes the capacitative values of natural objects and thus might allow these fish to discriminate between living and inanimate matter in their natural environment (von der Emde, 1998a; Wagner and von der Emde, 1998). Thus, the
sensory capabilities of the gymnotiform and mormyrid species tested so far are remarkably similar.
Specific physiological data concerning the mechanism of capacitance detection in gymnotiforms is not yet available. However, what we do know suggests a different mechanism from that of mormyrids, at least for Eigenmannia. Fig. 7B shows what happens to the local EOD of an Eigenmannia when either a resistive 500 kΩobject or a capacitative 20 nF object is present. The waveform and the timing of the local EODs are only minimally affected by a resistive object but are strongly affected by a capacitative object. For example, the timing of the main positive-to-negative-going transient of the EOD shifts by as much as 170µs in the presence of a 30 nF object (von der Emde, 1998a). This shift is much greater than that occurring with Gnathonemus EODs, where time shifts never exceeded 3µs (see above).
In view of the physiology of the electroreceptor organs of
Eigenmannia, the most likely explanation for the detection of
capacitative-induced EOD changes involves time measurements. Among the two types of electroreceptor organs of this species, only the so-called T-coders (T for time), which fire a single action potential phase-locked to a particular phase of the EOD cycle, have been shown to respond differentially to capacitative versus resistive impedances of equal value (Scheich and Bullock, 1974). Even though this type of receptor organ was not specifically tested for its ability to encode stimulus waveform, it appears rather unlikely that it does so, because its firing behaviour is affected only minimally when the natural EOD is substituted by a sinusoidal signal in curarised fish (see von der Emde, 1998a). However, it has been demonstrated in several experiments that Eigenmannia can detect even minute timing differences in their EODs over different parts of the body surface (Heiligenberg, 1991).
In Eigenmannia, the mechanism of capacitance detection probably involves mainly time measurements (Rose and Heiligenberg, 1986). During electrolocation of a capacitative object, the timing of the local EOD changes over those parts of the electroreceptive surface that are closest to the object. In contrast, other parts of the body, which are further away from the object, are only minimally affected. By comparing the timing differences of their EODs at these differentially affected body parts, Eigenmannia would be able to detect the presence of a capacitative object and to discriminate it from a resistive object, even if both had the same impedance.
permits discrimination between living and inanimate objects without the use of vision. Similar ecological constraints might have led to the development of almost identical behaviours. However, the neuronal algorithms forming the basis of these behaviours appear to be fundamentally different in the two fish groups.
I am grateful to Curtis Bell, Horst Bleckmann, Kirsty Grant, Claudia Mohr, Bernd Ronacher, Stephan Schwarz and Randy Zelick for their stimulating collaboration in some of the projects reported. I thank Curtis Bell, Walter Metzner and Ray Turner for many helpful comments and suggestions on this manuscript. The work by the author reported here was supported by grants from the Deutsche Forschungsgemeinschaft (Em 43/4-1; Em 43/1-1,2,3) and by a NATO fellowship conveyed through the DAAD.
References
Bastian, J. (1986). Electrolocation: behavior, anatomy and physiology. In Electroreception (ed. T. H. Bullock and W. Heiligenberg), pp. 577–612. New York: John Wiley & Sons.
Bastian, J. (1989). Electroreception. In Comparative Perception, vol.
2, Complex Signals (ed. W. C. Stebbins and M. H. Berkeley), pp. 35–89. New York: Wiley.
Bell, C. C. (1986). Electroreception in mormyrid fish. Central
physiology. In Electroreception (ed. T. H. Bullock and W. Heiligenberg), pp. 423–451. New York: John Wiley & Sons.
Bell, C. C., Zakon, H. and Finger, T. E. (1989). Mormyromast
electroreceptor organs and their afferent fibers in mormyrid fish. I. Morphology. J. Comp. Neurol. 286, 391–407.
Bullock, T. H., Northcutt, R. G. and Bodznick, D. A. (1982).
Evolution of electroreception. Trends Neurosci. 5, 50–53.
Caputi, A., Budelli, R., Grant, K. and Bell, C. C. (1998). The
electric image in weakly electric fish: physical images of resistive objects in Gnathonemus petersii. J. Exp. Biol. 201, 2115–2128.
Collett, T. (1977). Stereopsis in toads. Nature 267, 349–351. Harkness, L. (1977). Chameleons use accommodation cues to judge
distance. Nature 267, 346–349.
Heiligenberg, W. (1973). Electrolocation of objects in the electric
fish Eigenmannia (Rhamphichthyidae, Gymnotoidei). J. Comp.
Physiol. 87, 137–164.
Heiligenberg, W. (1976). Electrolocation and jamming avoidance in
the mormyrid fish Brienomyrus. J. Comp. Physiol. A 109, 357–372.
Heiligenberg, W. (1977). Principles of electrolocation and jamming
avoidance in electric fish. A neuroethological approach. In Studies
of Brain Function, vol. 1 (ed. V. Braitenberg), pp. 1–85. Berlin,
Heidelberg, New York: Springer Verlag.
Heiligenberg, W. (1991). Neural Nets in Electric Fish. Cambridge,
London: MIT Press. 179pp.
Kalmijn, A. J. (1987). Detection of weak electric fields. In Social Communication in Aquatic Environments (ed. J. Atema, R. R. Fay,
A. N. Popper and W. N. Tavolga), pp. 151–186. Berlin, Heidelberg, New York: Springer Verlag.
Lissmann, H. W. (1951). Continuous electric signals from the tail of
a fish, Gymnarchus niloticus Cuv. Nature 167, 201–202.
Lissmann, H. W. and Machin, K. E. (1958). The mechanism of
object location in Gymnarchus niloticus and similar fish. J. Exp.
Biol. 35, 451–486.
Metzner, W. (1998). Measuring distance in two dimensions. Nature 395, 838–839.
Meyer, J. H. (1982). Behavioral responses of weakly electric fish to
complex impedances. J. Comp. Physiol. 145, 459–470.
Mohr, C. and von der Emde, G. (1998). Mapping of the nucleus
lateralis (torus semicircularis) of the electrosensory system of
Gnathonemus petersii. In New Neuroethology on the Move. Proceedings of the 26th Göttingen Neurobiology Conference 1998,
vol. I (ed. N. Elsner and R. Wehner), pp. 54. Stuttgart, New York: Thieme.
New, J. G. (1997). The evolution of vertebrate electrosensory
systems. Brain Behav. Evol. 50, 244–252.
Push, S. and Moller, P. (1979). Spatial aspects of electrolocation in
the mormyrid fish, Gnathonemus petersii. J. Physiol., Paris 75, 355–357.
Rasnow, B. (1996). The effects of simple objects on the electric field
of Apteronotus. J. Comp. Physiol. A 178, 397–411.
Rasnow, B. and Bower, J. M. (1997). Imaging with electricity: How
weakly electric fish might perceive objects. In Proceedings of
Computational Neuroscience: Trends in Research 1997. New
York, London: Plenum Press.
Rose, G. and Heiligenberg, W. (1986). Limits of phase and
amplitude sensitivity in the torus semicircularis of Eigenmannia. J.
Comp. Physiol. A 159, 813–822.
Scheich, H. and Bullock, T. H. (1974). The detection of electric
fields from electric organs. In Electroreceptors and Other
Specialized Receptors in Lower Vertebrates, vol. III/3 (ed. A.
Fessard), pp. 201–256. Berlin, Heidelberg, New York: Springer Verlag.
Schnitzler, H.-U., Menne, D. and Hackbarth, H. (1985). Range
determination by measuring time delays in echolocating bats. In
Time Resolution in Auditory Systems (ed. A. Michelsen), pp.
180–204. Berlin, Heidelberg: Springer Verlag.
Schwan, H. P. (1963). Determination of biological impedances. In Physical Techniques in Biological Research, vol. VI (ed. W. L.
Nastuk), pp. 323–407. New York: Academic Press.
Schwarz, S. (1997). Entfernungsmessung mit Hilfe der Elektroortung
beim schwach-elektrischen Fisch Gnathonemus petersii. Thesis, Zoological Institute, Bonn, University of Bonn.
Szabo, T. and Fessard, A. (1965). Le fonctionnement des
électrorécepteurs étudié chez les Mormyres. J. Physiol., Paris 57, 343–360.
Szabo, T. and Wersäll, J. (1970). Ultrastructure of an electroreceptor
(mormyromast) in a mormyrid fish, Gnathonemus petersii. II. J.
Ultrastruct. Res. 30, 473–490.
Toerring, M. J. and Belbenoit, P. (1979). Motor programmes and
electroreception in mormyrid fish. Behav. Ecol. Sociobiol. 4, 369–379.
Toerring, M. J. and Moller, P. (1984). Locomotor and electric
displays associated with electrolocation during exploratory behavior in mormyrid fish. Behav. Brain Res. 12, 291–306.
von der Emde, G. (1990). Discrimination of objects through
electrolocation in the weakly electric fish, Gnathonemus petersii.
J. Comp. Physiol. A 167, 413–421.
von der Emde, G. (1993). The sensing of electric capacitances by
weakly electric mormyrid fish: effects of water conductivity. J. Exp.
Biol. 181, 157–173.
von der Emde, G. (1998a). Capacitance detection in the wave-type
electric fish Eigenmannia during active electrolocation. J. Comp.
Physiol. A 182, 217–224.
Fishes (ed. D. H. Evans), pp. 313–343. Boca Raton, FL: CRC
Press.
von der Emde, G. and Bell, C. C. (1994). Responses of cells in the
mormyrid electrosensory lobe to EODs with distorted waveforms: implications for capacitance detection. J. Comp. Physiol. A 175, 83–93.
von der Emde, G. and Bleckmann, H. (1992). Differential
responses of two types of electroreceptive afferents to signal distortions may permit capacitance measurement in a weakly electric fish, Gnathonemus petersii. J. Comp. Physiol. A 171, 683–694.
von der Emde, G. and Bleckmann, H. (1997). Waveform tuning of
electroreceptor cells in the weakly electric fish, Gnathonemus
petersii. J. Comp. Physiol. A 181, 511–524.
von der Emde, G. and Bleckmann, H. (1998). Finding food: Senses
involved in foraging for insect larvae in the electric fish
Gnathonemus petersii. J. Exp. Biol. 201, 969–980.
von der Emde, G. and Ringer, T. (1992). Electrolocation of
capacitive objects in four species of pulse-type weakly electric fish. I. Discrimination performance. Ethology 91, 326–338.
von der Emde, G. and Ronacher, B. (1994). Perception of electric
properties of objects in electrolocating weakly electric fish: two-dimensional similarity scaling reveals a City-Block metric. J.
Comp. Physiol. A 175, 801–812.
von der Emde, G., Schwarz, S., Gomez, L., Budelli, R. and Grant, K. (1998). Electric fish measure distance in the dark. Nature 395,
890–894.
von der Emde, G. and Zelick, R. (1995). Behavioral detection of
electric signal waveform distortion in the weakly electric fish,
Gnathonemus petersii. J. Comp. Physiol. A 177, 493–501. Wagner, K. and von der Emde, G. (1998). Discrimination of
resistive and capacitive objects through active electrolocation in two species of South American weakly electric fish. In New
Neuroethology on the Move. Proceedings of the 26th Göttingen Neurobiology Conference 1998, vol. I (ed. N. Elsner and R.
Wehner), pp. 52. Stuttgart, New York: Thieme.
Zakon, H. H. (1987). The electroreceptors: diversity in structure and