A marked evolutionary convergence has been demonstrated for the lamnid sharks (order Lamniformes; family Lamnidae) and tunas (order Perciformes; family Scombridae) in specializations related to an increased capacity for sustained, aerobic locomotion (i.e. high-performance swimming; Bernal et al., 2001a). The sustained swimming of all fishes is powered by the red myotomal muscle (RM; Bone, 1978a) and, in most species, RM occurs along the posterior lateral edges of the body and is the dominant fiber type in that region [approximately 75–85% fork length (FL)] subject to maximal body bending during caudal thrust production (Greer-Walker and Pull, 1975). Lamnids and tunas, however, are different in having their RM in a more anterior and central position (Graham et al., 1983; Carey et al., 1985; Graham and Dickson, 2000, 2001; Bernal et al., 2001a).
The ‘high-performance swimming adaptations’ of tunas and lamnids include features enhancing tissue O2 transfer at the
gills (i.e. a large gill-surface area), the capacity to deliver a large quantity of O2to the RM (i.e. a large heart with a thick
compact myocardial layer, a large stroke volume and well-developed coronary circulation and both a high blood hemoglobin concentration [Hb] and hematocrit) and regional endothermy (Dickson, 1996; Lai et al., 1997; Bernal et al., 2001a; Brill and Bushnell, 2001; Korsmeyer and Dewar, 2001). Although the presence of these high-performance adaptations in tunas and lamnids suggests that both groups are capable of sustaining a higher aerobic metabolism during swimming relative to that of other fishes (Bernal et al., 2001a), there is no direct experimental evidence that these adaptations increase swimming efficiency (Katz, 2002).
doi:10.1242/jeb.00481
Tunas (family Scombridae) and sharks in the family Lamnidae are highly convergent for features commonly related to efficient and high-performance (i.e. sustained, aerobic) swimming. High-performance swimming by fishes requires adaptations augmenting the delivery, transfer and utilization of O2by the red myotomal muscle
(RM), which powers continuous swimming. Tuna swimming performance is enhanced by a unique anterior and centrally positioned RM (i.e. closer to the vertebral column) and by structural features (relatively small fiber diameter, high capillary density and greater myoglobin concentration) increasing O2flux from RM capillaries to
the mitochondria. A study of the structural and biochemical features of the mako shark (Isurus oxyrinchus) RM was undertaken to enable performance-capacity comparisons of tuna and lamnid RM. Similar to tunas, mako RM is positioned centrally and more anterior in the body. Another lamnid, the salmon shark (Lamna ditropis), also has this RM distribution, as does the closely related common thresher shark (Alopias vulpinus; family Alopiidae). However, in both the leopard shark (Triakis semifasciata) and the blue shark (Prionace glauca), RM
occupies the position where it is typically found in most fishes; more posterior and along the lateral edge of the body. Comparisons among sharks in this study revealed no differences in the total RM quantity (approximately 2–3% of body mass) and, irrespective of position within the body, RM scaling is isometric in all species. Sharks thus have less RM than do tunas (4–13% of body mass). Relative to published data on other shark species, mako RM appears to have a higher capillary density, a greater capillary-to-fiber ratio and a higher myoglobin concentration. However, mako RM fiber size does not differ from that reported for other shark species and the total volume of mitochondria in mako RM is similar to that reported for other sharks and for tunas. Lamnid RM properties thus suggest a higher O2flux capacity than in
other sharks; however, lamnid RM aerobic capacity appears to be less than that of tuna RM.
Key words: lamnid shark, tuna, myotome, red muscle, aerobic capacity, myoglobin, muscle ultrastructure, scaling, allometry, Lamnidae, Scombridae, Isurus, Lamna, Alopias, Mustelus, Triakis,
Prionace. Summary
Introduction
Comparative studies of high performance swimming in sharks
I. Red muscle morphometrics, vascularization and ultrastructure
D. Bernal
1,*, C. Sepulveda
1, O. Mathieu-Costello
2and J. B. Graham
11Center for Marine Biotechnology and Biomedicine and Marine Biology Research Division, Scripps Institution of
Oceanography, University of California San Diego, La Jolla, CA 92093-0204, USA and 2Department of Medicine,
University of California San Diego, La Jolla, CA 92093-0623, USA
*Author for correspondence at present address: Department of Zoology, Weber State University, Ogden, UT 84408-2505, USA (e-mail: [email protected])
Relative to the RM of other fishes, tuna RM receives a large percentage of cardiac output (White et al., 1988) and has a greater capacity for mitochondrial oxidative phosphorylation (i.e. ATP production; Dickson, 1995, 1996). Consistent with the heightened aerobic capacity of tuna RM are structural and biochemical features favoring O2 transfer from the RM
capillaries to the fiber mitochondria. These include a relatively small RM fiber diameter, high capillary densities, the presence of capillary manifolds, which increase capillary surface area to fiber volume ratio, and a higher muscle myoglobin concentration [Mb], which enhances the diffusion of O2from
the blood into the muscle cells (Wittenberg, 1970; Bone, 1978b; Mathieu-Costello et al., 1992, 1995, 1996; Dickson, 1995, 1996; Sidell, 1998; Suzuki and Imai, 1998).
The objective of this study is to provide comparative data on the position and quantity of lamnid RM and on this tissue’s structural properties related to high-performance swimming. Although lamnid sharks are thought to have RM specializations for enhanced O2transfer that are comparable to
those of tunas, this has not been documented. Also, data showing the position of the maximal RM cross-sectional area of makos and other lamnids presented by Carey et al. (1985) are suggestive of a tuna-like RM distribution pattern but indicate a much smaller RM quantity in lamnids relative to tunas. Using mako sharks and other lamnids, we have quantified RM position and developed an algorithm to extract more quantitative RM data from the findings of Carey et al. (1985). We also report preliminary RM ultrastructural and biochemical findings relating to lamnid RM aerobic capacity and compare these features with those of other non-lamnid sharks and tunas.
Materials and methods
Specimens used in this study were captured, maintained and euthanized following procedures dictated by the type of study (described below) and in accordance with protocols approved by the University of California San Diego Institutional Animal Care and Use Committee.
RM distribution and quantification
The longitudinal distribution of RM was measured in two lamnid and three non-lamnid shark species. The lamnid sharks are the shortfin mako shark (Isurus oxyrinchus Rafinesque 1810; body mass, 5–50·kg; N=8) and the salmon shark (Lamna ditropis Hubbs and Follet 1947; 15.9–148·kg; N=2). The three non-lamnid sharks are the common thresher shark (Alopias vulpinus Bonnaterre 1788; 9.1–70.4·kg; N=6) and two species in the order Carcharhiniformes, the blue shark (Prionace glauca L.; family Carcharhinidae; 2.1–22.2·kg; N=4) and the leopard shark (Triakis semifasciata Girard 1855; family Triakidae; 1.4–15·kg; N=3).
In all of the species studied, measurable quantities of RM did not occur anterior to 23–25% FL. Beginning at this position, whole frozen sharks were cut into approximately 2–3·cm-thick transverse sections to the caudal peduncle
(85–95% FL). In the common thresher shark, where the RM extends far into the very long upper caudal fin lobe (Fig.·1), sections were extended to 140% FL.
High-resolution digital images of the anterior side of each section were obtained and the cross-sectional area of RM determined (NIH Image 4.02). For all sharks, the longitudinal distribution of RM was obtained by transforming the RM surface area (cm2) at 50% FL (see Table·1) to a relative
value of 1 and using this value as the reference point for all other positions along the body. The volume of RM in each slice was calculated as the product of the RM surface area (mean of the anterior and posterior faces of each slice) and slice thickness. Red muscle mass in each slice was determined as the product of RM volume and RM density (predetermined to be 1.05±0.02·g·cm–3, mean ± S.E.M.; N=10), with the sum of RM in all sections indicating total RM mass (TRMM) for the shark. Our image analysis (IA) TRMM methodology was validated for three makos (5.3·kg, 14.0·kg and 16.6·kg) by comparing TRMM results from IA with values obtained by gross dissection and gravimetric determination (GD).
The TRMM and RM linear distribution determinations for mako sharks in this study enabled us to convert the RM data presented by Carey et al. (1985) into additional estimates of TRMM. These workers had originally reported the maximal RM cross-sectional area of nine makos (5–75·kg) and expressed TRMM as a percentage of total axial muscle mass. By combining the RM data for seven of those makos with our mako RM distribution analysis, we were able to express them in terms of percentage body mass.
Myoglobin analysis General
Red muscle myoglobin concentration [Mb] was quantified using a modification of the high-performance liquid chromatography (HPLC) method of Kryvi et al. (1981). Fresh or frozen (–80°C) RM samples were obtained from I. oxyrinchus (5.9–46.7·kg; N=10), L. ditropis (91.2–114·kg; N=2) and A. vulpinus (6.35–45.5·kg; N=7). To compare our methods with those of Kryvi et al. (1981), we measured the RM [Mb] in one specimen of the gray smoothhound (Mustelus californicus; order Carcharhiniformes; family Triakidae; 0.8·kg), which belongs to the same order and has an RM distribution pattern similar to that of the species studied by those investigators.
Approximately 0.2·g of RM was homogenized in a 15·ml tissue grinder (Kontes Duall 23) using 9× the tissue mass of running buffer (30·mmol·l–1KH
2PO4, pH 7.2 at 20°C). Solid
particulates were separated by centrifugation at 12·000·g for 10·min at 4°C and the supernatant containing the dissolved Mb was removed and diluted 2× using running buffer. Sufficient Na2S2O4 (approximately 1·mg) was added to each sample
HPLC parameters
Separation of tissue Mb and Hb is based on their different molecular masses (Mb, ~16·kDa; Hb, ~64·kDa) and thus their different elution times through a silica-based size exclusion column [Alltech PEEK Macrosphere GPC (60·Å; 7·µm; 4.6·mm diameter × 250·mm length), protected by a guard column (Alltech MF Guard; 60 Å; 6·µm)]. The gel permeation column (approximately 1.7·ml exclusion volume) was equilibrated with at least 150·ml of running buffer prior to the injection of the first sample. A 200·µl injection loop was used to load 25·µl of filtered and reduced tissue homogenates. Myoglobin was quantified by flowing degassed running buffer (0.3·ml·min–1) through a diode array detector (Beckman Gold
168) at 413·nm.
Myoglobin quantification
A linear relationship (r=0.99) between known quantities of purified Mb (Sigma M 0630) and the integrated area under the curve was used to quantify RM [Mb]. The lower [Mb] detection limit was 17·pmol Mb (0.28·mg·Mb·g–1·tissue·wet·mass). Verification of an adequate
size-based separation was established by the injection of mixed Mb and Hb (Sigma H 4632) standards and the resulting time-separated maximum absorbance peaks.
RM vascularization and ultrastructure
The tissues of two mako sharks (95·cm FL, 9·kg; 100·cm FL, 12·kg) were fixed in situ via perfusion of glutaraldehyde following methods detailed in Mathieu-Costello et al. (1992). Sharks were attracted to the boat, dip netted and returned to the laboratory alive (see Bernal et al., 2001b). Once in the laboratory, sharks were secured ventral-side up in a restraining
V-board, and a 2.5·cm-diameter hose was inserted into the mouth to ensure that well-oxygenated running seawater flowed over the gills during the entire procedure. A dose of anesthetic (1:5000; MS-222) was mixed with seawater and the fish was ventilated for an additional 5–10·min to allow for complete sedation before surgery.
A midline incision exposed the heart, and a cannula was inserted into the conus arteriosus. All systemic blood returning to the heart was drained by cutting away the sinus venosus. Perfusion with heparinized saline solution [574·mmol·l–1NaCl
(approximately 1100·mosmol·l–1) containing 20·ml·l–1
1000·sodium heparin USP; Elkins-Sinn Inc., Cherry Hill, NJ, USA] preceded the fixative solution [6.25% glutaraldehyde in 0.1·mol·l–1sodium cacodylate (Polysciences Inc., Warrington,
PA, USA) buffer, pH 7.4 at 20°C, 132·mmol·l–1 NaCl
(approximately 1100·mosmol·l–1)]. Both the saline solution and
the fixative buffer were administered at an in vivo non-pulsatile blood pressure of approximately 9.3 kPa (Lai et al., 1997).
Following perfusion, RM samples (1·cm×4·mm×1·mm; approximately 0.04·g) were taken at approximately 45% FL (under the first dorsal fin) and cut into longitudinal strips for storage in the fixative solution. Samples were minced into small blocks (1·mm×1·mm×2·mm) for subsequent transverse
(α=0°, angle between normal section and muscle fiber axis) and longitudinal (α=π/2) section orientations and postfixed with osmium tetroxide solution prior to being embedded in Araldite for morphometric analyses using light microscopy and transmission electron microscopy, as described in Mathieu-Costello et al. (1992).
Sections (1·µm) from each mako shark were cut in transverse (4–6 blocks per shark) and longitudinal (2 blocks) orientations and stained with 0.1% aqueous Toluidine Blue solution. Morphometric analyses followed the methods in Mathieu-Costello et al. (1992) for tuna locomotor muscle. The mean sarcomere length (lo) in each mako was estimated from
longitudinal sections by direct measurements of 40 muscle cells at 1000×magnification. A section angle closest to π/2 was determined by rotating the tissue block on the microtome in 1° increments until the shortest lowas measured in the sections.
Mean fiber cross-sectional area [a¯(f)], and capillary density per mm2 sectional area of muscle fiber [transverse, Q
A(0);
longitudinal, QA(π/2)] were estimated by point-counting, at
400× magnification, one transverse section from each block (total 10 blocks). Capillary density was calculated from the longitudinal sections (2 blocks) in the 9·kg mako but not in the 12·kg specimen because the capillaries were partially collapsed as a result of an incomplete perfusion fixation.
The ratio QA(0)/QA(π/2) was used to calculate the capillary
anisotropy concentration parameter, K (from tables in Mathieu et al., 1983), and then to estimate the orientation coefficient c(K,0), which relates the capillary counts per unit area of fiber in a transverse orientation and is used to estimate the relative increase in capillary length per volume of muscle fiber. A c(K,0) of 1 indicates that capillaries run straight and parallel to the muscle fiber axis and are unbranched, while the maximum c(K,0) value of 2 indicates that there is no preferential orientation relative to the muscle fiber axis (i.e. it is random; Mathieu et al., 1983). The product of QA(0) and c(K,0) was used to estimate total capillary length per volume of muscle fiber, JV(c,f) [i.e. this term includes the contributions
of capillary tortuosity (vessel convolutions that increase the fiber contact area) and branching; Mathieu-Costello et al., 1992]. The mean number of capillaries surrounding each muscle fiber (NCAF) were estimated by counting directly at a
magnification of 400×(n=≥200 fibers per muscle sample), and the mean fiber diameter [d¯(f)] was estimated by 2·[a¯(f)/π]0.5,
assuming a circular fiber cross-sectional area. Mean capillary diameter [d¯(c)] was measured (n=21) using a 1·µm scale eyepiece grid at a magnification of 400×. Measurement of d¯(c) was limited to circle-shaped capillary sections in which the ratio between the smaller and larger diameters did not exceed 1.2 (i.e. 20%).
systematic random sampling of one transverse section from each block examined at a final magnification of 9208×using a Zeiss 10 transmission electron microscope (Mathieu-Costello et al., 1992).
Statistical analysis
All statistical analyses were performed at a significance level of α=0.05. The allometric relationship aMb±95%C.I. (where a is
a constant and M is body mass) was used to obtain the scaling coefficient b for TRMM in the different shark species, and a
Student’s t-test was used to determine if b=1 (i.e. isometric scaling). The mean values for different data sets were compared using a Student’s t-test.
Results RM distribution
The linear distributions of RM in the five shark species are shown in Fig.·1. Table·1 contains the corresponding morphological data for each shark studied and data for other
10
0 20 30 40 50 60 70 80 90100110 120 1.0
0.2 0.4 0.6 0.8 1.2 1.4
A
10
0 20 30 40 50 60 70 80 90100110 120 1.0
0.2 0.4 0.6 0.8 1.2 1.4
B
Relative red muscle cross-sectional area
0 10 20 30 40 50 60 70 80 90100110 120 1.0
0.2 0.4 0.6 0.8 1.2 1.4
E
% Fork length
10 20 30 40 50 60 70 80 90100110 120 1.0
0.2 0.4 0.6 0.8 1.2 1.4
C
120 10 20 30 40 50 60 70 80 90100110 1.0
0.2 0.4 0.6 0.8 1.2 1.4
D
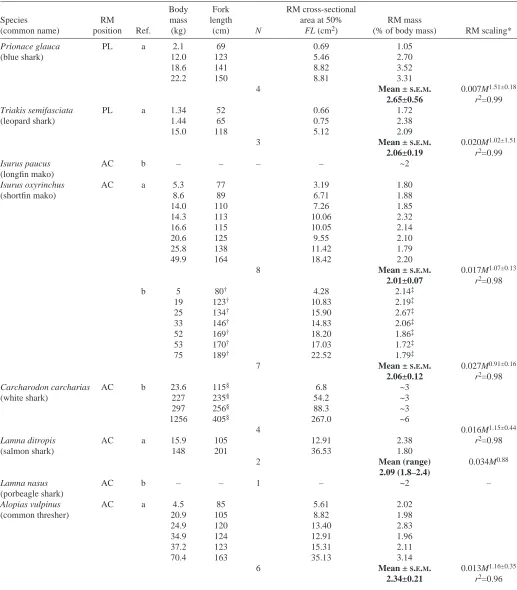
Table 1. Shark red muscle (RM) body position, quantities and allometry based on data from the present study and Carey et al. (1985)
Body Fork RM cross-sectional
Species RM mass length area at 50% RM mass
(common name) position Ref. (kg) (cm) N FL (cm2) (% of body mass) RM scaling*
Prionace glauca PL a 2.1 69 0.69 1.05
(blue shark) 12.0 123 5.46 2.70
18.6 141 8.82 3.52
22.2 150 8.81 3.31
4 Mean ±S.E.M. 0.007M1.51±0.18
2.65±0.56 r2=0.99
Triakis semifasciata PL a 1.34 52 0.66 1.72
(leopard shark) 1.44 65 0.75 2.38
15.0 118 5.12 2.09
3 Mean ±S.E.M. 0.020M1.02±1.51
2.06±0.19 r2=0.99
Isurus paucus AC b – – – – ~2
(longfin mako)
Isurus oxyrinchus AC a 5.3 77 3.19 1.80
(shortfin mako) 8.6 89 6.71 1.88
14.0 110 7.26 1.85
14.3 113 10.06 2.32
16.6 115 10.05 2.14
20.6 125 9.55 2.10
25.8 138 11.42 1.79
49.9 164 18.42 2.20
8 Mean ±S.E.M. 0.017M1.07±0.13
2.01±0.07 r2=0.98
b 5 80† 4.28 2.14‡
19 123† 10.83 2.19‡
25 134† 15.90 2.67‡
33 146† 14.83 2.06‡
52 169† 18.20 1.86‡
53 170† 17.03 1.72‡
75 189† 22.52 1.79‡
7 Mean ±S.E.M. 0.027M0.91±0.16
2.06±0.12 r2=0.98
Carcharodon carcharias AC b 23.6 115§ 6.8 ~3
(white shark) 227 235§ 54.2 ~3
297 256§ 88.3 ~3
1256 405§ 267.0 ~6
4 0.016M1.15±0.44
Lamna ditropis AC a 15.9 105 12.91 2.38 r2=0.98
(salmon shark) 148 201 36.53 1.80
2 Mean (range) 0.034M0.88
2.09 (1.8–2.4)
Lamna nasus AC b – – 1 – ~2 –
(porbeagle shark)
Alopias vulpinus AC a 4.5 85 5.61 2.02
(common thresher) 20.9 105 8.82 1.98
24.9 120 13.40 2.83
34.9 124 12.91 1.96
37.2 123 15.31 2.11
70.4 163 35.13 3.14
6 Mean ±S.E.M. 0.013M1.16±0.35
2.34±0.21 r2=0.96 Abbreviations: a, present study; b, Carey et al. (1985); AC, anterior and central; PL, posterior and lateral.
*Scaling equation: aMb±95%C.I, where a is a constant, M is mass (kg) and b is the scaling coefficient.
†Fork length estimated from Kohler et al. (1994).
‡Red muscle mass values estimated by using the RM longitudinal distribution analysis in Fig.·1.
lamnids, including the mako TRMM estimates derived from the original data presented by Carey et al. (1985). Lateral views of each shark together with one-half transverse sections of the body between 40% and 50% FL document specific differences in the lateral and linear position of RM (Fig.·1). In the blue sharks and leopard sharks, both of which have a more posterior and lateral RM position, RM is more uniformly distributed along the body (i.e. the relative cross-sectional area remains at a near maximal value between 50% and 80% FL), passing through the caudal peduncle and terminating at the base of the caudal fin (Fig.·1A,B). By contrast, in the lamnids and the common thresher shark, RM occurs more anterior in the body and is also in a more central position (Fig.·1C–E). The salmon shark has the most anterior RM position (peak RM area at approximately 40% FL) and the RM terminates far anterior of the caudal peduncle (at approximately 61% FL; Fig.·1C). Mako shark RM peaks slightly more posteriorly (at approximately 45% FL) than in the salmon shark but extends much further along the body, reaching the caudal peduncle (approximately 90% FL; Fig.·1D). The thresher shark has a broader region of peak RM area (45–55% FL) and a small quantity of RM extends as far as 140% into the upper lobe of the caudal fin (Fig.1E).
RM scaling
The image analysis (IA) and gravimetric (GD) techniques for TRMM determination are in good agreement. Respective values for the three makos studied are given in terms of body mass (kg) and TRMM (kg) for IA/GD techniques: 5.3, 0.099/0.095; 14.0, 0.255/0.260; 16.6, 0.337/0.355. Table·1 shows the TRMM determined for each shark studied and also includes values for seven of the makos for which TRRM mass was estimated from the maximum RM cross-sectional area data reported by Carey et al. (1985). There is no significant difference in the RM scaling coefficients for the shark species studied and there is considerable overlap in the percentage of RM found for all species (Table·1). Moreover, the scaling coefficients and the relative amount of RM are not different, even when the shark species are separated into two distinct groups based on similarities in RM position [i.e. in a more posterior and lateral position (blue sharks and leopard sharks) vs a more anterior and central position (mako sharks, salmon sharks and common thresher sharks); Table·1]. Thus, the entire RM data set for the five species was combined to form a single scaling function (0.018M1.05±0.08; r2=0.96, N=30; Fig.·2). This
function adequately describes RM scaling in all of the sharks studied, irrespective of the marked differences in RM position documented in Fig.·1. The scaling coefficient in this equation is not different from 1.0 (indicating isometric RM scaling) and there is no significant difference (one-way ANOVA, P≤0.05) in the mean quantity of RM estimated for the different species, which ranges from 2.01% to 2.65% of body mass.
RM myoglobin
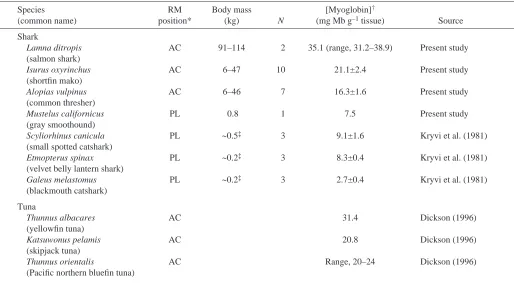
RM [Mb] data for seven shark species are shown in Table·2. Similarities between the Kryvi et al. (1981) [Mb] values
reported for the velvet belly lantern shark (Etmopterus spinax; family Dalatiidae), small spotted catshark (Scyliorhinus canicula; family Scyliorhinidae) and blackmouth catshark (Galeus melanopterus; family Scyliorhinidae) and our estimates for a single gray smoothhound (7.5·mg·Mb·g–1·tissue) validate our HPLC [Mb] methodology.
On the other hand, our RM [Mb] values for the salmon shark (mean, 35·mg·Mb·g–1·tissue; range 31–39·mg·Mb·g–1·tissue),
shortfin mako shark (mean ±S.E.M., 21±2.4·mg·Mb·g–1·tissue)
and common thresher shark (16.3±1.6·mg·Mb·g–1·tissue) range
from 3× to 12× higher than values reported by Kryvi et al. (1981) for sharks in Table·2 and are among the highest reported to date for any fish species (Dickson, 1996). The slopes of the scaling equations determined for both the mako and common thresher shark [Mb] per g RM tissue do not change with body mass (i.e. slopes are not significantly different from zero).
RM vascularization and ultrastructure
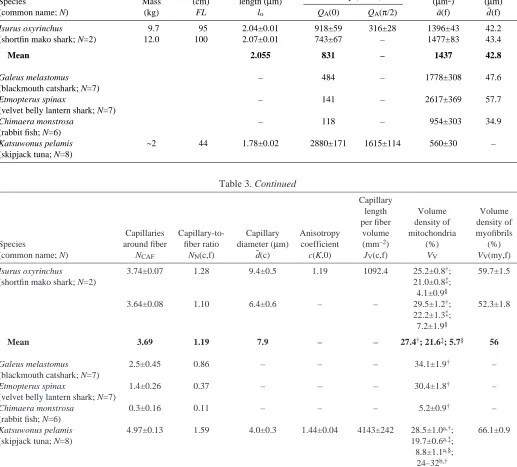
Mako RM vascularization and ultrastructure details are shown in Figs·3,·4. Table·3 provides additional morphometric data (based on a mean lo of 2.06·µm) for mako RM and
comparative data for other species. We found little variation in the RM ultrastructure and vascularization of the two relatively small (9.7–12·kg) makos studied. We did, however, note some collapsed capillaries and a few remaining erythrocytes (Fig.·3B,C) in some of the RM transverse blocks, which
1 2 5 10 20 50 100 200
Red muscle mass (kg)
Body mass (kg)
TRMM =0.018
M1.05± 0.08
0.01 0.1 1 10
5
2
0.2 0.5
0.02 0.05
suggests an incomplete in vivo perfusion fixation and thus an underestimation of QA(0), QA(π/2) and NCAF.
Longitudinal and transverse RM fiber sections (Fig.·3A–C) detail capillary distributions and suggest the presence of capillary manifolds. Mako RM capillary density [QA(0)=743–918·mm–2] appears to be the highest measured to
date for any shark, ranging from 1.7× to 5.9× higher than in the other species (i.e. the blackmouth catshark and velvet belly lantern shark) and is also 7× higher than in the Chimaera monstrosa (rabbit fish) (Table·3). Relative to the other sharks, RM NCAF is significantly higher in both the shortfin mako
shark and blackmouth catshark, which are not significantly different from each other. The capillary-to-fiber ratio [NN(c,f)]
is 1.4–10.8×greater in mako RM relative to other sharks and the rabbit fish (Table·3). Mako shark RM fiber cross-sectional area [a¯(f); 1437·µm2] is not statistically different from the
values for the blackmouth catshark and rabbit fish but is smaller than in the velvet belly lantern shark (Table·3). An electron micrograph of mako RM (Fig.·4) shows the relationship between myofibrils, subsarcolemmal and intrafibrillar mitochondria and other cellular structures. The total volume density of mitochondria [VV(mt,f)] in mako RM
(mean, 27.4%) is in the range of values given for the RM of other sharks (30.4–34.1%) and tunas (28.5%) (Table·3).
Discussion
Our findings support the hypothesis that the lamnid shark–tuna evolutionary convergence for high-performance swimming extends to similarities in RM position and in features augmenting RM aerobic capacity.
RM distribution and scaling Biomechanical implications of RM position
Aerobically functioning RM powers the sustained swimming of most fishes. In the majority of sharks and bony fishes, RM occurs mainly in the posterior half of the body along the lateral midline, directly under the skin (Greer-Walker and Pull, 1975; Bone, 1978a; Fig.·1). RM in this position is linked mechanically to the skin as well as to the adjacent myotomal white muscle (WM). Force transmission from the RM to the caudal fin therefore occurs via the skin and also involves the local bending of body segments remote from the caudal fin (i.e. the bending waves seen in most fish swimming modes, including the anguilliform swimming of sharks; Lindsey, 1978; Sfakiotakis et al., 1999).
[image:7.612.51.565.84.367.2]In occurring both more anterior in the body and more central (i.e. nearer the vertebral column; Fig.·1), the lamnid RM distribution (and that of the common thresher shark) is different from that of most sharks and similar to that of tunas (Graham et al., 1983; Carey et al., 1985; Bernal et al., 2001a). Table 2. Myoglobin concentrations in the red muscle (RM)
Species RM Body mass [Myoglobin]†
(common name) position* (kg) N (mg·Mb·g–1·tissue) Source Shark
Lamna ditropis AC 91–114 2 35.1 (range, 31.2–38.9) Present study (salmon shark)
Isurus oxyrinchus AC 6–47 10 21.1±2.4 Present study
(shortfin mako)
Alopias vulpinus AC 6–46 7 16.3±1.6 Present study
(common thresher)
Mustelus californicus PL 0.8 1 7.5 Present study
(gray smoothound)
Scyliorhinus canicula PL ~0.5‡ 3 9.1±1.6 Kryvi et al. (1981)
(small spotted catshark)
Etmopterus spinax PL ~0.2‡ 3 8.3±0.4 Kryvi et al. (1981)
(velvet belly lantern shark)
Galeus melastomus PL ~0.2‡ 3 2.7±0.4 Kryvi et al. (1981)
(blackmouth catshark) Tuna
Thunnus albacares AC 31.4 Dickson (1996)
(yellowfin tuna)
Katsuwonus pelamis AC 20.8 Dickson (1996)
(skipjack tuna)
Thunnus orientalis AC Range, 20–24 Dickson (1996)
(Pacific northern bluefin tuna)
*Red muscle position: anterior and central (AC) or posterior and lateral (PL). †Except where indicated, values represent means ±S.E.M.
Also, and in contrast to most sharks, lamnid RM is neither connected to the adjacent WM or the skin. Rather, it extends, via connective myocomata, directly into the thick skin of the caudal keel (Reif and Weishampel, 1986; fig. 5 in Bernal et al., 2001a). Force from the RM is thus transmitted directly to the
caudal fin and does not impose strain on either the surrounding WM or the adjacent skin.
Similarities in lamnid and tuna RM position have been postulated to reflect convergence in both body shape and the development of a more rigid swimming mode. With respect to body shape, an anterior shift in RM position reduces posterior-body height, thereby increasing both posterior-posterior-body taper and streamlining (Graham and Dickson, 2000). Biomechanical studies of skipjack tuna (Katsuwonus pelamis) and yellowfin tuna (Thunnus albacares) (Shadwick et al., 1999; Katz et al., 2001; Katz, 2002) and work in progress with the mako shark (J. Donley and R. Shadwick, personal communication) indicate that the anterior and central RM position imparts a mechanical benefit during sustained swimming. This benefit, the reduction of hydrodynamic drag through a lessening of the extent of lateral displacement of more anterior body segments during force production, is derived from the decoupling of RM contraction from local body bending (this would occur if RM fibers were connected to either the adjacent WM or skin). In other words, with a direct link between the remotely positioned RM and the caudal fin, both tunas and lamnids swim with more rigid bodies,
B
c c
f f f
C
c c
c
f f
f f
f
f
f f
f f
f
A
30 µm c
c f
f
30 µm
30 µm
Fig.·3. Light micrographs (400× magnification) of mako shark (9.7·kg, 95·cm fork length) red muscle (RM) in longitudinal (A,B) and transverse (C) orientations. The oval in frame A encloses a putative capillary manifold. Some capillaries (c) and fiber bundles (f) are labeled for clarity, and arrows point to some remaining erythrocytes within the capillary lumen.
Fig.·4. Electron micrograph (9208×magnification) of a mako shark (9.7·kg, 95·cm fork length) red muscle (RM) transverse section. Abbreviations: s, subsarcolemma; mf, myofibrils; im, interfibrillar mitochondria; sm, subsarcolemmal mitochondria.
im
sm sm mf
s
which reduces induced drag (Shadwick et al., 1999; Altringham and Shadwick, 2001; Bernal et al., 2001a; Katz, 2002). RM position and endothermy
In addition to its biomechanical importance, the central and
[image:9.612.50.572.163.353.2]anterior RM position of tunas and lamnids is closely linked to another unique feature shared by these groups, the capacity to maintain elevated temperatures in RM and other tissues (regional endothermy; Carey et al., 1971; Bernal et al., 2001a,b). Endothermy increases total aerobic metabolic
Table 3. Red muscle (RM) vascularization and ultrastructure in sharks and tuna
Muscle fiber
Fork length Sarcomere Capillary numerical Area Diameter*
Species Mass (cm) length (µm) density (mm–2) (µm2) (µm)
(common name; N) (kg) FL lo QA(0) QA(π/2) a¯(f) d¯(f)
Isurus oxyrinchus 9.7 95 2.04±0.01 918±59 316±28 1396±43 42.2
(shortfin mako shark; N=2) 12.0 100 2.07±0.01 743±67 – 1477±83 43.4
Mean 2.055 831 – 1437 42.8
Galeus melastomus – 484 – 1778±308 47.6
(blackmouth catshark; N=7)
Etmopterus spinax – 141 – 2617±369 57.7
(velvet belly lantern shark; N=7)
Chimaera monstrosa – 118 – 954±303 34.9
(rabbit fish; N=6)
Katsuwonus pelamis ~2 44 1.78±0.02 2880±171 1615±114 560±30 –
(skipjack tuna; N=8)
Table 3. Continued
Capillary
length Volume Volume per fiber density of density of Capillaries Capillary-to- Capillary Anisotropy volume mitochondria myofibrils Species around fiber fiber ratio diameter (µm) coefficient (mm–2) (%) (%) (common name; N) NCAF NN(c,f) d¯ (c) c(K,0) JV(c,f) VV VV(my,f) Isurus oxyrinchus 3.74±0.07 1.28 9.4±0.5 1.19 1092.4 25.2±0.8†; 59.7±1.5
(shortfin mako shark; N=2) 21.0±0.8‡;
4.1±0.9§
3.64±0.08 1.10 6.4±0.6 – – 29.5±1.2†; 52.3±1.8
22.2±1.3‡; 7.2±1.9§
Mean 3.69 1.19 7.9 – – 27.4†; 21.6‡; 5.7§ 56
Galeus melastomus 2.5±0.45 0.86 – – – 34.1±1.9† –
(blackmouth catshark; N=7)
Etmopterus spinax 1.4±0.26 0.37 – – – 30.4±1.8† –
(velvet belly lantern shark; N=7)
Chimaera monstrosa 0.3±0.16 0.11 – – – 5.2±0.9† –
(rabbit fish; N=6)
Katsuwonus pelamis 4.97±0.13 1.59 4.0±0.3 1.44±0.04 4143±242 28.5±1.0a,†; 66.1±0.9
(skipjack tuna; N=8) 19.7±0.6a,‡;
8.8±1.1a,§; 24–32b,†
All values are means ±S.E.M.
Abbreviations: FL, fork length; QA(0), transverse orientation; QA(π/2), longitudinal orientation. Data for G. melastomus, E. spinax and C. monstrosa from Totland et al. (1981).
Data for K. pelamis from aMathieu-Costello et al. (1992) and bMoyes et al. (1992).
*Fiber diameter estimated by 2[(a¯(f)/π)0.5]; †values given are VV(mt,f) (total mitochondria); ‡values given are VV(mi,f) (interfibrillar mitochondria); §values given are V
[image:9.612.51.568.192.659.2]biochemical capacity (see Bernal et al., 2003) and power output of tunas and lamnids and has also contributed to the adaptive radiation of both groups (Carey and Teal, 1966; Johnston and Brill, 1984; Dickson, 1995, 1996; Brill, 1996; Altringham and Block, 1997; Graham and Dickson, 2001). The functional basis of endothermy in both groups is the capacity of the RM vascular supply to conserve, by counter-current heat exchange, metabolic heat generated by the continuous action of the highly oxidative RM (Carey and Teal, 1966, 1969a,b; Carey et al., 1971, 1985; Anderson and Goldman, 2001; Bernal et al., 2001a,b). Although the Alopiidae resemble lamnids in having a central and anterior RM position (Fig.·1) that is served by a lateral circulation and a small putative heat exchanger (Bone and Chubb, 1983; Block and Finnerty, 1994; D. Bernal, C. Sepulveda and K. Dickson, personal observations), there are no published descriptions conclusively documenting RM endothermy in the thresher sharks (Carey et al., 1971). Interspecific differences in RM position
Although we found the RM position of the two lamnids and the common thresher shark to be generally similar to that of tunas, there are noteworthy specific differences among the sharks (Fig.·1). In makos, RM ends at the caudal peduncle (approximately 90% FL). In the salmon shark, RM ends well in advance of the peduncle (approximately 61% FL) and, in the thresher, RM reaches far into the caudal fin’s upper lobe (140% FL).
How might these various RM positions relate to the locomotion and biology of the different species? Assuming the RM–caudal fin linkage of the salmon shark is similar to that of the mako, a shorter RM section requires a longer force-transmitting connection between RM and the caudal fin. This would in turn imply a more rigid (less undulatory) swimming mode for the salmon shark relative to the mako. By this standard, extension of RM well into the upper caudal lobe of the common thresher’s caudal fin implies greater tail flexibility (i.e. both maneuverability and mobility), which is consistent with the tail’s importance in feeding (Gubanov, 1972). During feeding, we have observed the long caudal lobe of threshers being used to herd small schooling fishes (e.g. sardines and anchovies) into a tight group and then ‘clubbing’ and stunning the prey prior to feeding. Also, many of the thresher sharks we captured for this study were hooked by the upper lobe of the caudal tail, a capture scenario also reported by Gruber and Compagno (1981).
Comparative aspects of RM scaling
Findings for sharks in this study indicate TRMM values of 2–3% of total body mass with no interspecific differences (Table·1). Thus, neither RM position nor presumed differences (based on morphology and behavior) in high-performance swimming capacity (i.e. lamnids vs less mobile forms) correlate with TRMM.
This contrasts with what is known for tunas, in which TRMM ranges from 4% to 13% of total body mass (Graham et al., 1983). While the relative amount of RM in some tuna
species is higher than in any other fish species (e.g. black skipjack tuna Euthynnus lineatus 11%; frigate tuna Auxis thazard 13%), the TRMM of most tunas is similar to values for other fishes (Graham et al., 1983; Graham and Dickson, 2000, 2001). Furthermore, comparisons within the family Scombridae show that the scaling coefficient for tuna RM is less than or equal to 1.0, while the RM scaling coefficient for non-tunas is significantly greater than 1.0 (Graham et al., 1983; Goolish, 1989). Thus, while tuna TRMM is directly proportional to body size, or even declines with size in some tuna species, TRMM in non-tuna scombrids increases at a disproportionately greater rate than body size.
The RM scaling coefficient determined for lamnids in this study is not different from that of non-lamnids, and the combined scaling equation for all sharks examined has a slope of 1. As reviewed by Webb (1978) and Videler (1993), drag on a swimming fish is determined mainly by velocity and wetted surface area. Considering that the wetted surface area of the shark (i.e. the skin) scales with total body surface area, the principal effect of body growth on swimming power requirements are cruising speed (usually a function of FL) and surface area (M0.67). Therefore, the most conservative
interpretation to make of an RM scaling coefficient of M1 is
that, over the size range of makos examined, mass-proportional increases in TRMM would be more than adequate to power cruise swimming. However, we do not know how RM scaling or the scaling of several morphological features (e.g. body cross-sectional area, paired-fin lift area, caudal fin area) affecting drag, lift or the minimum sustainable velocity (i.e. the minimum velocity required for hydrostatic equilibrium and for ram gill ventilation) might vary across the entire size range of the mako [maximum total length, 400·cm (Compagno, 1998); 2001 International Game Fish Association recorded maximum mass, 554·kg] or that of other species we studied. We therefore cannot rule out the possibility of a change in RM scaling in larger makos or other lamnids. Carey et al. (1985), for example, reported a TRMM of approximately 3% of body mass for a small (approximately 200·kg) white shark (Carcharodon carcharias) but a TRMM of 6% of body mass in a much larger (1256·kg) specimen (Table·1). [Carey et al. (1985) expressed their TRMM data as a percentage of total axial muscle mass, which is here converted to percent total body mass.]
Oxygen delivery to RM
Animals having a high aerobic scope usually also possess cardiorespiratory adaptations favoring high O2delivery to the
working tissues. Compared with other fishes, tunas have both a high metabolic rate and a high O2transport capacity (Lowe
et al., 2000; Brill and Bushnell, 2001; Korsmeyer and Dewar, 2001). Tuna RM is also relatively specialized for a high O2
flux rate, having small diameter RM fibers with a high [Mb] and a rich supply of capillaries characterized by structural modifications (e.g. manifolds) that optimize O2 transfer by
maximizing the fiber–capillary contact area and extending red cell residence time (Mathieu-Costello et al., 1992, 1995, 1996; Dickson, 1996).
The mako shark also has numerous morphological and physiological attributes consistent with a high rate of O2
delivery to its tissues (Bernal et al., 2001a), and initial studies indicate a high metabolic rate and high tissue aerobic capacity compared with other sharks (Graham et al., 1990; Dickson et al., 1993). Our study of the mako has also confirmed specializations related to a greater RM O2flux.
RM [Mb]
Myoglobin facilitates the diffusion of O2from a capillary to
its site of utilization within the mitochondria; a larger [Mb] is thus indicative of a greater potential for O2flux (Wittenberg,
1970; Sidell, 1998; Suzuki and Imai, 1998). The finding of a high RM [Mb] in the mako, salmon and thresher sharks indicates that RM in all three species is poised for elevated O2
transfer. Moreover, the RM [Mb] of these sharks is much higher than reported for other sharks (Table·2) and exceeds values reported for most other fishes except tunas (Dickson, 1996; Table·2). Our data do not show a significant scaling for RM [Mb] in either the mako or thresher sharks (Table·2) and we therefore have no new insight concerning the postulated role of intracellular [Mb] in compensating for size-related changes in blood circulation time (reviewed in Kayar et al., 1994; Goolish, 1995).
RM ultrastructure
RM ultrastructure was examined in only two relatively small (9.7–12·kg) mako sharks. Even though there was little difference between these sharks, our data are not adequate to fully describe mako RM ultrastructural properties or to make definitive comparisons with other species. The finding of collapsed capillaries and remaining erythrocytes in some of the RM transverse blocks moreover indicates an incomplete in vivo perfusion-fixation in some cases, meaning that QA(0), QA(π/2)
and NCAF were probably underestimated. Nevertheless,
because this is the first ultrastructure information reported for a lamnid shark, a general comparison of mako RM with that of other species is warranted. Only limited comparisons are possible because of the paucity of comparative information and because important details such as specimen body mass and the sarcomere length (lo) at which fiber data were obtained are
usually not reported. It is critically important to indicate lo
because the state of muscle contraction affects both fiber cross-sectional area and fiber diameter estimates (Mathieu-Costello and Hepple, 2002).
Mako RM fiber cross-sectional areas (at lo=2.06·µm) are
similar to those reported for other sharks (Table·3). However, mako RM capillary density [QA(0)=831·mm–2] and
capillary-to-fiber ratio [NN(c,f)=1.19], which are the highest measured
for any shark species (Table·3), do indicate a greater O2
diffusion capacity. Also, the mako RM capillary orientation coefficient [c(K,0)=1.19] indicates a 19% increase in capillary length of contact per volume of muscle fiber [JV(c,f)=1092·mm–2] than would occur if the capillaries were
straight and unbranched (Mathieu-Costello et al., 1992). While our data for mako RM ultrastructure identify features related to an increased O2 flux capacity relative to other sharks,
Table·3 indicates that these vascular specializations are much less extensive than those in tunas.
Mathieu-Costello et al. (1992) reported the presence of capillary manifolds in tuna locomotor muscle and suggested that these facilitated O2 diffusion by increasing the
capillary–fiber contact area. Capillary manifolds, which are most frequently found at the venular end of the vessel bed, also occur in the locomotor muscle of active birds (Mathieu-Costello et al., 1992). Birds and most fishes are similar in having nucleated erythrocytes and, because these are both larger and less deformable that non-nucleated erythrocytes, a possible role for capillary manifolds in enhancing red cell flow was suggested (Mathieu-Costello et al., 1992).
In view of the proposed role of manifolds in augmenting circulation, we expected to find large numbers of these structures in mako RM. In addition, with shark erythrocyte diameters averaging about 4× higher than those of tunas (Emery, 1986; Bernal et al., 2001a) and because our study (Table·3) indicates that mako RM capillary diameter is about 2× larger than in tunas, we predicted that mako manifolds would be larger.
Capillary manifolds were neither obvious nor abundant in mako RM. Fig.·3A shows what appears to be a capillary manifold in a longitudinal RM section, but this structure is much smaller than tuna manifolds (Mathieu-Costello et al., 1992), which is inconsistent with the supposed function of facilitating the flow of larger, less compliant red cells. However, we studied a limited number of longitudinal RM sections from which manifolds could be documented, and additional studies are needed to verify the presence of manifolds in makos and to search for them in larger specimens, other lamnids and other active sharks. It could be that differences between tunas and makos insofar as manifolds are concerned reflect differences in absolute RM O2 demand; while the metabolic rate of a
swimming mako is higher than that of other sharks, it is about 4×less than that of a tuna (Graham et al., 1990; Bernal et al., 2001a; Korsmeyer and Dewar, 2001).
regarded as indicating the maximum amount of non-contractile elements that can be contained within the myofibril without affecting muscle contractility (Block, 1991; Ballantyne, 1995). In summary, lamnid–tuna evolutionary convergence in specializations for high-performance swimming extends to similarities in RM position but not in RM amount, which for tunas is larger, more variable and scales negatively with body mass in some species. All sharks in this study had 2–3% TRMM and, irrespective of RM position, had an RM scaling coefficient of 1. Similarities in tuna and lamnid RM position have a basis in similar swimming biomechanics and may also relate to the presence of regional endothermy. The common thresher shark has an RM distribution similar to that of the mako. Tuna and lamnid RM is similar in having specializations enhancing O2delivery to the mitochondria, including a high
[Mb], large capillary-to-fiber ratios and structural modifications increasing capillary–fiber contact, and both groups have similar myofibrillar mitochondrial densities. Tuna RM, however, appears to have a greater degree of ‘specializations for O2delivery’, as evidenced, for example, by
higher capillary density, a more extensive capillary manifold system and higher capillary tortuosity. Nonetheless, relative to other sharks, lamnids have many of the adaptations that may allow for a higher O2flux to the RM, which can potentially
increase the aerobic capacity of this tissue. Additional studies comparing the RM morphology, vascularization and ultrastructure of other actively swimming ectothermic sharks are needed to understand the degree of lamnid RM morphological specializations that support their categorization as high-performance swimmers.
List of symbols a¯(f) mean fiber cross-sectional area c(K,0) capillary orientation coefficient d¯(c) mean capillary diameter d¯(f) mean fiber diameter
JV(c,f) total capillary length per volume of muscle fiber
K capillary anisotropy concentration parameter lo sarcomere length
NCAF number of capillaries surrounding each
muscle fiber NN(c,f) capillary-to-fiber ratio
QA(0) capillary density per mm2transverse sectional
area of muscle fiber
QA(π/2) capillary density per mm2longitudinal sectional
area of muscle fiber
VV(mt,f) total volume density of mitochondria
We are grateful to Drs K. Dickson, N. Holland, R. Rosenblatt and R. Shadwick for critically reviewing early drafts of this manuscript. We also thank two anonymous reviewers for their suggestions. This study could not have been possible without the help for specimen collection by the captain and crew of the Research Vessels David Starr Jordan, Gordon Sproul, Mako, Yellowfin and Splunky I, the Fishing
Vessels Legend, Sharktagger and Korean Limits and the logistical support of the kind people at Chesapeake Fish Co., Sal Randazzo, Sal Mejia and Nick Vitalich, Jr, and Kent Williams of New FishHall Bait Company. We are indebted to C. Brown, E. Banes, G. Bergsma, G. Bernal, C. Brown, C. Hayleman, R. Hodges, J. Isaacs, A. Jarette, G. Lo, S. Maistro, S. Miller, C. Parinello, B. Simmons and S. Wagner for assistance with the data collection on muscle morphology. Special thanks are due to H. Lee, N. Carter, C. Chan, J. Donley, H. Dowis, S. Kanatous, C. Li, M. Trejo-Morales and J. Yan for invaluable help in data collection and analysis and to J. Valdez for logistical assistance. Support for D.B. was through the U.C. San Diego Fellowship and an NSF Graduate Fellowship. C.S. was supported by the Scripps Institution of Oceanography (SIO Directors Office and the Birch Aquarium at SIO). This work was partially supported by NSF IBN 9607699, NSF IBN 0077502 and by the University of California San Diego Academic Senate.
References
Allen, G. R. (1997). Marine Fishes of the Great Barrier Reef and South-East Asia. Perth: Western Australia Museum.
Altringham, J. D. and Block, B. A. (1997). Why do tuna maintain elevated slow muscle temperatures? Power output of muscle isolated from endothermic and ectothermic fish. J. Exp. Biol. 200, 2617-2627.
Altringham, J. D. and Shadwick, R. E. (2001). Swimming and muscle function. In Fish Physiology, vol. XIX (ed. B. A. Block and E. D. Stevens), pp. 313-344. San Diego: Academic Press.
Anderson, S. A. and Goldman, K. J. (2001). Temperature measurements from salmon sharks, Lamna ditropis, in Alaskan waters. Copeia 2001, 794-796.
Ballantyne, J. S. (1995). Metabolic organization of thermogenic tissues of fishes. In Biochemistry and Molecular Biology of Fishes, vol. 4 (ed. P. W. Hochachka and T. Mommsen), pp. 241-257. Amsterdam: Elsevier Science. Bernal, D., Dickson, K. A., Shadwick, R. E. and Graham, J. B. (2001a). Analysis of the evolutionary convergence for high performance swimming in lamnid sharks and tunas. Comp. Biochem. Physiol. 129A, 695-726. Bernal, D., Sepulveda, C. and Graham, J. B. (2001b). Water-tunnel studies
of heat balance in swimming mako sharks. J. Exp. Biol. 204, 4043-4054. Bernal, D., Smith, D., Lopez, G., Weitz, D., Grimminger, T., A., D. K. and
Graham, J. B. (2003). Comparative studies of high performance swimming in sharks. II. Metabolic biochemistry of locomotor and myocardial muscle in endothermic and ectothermic sharks. J. Exp. Biol. 206, 2845-2857. Block, B. A. (1991). Evolutionary novelties: how fish have built a heater out
of muscle. Am. Zool. 31, 726-742.
Block, B. A. and Finnerty, J. R. (1994). Endothermy in fishes: a phylogenetic analysis of constraints, predispositions, and selection pressures. Env. Biol. Fish. 40, 283-302.
Bone, Q. (1978a). Locomotor muscle. In Fish Physiology, vol. VII (ed. W. S. Hoar and D. J. Randall), pp. 361-417. New York: Academic Press. Bone, Q. (1978b). Myotomal muscle fiber types in Scomber and Katsuwonus.
In The Physiological Ecology of Tunas (ed. G. D. Sharp and A. E. Dizon), pp. 183-205. New York: Academic Press.
Bone, Q. and Chubb, A. D. (1983). The retial system of the locomotor muscle in the thresher shark. J. Mar. Biol. Assoc. UK 63, 239-241.
Brill, R. W. (1996). Selective advantages conferred by the high performance physiology of tunas, billfishes, and dolphin fish. Comp. Biochem. Physiol. A 113, 3-15.
Brill, R. W. and Bushnell, P. G. (2001). The cardiovascular system of tunas. In Fish Physiology, vol. XIX (ed. B. A. Block and E. D. Stevens), pp. 79-120. San Diego: Academic Press.
Carey, F. G., Casey, J. G., Pratt, H. L., Urquhart, D. and McCosker, J. E. (1985). Temperature, heat production and heat exchange in lamnid sharks. Mem. Southern Calif. Acad. Sci. 9, 92-108.
Carey, F. G. and Teal, J. M. (1969a). Mako and porbeagle: warm bodied sharks. Comp. Biochem. Physiol. 28, 199-204.
Carey, F. G. and Teal, J. M. (1969b). Regulation of body temperature by the bluefin tuna. Comp. Biochem. Physiol. 28, 205-213.
Carey, F. G., Teal, J. M., Kanwisher, J. W. and Lawson, K. D. (1971). Warm bodied fish. Am. Zool. 11, 135-145.
Compagno, L. J. V. (1998). Lamnidae. Mackerel sharks, makos, white sharks, porbeagles. In FAO Identification Guide For Fishery Purposes. The Living Marine Resources of the Western Central Pacific (ed. K. E. Carpenter and V. H. Niem), pp. 1274-1278. Rome: FAO.
Dickson, K. A. (1995). Unique adaptations of the metabolic biochemistry of tunas and billfishes for life in the pelagic environment. Env. Biol. Fish. 42, 65-97.
Dickson, K. A. (1996). Locomotor muscle of high performance fishes: what do comparisons of tunas with other ectothermic taxa reveal? Comp. Biochem. Physiol. A 113, 39-49.
Dickson, K. A., Gregorio, M. O., Gruber, S. J., Loefler, K. L., Tran, M. and Terrel, C. (1993). Biochemical indices of aerobic and anaerobic capacity in muscle tissues of California elasmobranch fishes differing in typical activity level. Mar. Biol. 117, 185-193.
Emery, S. H. (1986). Hematological comparisons of endothermic vs ectothermic elasmobranch fishes. Copeia 1986, 700-705.
Froese, R. and Pauly, D. (ed.) (2002). FishBase. World Wide Web electronic publication. www.fishbase.org.
Goodson, G. (1988). Fishes of the Pacific Coast. Alaska to Peru, including the Gulf of California and the Galapagos Islands. Stanford, Stanford University Press.
Goolish, E. M. (1989). The scaling of aerobic and anaerobic muscle power in rainbow trout, Salmo gairdneri. J. Exp. Biol. 147, 493-505.
Goolish, E. M. (1995). The metabolic consequences of body size. In Biochemistry and Molecular Biology of Fishes, vol. IV (ed. P. W. Hochachka and T. Mommsen), pp. 335-366. Amsterdam: Elsevier Science. Graham, J. B., Dewar, H., Lai, N. C., Lowell, W. R. and Arce, S. M. (1990). Aspects of shark swimming performance determined using a large water tunnel. J. Exp. Biol. 151, 175-192.
Graham, J. B. and Dickson, K. A. (2000). The evolution of thunniform locomotion and heat conservation in scombrid fishes: new insights based on the morphology of Allothunnus fallai. Zool. J. Linn. Soc. Lond. 129, 419-466.
Graham, J. B. and Dickson, K. A. (2001). Anatomical and physiological specializations for endothermy. In Fish Physiology, vol. XIX (ed. B. A. Block and E. D. Stevens), pp. 121-165. San Diego: Academic Press. Graham, J. B., Koehrn, F. J. and Dickson, K. A. (1983). Distribution and
relative proportions of red muscle in scombrid fishes: consequences of body size and relationships to locomotion and endothermy. Can. J. Zool. 61, 2087-2096.
Greer-Walker, M. and Pull, G. (1975). A survey of red and white muscle in marine fish. J. Fish. Biol. 7, 295-300.
Gruber, S. H. and Compagno, L. J. V. (1981). Taxonomic status and biology of the bigeye thresher, Alopias superciliosus (Lowe, 1839). Fish. Bull. US Nat. Mar. Fish. Serv. 79, 617-640.
Gubanov, Y. P. (1972). On the biology of the thresher shark (Alopias vulpinus, Bonaterre) in the northwest Indian Ocean. J. Ichthyol. 12, 591-600.
Johnston, I. A. and Brill, R. W. (1984). Thermal dependence of contractile properties of single skinned muscle fibers from Antarctic and various warm water marine fishes including skipjack tuna (Katsuwonus pelamis) and kawakawa (Euthynnus affinis). J. Comp. Physiol. B 155, 63-70.
Katz, S. L. (2002). Design of heterothermic muscle in fish. J. Exp. Biol. 205, 2251-2266.
Katz, S. L., Syme, D. A. and Shadwick, R. E. (2001). High-speed swimming. Enhanced power in yellowfin tuna. Nature 410, 770-771.
Kayar, S. R., Hoppeler, H., Jones, J. H., Longworth, K., Armstrong, R. B., Laughlin, M. H., Lindstedt, S. L., Bicudo, J. E. P. W., Groebe, K. and Weibel, E. R. (1994). Capillary blood transit time in muscles in relation to body size and aerobic capacity. J. Exp. Biol. 194, 69-81.
Kohler, N. E., Casey, J. G. and Turner, P. A. (1994). Length-weight relationships for 13 species of sharks from the western North Atlantic. US Fish. Bull. 93, 412-418.
Korsmeyer, K. E. and Dewar, H. (2001). Tuna metabolism and energetics.
In Fish Physiology, vol. XIX (ed. B. A. Block and E. D. Stevens), pp. 35-78. San Diego: Academic Press.
Kryvi, H., Flatmark, T. and Totland, G. K. (1981). The myoglobin content in red, intermediate and white fibers of the swimming muscles in three species of shark – a comparative study using high-performance liquid chromatography. J. Fish. Biol. 18, 331-338.
Lai, N. C., Korsmeyer, K. E., Katz, S., Holts, D. B., Laughlin, L. M. and Graham, J. B. (1997). Hemodynamics and blood properties of the shortfin mako shark (Isurus oxyrinchus). Copeia 1997, 424-428.
Last, P. R. and Stevens, J. D. (1994) Sharks and Rays of Australia. Melbourne: CSIRO.
Lindsey, C. C. (1978). Form, function, and locomotory habits in fish. In Fish Physiology, vol. VII (ed. W. S. Hoar and D. J. Randall), pp. 1-100. New York: Academic Press.
Lowe, T. E., Brill, R. W. and Cousins, K. L. (2000). Blood oxygen-binding characteristics of bigeye tuna (Thunnus obesus), a high-energy-demand teleost that is tolerant to low ambient oxygen. Mar. Biol. 136, 1087-1098. Mathieu, O., Cruz-Orive, L. M., Hoppeler, H. and Weibel, E. R. (1983).
Estimating length density and quantifying anisotropy in skeletal muscle capillaries. J. Microsc. 131, 131-146.
Mathieu-Costello, O., Agey, P. J. and Logemann, R. B. (1992). Capillary-fiber geometrical relationships in tuna red muscle. Can. J. Zool. 70, 1218-1229.
Mathieu-Costello, O., Brill, R. W. and Hochachka, P. W. (1995). Design for a high speed path for oxygen: tuna red muscle ultrastructure and vascularization. In Biochemistry and Molecular Biology of Fishes, vol. IV (ed. P. W. Hochachka and T. Mommsen), pp. 1-13. Amsterdam: Elsevier Science.
Mathieu-Costello, O., Brill, R. W. and Hochachka, P. W. (1996). Structural basis for oxygen delivery: muscle capillaries and manifolds in tuna red muscle. Comp. Biochem. Physiol. A 113, 25-31.
Mathieu-Costello, O. and Hepple, R. T. (2002). Muscle structural capacity for oxygen flux from capillary to fiber mitochondria. Exerc. Sport Sci. Rev. 30, 80-84.
Mollet, H. F. and Cailliet, G. M. (1996). Using allometry to predict body mass from linear measurements of the white shark. In Great White Sharks: The Biology of Carcharodon carcharias (ed. A. P. Klimley and D. G. Ainley), pp. 81-90. San Diego: Academic Press.
Moyes, C. D., Mathieu-Costello, O., Brill, R. W. and Hochachka, P. W. (1992). Mitochondrial metabolism of cardiac and skeletal muscles from a fast, Katsuwonus pelamis, and slow, Cyprinus carpio, fish. Can. J. Zool. 70, 1246-1253.
Reif, W.-E. and Weishampel, D. B. (1986). Anatomy and mechanics of the lunate tail in lamnid sharks. Zool. Jb. Anat. 114, 221-234.
Sfakiotakis, M., Lane, D. M. and Davies, B. C. (1999). Review of fish swimming modes for aquatic locomotion. IEEE J. Oceanic Eng. 24, 237-252.
Shadwick, R. E., Katz, S. L., Korsmeyer, K. E., Knower, T. and Covell, J. W. (1999). Muscle dynamics in skipjack tuna: timing of red muscle shortening in relation to activation and body curvature in steady swimming. J. Exp. Biol. 202, 2139-2150.
Sidell, B. D. (1998). Intracellular oxygen diffusion: the roles of myoglobin and lipid at cold body temperature. J. Exp. Biol. 201, 1118-1127. Suzuki, T. and Imai, K. (1998). Evolution of myoglobin. Cell. Mol. Life Sci.
54, 979-1004.
Tricas, T. C., Deacon, K., Last, P., McCosker, J. E., Walker, T. I. and Taylor, L. (1997). Sharks and Rays. Sydney: Weldon Owen.
Totland, G. K., Kryvi, H., Bone, Q. and Flood, P. R. (1981). Vascularization of the lateral muscle of some elasmobranchimorph fishes. J. Fish Biol. 18, 223-234.
Videler, J. J. (1993). Fish Swimming. New York: Chapman and Hall. Webb, P. W. (1978). Hydrodyamics: nonscombroid fish. In Fish Physiology,
vol. VII (ed. W. S. Hoar and D. J. Randall), pp. 189-237. New York: Academic Press.
White, F. C., Kelly, R., Kemper, S., Schumacker, P. T., Gallagher, K. R. and Laurs, R. M. (1988). Organ blood flow, haemodynamics, and metabolism of the albacore tuna Thunnus alalunga (Bonnaterre). Exp. Biol. 47, 161-169.