1951
MS
MR Lesion Load and Cognitive Function in Patients with
Relapsing-Remitting Multiple Sclerosis
Jennifer C. Fulton, Robert I. Grossman, Jayaram Udupa, Lois J. Mannon, Murray Grossman, Luogang Wei,
Marcia Polansky, and Dennis L. Kolson
BACKGROUND AND PURPOSE: Multiple sclerosis (MS) is a demyelinating disease most
often associated with progressive physical impairment; however, its effects are noted to extend
beyond physical disability. Our purpose was to determine the relationship between T2 lesion
volume and neurocognitive and physical disability in relapsing-remitting multiple sclerosis.
METHODS: We studied a cohort of 19 patients with relapsing-remitting MS. Of this group,
there were 15 women and four men from varying socioeconomic backgrounds. This volunteer
sample was selected from a larger group of 53 patients with MS in our longitudinal MS study
because they had been untreated with any beta-interferon medications, had been followed for
at least 12 months, and had a clinical status of relapsing-remitting MS.
RESULTS: Of 12 neurocognitive parameters tested, two correlated significantly with lesion
loads. The correlation of the Symbol-Digit Modalities test, which analyzes
information-pro-cessing speed, was significant (P
5
.0204). The correlation of the fifth trial of the Rey Auditory
Verbal Learning test, which tests verbal long-term memory, was also significant (P
5
.0348).
None of the other 10 neurocognitive examinations, however, showed a significant correlation
with total lesion volume (Paced Auditory Serial Addition test-1.6, P
5
.7381; Paced Auditory
Serial Addition test-2.0, P
5
.4180; Controlled Oral Word Association test, P
5
.8906; Category
Fluency test, P
5
.4423; Bells test, P
5
.9097; Rey Auditory Verbal Learning test-delay, P
5
.9843, Rey Auditory Verbal Learning test-recognition, P
5
.7467; Word Span test, P
5
.4939;
Road Map test, P
5
0.4939). The lesion load also did not correlate with the physical disability
scales as rated according to the Expanded Disability Status Scale (P
5
.68) or Ambulation
Index (P
5
.95).
CONCLUSION: Our results indicate that T2 lesion volume does not seem to be a robust
surrogate marker of neuropsychological impairment in patients with MS. We think that global
measurements of parameters that are more specific to the disease process may offer more
precise correlation with cognitive dysfunction and other disability parameters.
Multiple Sclerosis (MS) is a demyelinating disease
most often associated with progressive physical
im-pairment; however, its effects are noted to extend
be-yond measures of physical disability. As early as
1877, it was recognized by Charcot that cognitive
deterioration often accompanied MS. Cognitive
im-Received May 26, 1998; accepted after revision, March 10, 1999.
From the Departments of Radiology (J.C.F., R.I.G., J.U., L.J.M., L.W.) and Neurology (D.L.K.), Hospital of the Uni-versity of Pennsylvania, and the Division of Biometrics (M.P.), Hahnemann University, Philadelphia, PA.
This work was supported in part by National Institutes of Health Grants NS29029, 5M01-RR00040, and 1R01-CA56071.
Address reprints requests to Robert I. Grossman, Depart-ment of Radiology, Hospital of the University of Pennsylvania, Ground Floor, Founders, 3400 Spruce Street, Philadelphia, PA 19104-4283.
qAmerican Society of Neuroradiology
Previous studies have attempted to show a
cor-relation between MR imaging and the physical
man-ifestations of MS as evaluated through the Kurtzke
Expanded Disability Status Scale (EDSS) or the
Ambulation Index (AI) (8). Nevertheless, there
seems to be little or no correlation between the
phys-ical disabilities and lesion burden as reported by MR
imaging (9
2
12). It has been suggested by Comi et
al (4) that clinical status may be better correlated
with spinal cord damage than with demyelinating
plaques in the brain. Lesions in the brain may
in-stead prove to correlate with neurocognitive
dys-function. Investigators have found a strong
connec-tion between the total surface area of MS plaques
on MR images and cognitive abilities (13, 14). Other
associations have been found between corpus
cal-losum atrophy and ventricular dilation and cognitive
dysfunction (15, 16). Nonetheless, little is known
about the relationship between total lesion volume,
as measured on proton density– and T2-weighted
images, and neurocognitive ability. Assessing lesion
burden in this manner may provide an important
correlation with global disability.
This study examined the relationship between
to-tal lesion volume, measured by a highly
reproduc-ible validated semiautomated computerized
tech-nique, and neurocognitive and physical disability in
a group of patients with untreated clinically definite
relapsing-remitting MS. The neuropsychological
tests conducted as part of this evaluation include
batteries of tasks that involve working memory,
at-tention, and information-processing speed. These
tests are particularly sensitive to cognitive
impair-ment and for predicting subsequent decline in MS.
We also administered measures of visual and verbal
anterograde memory and a small number of
addi-tional measures that have been found to be
im-paired in limited numbers of patients with MS,
such as language and visuoperceptual functioning.
As part of our analysis, we examined the lesion
volume for each patient in our cohort and their
EDSS and AI scores. We also evaluated the
neu-rocognitive tests over time. This included repeat
measurements of these tests. It must be noted that
because there was no statistical correlation of these
tests, no Bonferonni correction was indicated.
Methods
Participants
A cohort of 19 patients (15 women and four men) who were participating in a longitudinal study on the natural history of MS were included in this investigation. The study was approved by our institutional review board, and written informed consent was obtained for all participants. Each patient was diagnosed with clinically definite relapsing-remitting MS as defined by Po-ser et al (17) and had been followed up for at least 12 months; some had been followed up for up to 64 months. Patients who had been treated with beta-interferon medications were excluded from this study. The participants ranged in age from 26 to 53 years; the mean age was 36 years, with an SD of 7.59. At the time of enrollment in the study, patients underwent a complete neurologic workup, the full battery of neurocognitive
examina-tions, and a comprehensive protocol of MR imaging. The pa-tients underwent follow-up neurologic examination and MR im-aging every 6 months after their initial visits. The data used in this study were limited to those obtained from visits during which the patients underwent all three examinations (MR im-aging, neurologic examinations, and neurocognitive tests). All tests were completed within 4 weeks of each other.
Spearman correlations were calculated for each patient for each neurocognitive test and volume. The single-sample Wil-coxon test was used to determine whether the median corre-lation was significantly different from 0. The correcorre-lation be-tween volume and time from the first visit was analyzed in this same manner.
Neurocognitive Evaluation
Cognitive functions of the participants were evaluated using a battery of standardized neuropsychological examinations. All testing was conducted by three technicians, trained and super-vised by a neuropsychologist (M.G.). The testing was conducted in a quiet room with minimal visual or audible distractions. Periods of rest were provided during testing to minimize the effect of fatigue. The battery of tests can be subdivided into four categories (18). Category 1 includes executive functions and in-formation-processing speed, category 2 consists of verbal long-term memory, category 3 encompasses verbal short-long-term mem-ory, and category 4 evaluates visuospatial ability.
Category 1 (Executive Function and Information-Processing Speed).—The Paced Auditory Serial Addition test uses the
se-rial addition of pairs of consecutive numbers presented contin-uously by audio tape at a set speed (19). The patient was asked to perform this serial addition at two speeds, a 1.6- and a 2.0-second interval. The number of consecutive correct additions was used as a score.
The spontaneous production of words beginning with a giv-en letter (eg, ‘‘F,’’ ‘‘A,’’ and ‘‘S,’’) for 1 minute each (20) was tested using the Controlled Oral Word Association test. The number of correct target words that the patient produced on average in 1 minute was counted.
For the Category Fluency test, the spontaneous production of words in the ‘‘animal’’ class for 1 minute (21) was required. The number of correct target words that the patient produced in 1 minute was counted.
The Bells test involves the cancellation of target icons that are randomly distributed across a page intermixed with visu-ally similar icons (22). The patient was asked to cancel the target icons, and the number of correctly identified icons was counted.
The oral version of the Symbol-Digit Modalities test re-quires the decoding of a series of visual symbols according to a template of paired numbers (23). The patient was asked to name the numbers corresponding to the symbol during a 90-second interval.
Category 2 (Verbal Long-term Memory).—The Rey Auditory
Verbal Learning test, including delayed recall, consists of learning a list of 15 words that are orally presented. This test includes measures of learning over five learning trials, retrieval of the tar-get list after presenting a distracter list and after a 30-minute delay, and recognition of the target words from among distracter words such as semantic and phonemic foils (24). The number of words correctly recalled by the participant on the fifth learning trial, after a 30-minute delay, and the number of target hits from the rec-ognition list were all used in this analysis.
Category 3 (Verbal Short-term Memory).—The Word Span
test is the sequential recall of increasingly longer lists of one-syllable words presented at a 1-second interstimulus rate. Stim-uli are from three sets: imageable nouns from the same super-ordinate category, semantically unrelated imageable nouns, and semantically unrelated verbs. Forward and reverse mea-sures were used for analysis.
Category 4 (Visuospatial-Perceptual Processing).—Road
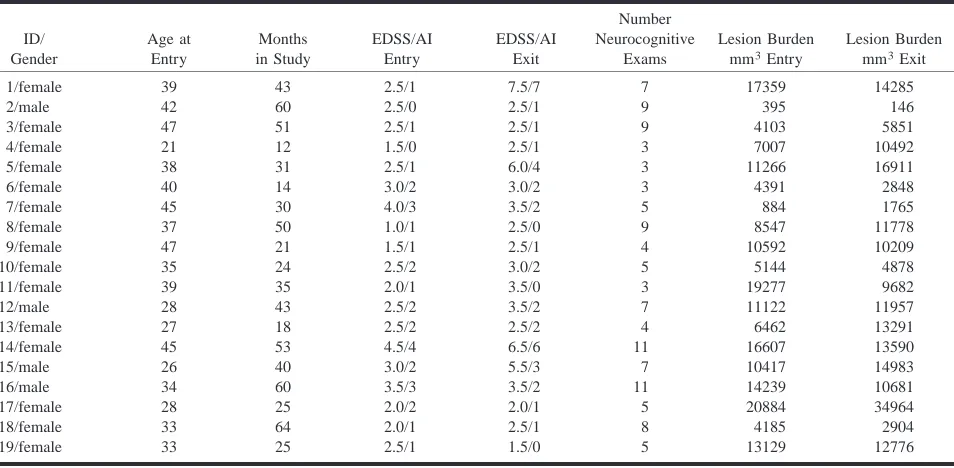
spa-TABLE 1: Individual Patient Profiles. Statistical analysis used the single-sample Wilcoxon test in order to determine positive correlations ID/ Gender Age at Entry Months in Study EDSS/AI Entry EDSS/AI Exit Number Neurocognitive Exams Lesion Burden mm3Entry
Lesion Burden mm3Exit
[image:3.612.61.538.74.308.2]1/female 2/male 3/female 4/female 5/female 6/female 7/female 8/female 9/female 39 42 47 21 38 40 45 37 47 43 60 51 12 31 14 30 50 21 2.5/1 2.5/0 2.5/1 1.5/0 2.5/1 3.0/2 4.0/3 1.0/1 1.5/1 7.5/7 2.5/1 2.5/1 2.5/1 6.0/4 3.0/2 3.5/2 2.5/0 2.5/1 7 9 9 3 3 3 5 9 4 17359 395 4103 7007 11266 4391 884 8547 10592 14285 146 5851 10492 16911 2848 1765 11778 10209 10/female 11/female 12/male 13/female 14/female 15/male 16/male 17/female 18/female 19/female 35 39 28 27 45 26 34 28 33 33 24 35 43 18 53 40 60 25 64 25 2.5/2 2.0/1 2.5/2 2.5/2 4.5/4 3.0/2 3.5/3 2.0/2 2.0/1 2.5/1 3.0/2 3.5/0 3.5/2 2.5/2 6.5/6 5.5/3 3.5/2 2.0/1 2.5/1 1.5/0 5 3 7 4 11 7 11 5 8 5 5144 19277 11122 6462 16607 10417 14239 20884 4185 13129 4878 9682 11957 13291 13590 14983 10681 34964 2904 12776
TABLE 2: Summary of clinical test results. Values represent cor-relations and significance between clinical performance versus T2 lesion volume
T2 Lesion Volume
Versus: P Value
EDSS AI
Disease Duration PASAT 1.6 PASAT 2.0
Controlled Oral Word Association Test
0.68 0.95 0.40 0.74 0.42 0.89 Category Fluency Test
Bells *Symbol-Digit Modalities 0.44 0.91 0.02 *RAVALT-5 RAVALT-delay RAVALT-recognition Word Span Road Map 0.03 0.98 0.75 0.49 0.49
* Indicates statistical significance.
tial relations. The patient was asked to describe the turns nec-essary to follow a route on a topographic map (25). The num-ber of correct responses was used for analysis.
Imaging and Volume Estimation
MR studies were obtained approximately every 6 months using a Signa 1.5-T unit with a standard General Electric quad-rature head coil. The imaging protocol consisted of 3-mm in-terleaved contiguous sections, covering the entire brain, with fast spin-echo sequences (16,60/2500 [first-echo TE, second-echo TE/TR]) with an second-echo train length of 8.
Using the theory of fuzzy connectedness (26228), an inter-nal version of the 3DVIEWNIX software system was used to detect, delineate, and quantitate lesions on the T2-/proton den-sity–weighted images. The system selected potential lesion sites automatically. A qualified user then identified authentic lesions by responding yes to a yes/no software query regarding
whether the selected region was in fact a lesion. The software program then calculated lesion volumes, taking into account all selected lesions. The inter- and intraobserver variability of this method has been shown to be low, with a 0.9% coefficient of variation for total lesion volume and a high sensitivity with a false-negative volume fraction of 1.3% (29). A single ob-server obtained all of the measurements.
Physical Evaluation
The extent of physical disability was determined by grading patients according to their EDSS and AI scores (8). These ex-aminations were performed in a nonblinded manner by a single neurologist who specializes in the treatment of patients with MS (D.K.). For the EDSS evaluation, functional systems scores are given (range, score of 026) for each of eight areas of neurologic function: pyramidal, cerebellar, brain stem, mental, sensory, bowel and bladder, visual, and other. The EDSS is then determined from the functional systems scores, in conjunction with assessment of ability to walk, with a range from 0 to 10 (05completely nor-mal, 105death as a result of MS). AI scores are evaluated based solely on the patient’s ability to walk and reliance on an aid, such as from unilateral or bilateral support or wheelchair. The scores for this test range from 0 to 9.
Results
[image:3.612.60.288.364.538.2]val-ue of .0348. None of the other 10 neurocognitive
examinations, however, which cover other tests of
ex-ecutive function, information-processing speed, and
verbal short-term memory, showed a significant
cor-relation with total lesion volume.
Furthermore, the T2 lesion volume also did not
correlate with EDSS (P
5
.68) or with AI (P
5
.95). Table 2 summarizes the correlations between
the lesion load measurements and the
neurocogni-tive as well as physical tests.
Discussion
Although it has been reported that secondary
progressive MS causes more frequent and severe
cognitive deficits than relapsing-remitting MS,
pa-tients with relapsing-remitting MS have also
re-ported a decline in cognitive function (30, 31). It
is interesting to note that our group found no
sig-nificant change in neurocognitive examination data
over the duration of the study. Additionally, our
results reveal a significant correlation between
clin-ically definite relapsing-remitting MS and
perfor-mance on only two of 12 standardized
neuropsy-chological tests. The tests reflect performance of
executive function and learning. There may be
sev-eral possible explanations for this result. The
neu-ropsychological testing may be relatively
insensi-tive, T2 lesion volume is nonspecific with a
spectrum of pathologic abnormalities appearing
similar (high signal on T2-weighted images), and
lesion location, which we did not assess, may be
important. Some or all of these variables may act
together to influence cognitive disability.
MS lesions are heterogeneous
histopathological-ly, consisting of areas with gliosis, demyelination,
remyelination, edema, and neuronal loss. The
re-lationship between high-intensity abnormalities on
MR images and the pathologic substrate is not fully
understood. Several recent publications, however,
have suggested that T2-weighted images are not
adequately sensitive to predict the pathologic basis
of hyperintense lesions (32
2
34). More sensitive
imaging techniques, including MR spectroscopy,
magnetization transfer, and T1-weighted
hypoin-tensity measurements may produce more robust
correlations with neurocognitive data and other
dis-ability measurements (35, 36).
The ultimate effect of white matter disease on
the neuron is still in question. Using MR
spectros-copy, it is possible to observe a decrease in the
ratio of N-acetylaspartate to creatine with severe
acute or chronic demyelination. In their 1994 study,
Arnold et al (33) found statistically significant
changes in N-acetylaspartate:creatine ratios without
statistically significant changes in total MR
imag-ing lesion volume. This indicates that MR
spec-troscopy may be a more sensitive index of disease
progression and may yield more significant
corre-lations than does MR imaging. Furthermore,
nor-mal-appearing white matter on T2-weighted images
may contain microscopic changes that are
signifi-cant in terms of brain function. Narayanan et al
(34) compared average metabolite levels and
T2-weighted images, noting that diffuse axonal volume
loss or dysfunction extends beyond areas of
inflam-mation and could be caused by microscopic disease
or wallerian degeneration. T1 and T2 relaxation
times in normal-appearing white matter were
re-ported to be significantly abnormal in patients with
MS compared with those normal participants
(37
2
39). Other studies using
magnetization-trans-fer imaging have also revealed abnormalities in
normal-appearing white matter (40, 41).
Lesions that appear similar on T2-weighted
im-ages may have profoundly different effects on
neu-ronal function and neurologic performance. Comi
et al (11) believe that cognitive dysfunction seems
to be determined by the disruption of neuronal
con-nections in the cortical associative areas and those
areas between the cortical and subcortical
struc-tures. This interference seems to be induced by
de-myelination and axonal degeneration. Thus, lesions
that are similarly hyperintense on T2-weighted
im-ages can have variable histopathologic substrates
and potentially very different effects on cognitive
performance.
(31). We think that more specific global
measure-ments of disease may offer more precise correlation
with cognitive dysfunction and other disability
parameters.
Conclusion
Our results indicate that T2 lesion volume does
not seem to be a robust surrogate marker of
neu-ropsychological impairment in patients with MS.
We think that global measurements of parameters
that are more specific to the disease process may
offer more precise correlation with cognitive
dys-function and other disability parameters.
References
1. Rao SM, Leo GJ, Bernardin L, Unverzagt F. Cognitive dysfunc-tion in multiple sclerosis. I. Frequency, patterns, and predic-tion. Neurology 1991;41:685–691
2. Peyser JM, Edward KR, Poser CM. Psychological profiles in pa-tients with multiple sclerosis. A preliminary investigation. Arch
Neurol 1980;37:437–440
3. Prosiegel M, Michael C. Neuropsychology and multiple scle-rosis. Diagnostic and rehabilitative approaches. J Neurol Sci 1993
4. Comi G, Filippi M, Martinelli V, et al. Brain MRI correlates of cognitive impairment in primary and secondary progressive multiple sclerosis. J Neurol Sci 1995;132:222–227
5. Foong J, Rozewicz L, Quaghebeur G, et al. Executive function in multiple sclerosis. The role of frontal lobe pathology. Brain 1997;120:15–26
6. Amato M, Ponziani P, Pracucci G, et al. Cognitive performance in patients with early-onset MS. A 4-year follow-up. Confer-ence on Neurobehavioral Disorders in Multiple Sclerosis: Diag-nosis Underlying Pathology, Natural History and Therapeutic In-tervention. 1992, vol I, pp 15–16 (abstr)
7. Beatty WW, Paul RH, Wilbanks SL, Hames KA. Identifying mul-tiple sclerosis patients with mild or global cognitive impair-ment using the Screening Examination for Cognitive Impair-ment (SEFCI). Neurology 1995;45:718–723
8. Kurtzke JF. Rating neurologic impairment in multiple sclerosis. An expanded disability status scale (EDSS). Neurology 1983; 33:1444–1452
9. Koopmans RA, Li DK, Grochowski E, et al. Benign versus chronic progressive multiple sclerosis. Magnetic resonance im-aging features. Ann Neurol 1989;25:74–81
10. van Walderveen MA, Barkhof F, Hommes OR, et al. Correlating MRI and clinical disease activity in multiple sclerosis. Rele-vance of hypointense lesions on short-TR/short-TE (T1-weighted) spin-echo images. Neurology 1995;45:1684–1690 11. Comi G, Martinelli V, Medaglini S, et al. Correlation between
multimodal evoked potentials and magnetic resonance imaging in multiple sclerosis. J Neurol 1989;236:4–8
12. Miki Y, Grossman RI, Udupa JK, et al. Computer-assisted quan-titation of enhancing lesions in multiple sclerosis. Correlation with clinical classification. AJNR Am J Neuroradiol 1997;18: 705–710
13. Rao SM, Leo GJ, Haughton VM, et al. Correlation of magnetic resonance imaging with neuropsychological testing in multiple sclerosis. Neurology 1989
14. Swirsky-Sacchetti T, Mitchell D, Seward J, et al. Neuropsycho-logical and structural brain lesions in multiple sclerosis. A re-gional analysis. Neurology 1992;42:1291–1295
15. Callanan MM, Logsdail SJ, Ron MA, Warrington EK. Cognitive impairment in patients with clinically isolated lesions of the type seen in multiple sclerosis. A psychometric and MRI study.
Brain 1989;112:361–374
16. Franklin GM, Heaton RK, Nelson LM, et al. Correlation of neu-ropsychological and MRI findings in chronic/progressive mul-tiple sclerosis. Neurology 1988;38:1826–1829
17. Poser CM, Paty DW, Scheinberg L, et al. New diagnostic criteria for multiple sclerosis. Guidelines for research protocols. Ann
Neurol 1983;13:227–231
18. Grossman M, Armstrong C, Onishi K, et al. Patterns of cognitive impairment in relapsing-remitting and chronic progressive multiple sclerosis. Neuropsychiatry Neuropsychol Behav Neurol 1994;7:194–210
19. Gronwall D. Paced auditory serial-addition task. A measure of recovery from concussion. Percept Mot Skills 1977;44:367–373 20. Newcombe F. Missle Wounds of the Brain. London: Oxford
Uni-versity Press; 1969
21. Spreen O, Benton AL. Neurosensory Center Comprehensive
Ex-amination for Aphasia. Rev Ed Victoria: University of Victoria,
Laboratory of Neuropsychology; 1977
22. Gauthier LD, Joanette Y. The Bells test. A quantitative and qualitative test for visual neglect. Int J Clin Neuropsychol 1989; 6:49–54
23. Smith A. Symbol Digit Modalities Test: Manual. Los Angeles: Western Psychological Services; 1982
24. Lezak M. Neuropsychological Assessment. Oxford: Oxford Uni-versity Press; 1983
25. Money JA. Standardized road map test of direction sense. San Raphael: Academic Therapy Publications; 1976
26. Udupa JK, Odhener, D. Samarasekera, S. et al. 3DVIEWNIX. An open, transportable, multidimensional, multimodality, multi-parametric imaging software system. SPIE Proc 1994;2164:58–73 27. Udupa J, Samarasekera S. Fuzzy connectedness and object
def-inition. SPIE Proc 1996;58:246–261
28. Udupa J, Wei L, Samarasekera S, et al. Multiple sclerosis lesion quantification using fuzzy connectedness principles. IEEE
Trans Med Imaging 1997;16:598–609
29. Miki Y, Grossman RI, Udupa JK, et al. Isolated U-fiber involve-ment in multiple sclerosis. Neurology (in press)
30. Heaton RK, Nelson, L.M., Thompson, D.S., el al. Neuropsycho-logical findings in relapsing-remitting and chronic-progressive multiple sclerosis. J Consult Clin Psychol 1985;53:103–110 31. Beatty WW, Goodkin DE, Menson N, Beatty PA. Cognitive
dis-turbances in patients with relapsing-remitting multiple scle-rosis. Arch Neurol 1989;46:1113–1119
32. Matthews PM, Pioro E, Narayanan S, et al. Assessment of lesion pathology in multiple sclerosis using quantitative MRI mor-phometry and magnetic resonance spectroscopy. Brain 1996; 119:715–722
33. Arnold DL, Riess GT, Matthews PM, et al. Use of proton mag-netic resonance spectroscopy for monitoring disease progres-sion in multiple sclerosis. Ann Neurol 1994;36:76–82
34. Narayanan S, Fu L, Pioro E, et al. Imaging of axonal damage in multiple sclerosis. Spatial distribution of magnetic reso-nance imaging lesions. Ann Neurol 1997;41:385–391
35. van Buchem MA, Grossman RI, Armstrong C, et al. Correlation of volumetric magnetization transfer imaging with clinical data in multiple sclerosis. (in press)
36. Barkhof F, Mc Gowan J, van Waesberghe J, Grossman R. Hy-pointense MS lesions on T1-weighted spin echo MR images: their contribution in understanding MS evolution. J Neurol
Neurosurg Psychiatry 1998;64:S77–S79
37. Haughton VM, Yetkin FZ, Rao SM, et al. Quantitative MR in the diagnosis of multiple sclerosis. Magn Reson Med 1992;26: 71–78
38. Filippi M, Campi A, Dousset V, et al. A magnetization transfer imaging study of normal-appearing white matter in multiple sclerosis. Neurology 1995;45:478–482
39. Haughton VM, Yetkin FZ, Rao SM, et al. Quantitative MR in the diagnosis of multiple sclerosis. Magn Reson Med 1992;26: 71–78
40. Loevner LA, Grossman RI, Cohen JA, Lexa FJ, Kessler D, Kolson DL. Microscopic disease in normal appearing white matter on conventional MR images in patients with multiple sclerosis. Assessment with magnetization-transfer measurements.
Radi-ology 1995;196:511–515
41. Dousset V, Grossman RI, Ramer KN, et al. Experimental allergic encephalomyelitis and multiple sclerosis. Lesion characteriza-tion with magnetizacharacteriza-tion transfer imaging. Radiology 1992;182: 483–489