AN EMPIRICAL STUDY ON RELATIONSHIP BETWEEN FUTURE AND SPOT PRICE
Department of Commerce, Government First
ARTICLE INFO ABSTRACT
Gold is a chemical element with symbol Au (from Latin: aurum) and atomic number 79. In its purest form, it is a bright, slightly reddish yellow,
been a valuable and highly sought
long before the beginning of recorded history. The world consumption of new gold produced is about 50% in jewellery, 40% in investments, and 10% in industry. The primary purpose of the study is to examine the relationship between the Gold futures prices and Gold spot prices traded in India. The data has been collected from National Commodity & Derivativ
period from May 2015 to Jan. 2016. The results from unit root test (ADF) indicate stationarity at 1st difference. Hence, Johansen’s cointegration test is examined to know the relationship between Gold futures prices and
series are cointegrated, then there must be Granger causality between them directions. It is concluded that there is long
prices price traded in India on testifying Unit Root Test, Cointegration Test and Pair Causality Test.
prices of Gold are ca
investors and portfolio managers to develop effective trading and hedging strategies in the Indian gold market.
Copyright©2016, Dr. Jeelan Basha. This is an open access article
distribution, and reproduction in any medium, provided the original work is properly cited.
INTRODUCTION
Gold isa chemicalelement with symbol Au (from
and atomic number 79. In its purest form, it is a bright, slightly reddish yellow, dense, soft, malleable and ductile
one of the least reactive chemical elements, and is solid under standard conditions. This metal has been a valuable and highly sought-after precious metal for coinage
other arts since long before the beginning of Gold is also used in infrared
glass production, gold leafing, and tooth restoration Certain gold salts are still used as anti
medicine. The world consumption of new gold produced is about 50% in jewellery, 40% in investments
in industry. A total of 183,600 tonnes of gold is in existence above ground, as of 2014. This is equivalent to 9513 m gold.
*Corresponding author: Dr. Jeelan Basha, V.,
Department of Commerce, Government First Grade College, Mariyammanahalli-583222, Karnataka, India.
ISSN: 0975-833X
Article History:
Received 21st March, 2016
Received in revised form 17th April, 2016
Accepted 28th May, 2016
Published online 30th June,2016
Key words:
Unit root, Cointegration, Granger Causality test.
Citation: Dr. Jeelan Basha, V., 2016. “An empirical study on relation
33775-33779.
RESEARCH ARTICLE
AN EMPIRICAL STUDY ON RELATIONSHIP BETWEEN FUTURE AND SPOT PRICE
*
Dr. Jeelan Basha, V.
Commerce, Government First Grade College, Mariyammanahalli-583222, Karnataka
ABSTRACT
Gold is a chemical element with symbol Au (from Latin: aurum) and atomic number 79. In its purest form, it is a bright, slightly reddish yellow, dense, soft, malleable and ductile metal.
been a valuable and highly sought-after precious metal for coinage, jewellery, and other arts since long before the beginning of recorded history. The world consumption of new gold produced is about 50% in jewellery, 40% in investments, and 10% in industry. The primary purpose of the study is to examine the relationship between the Gold futures prices and Gold spot prices traded in India. The data has been collected from National Commodity & Derivatives Exchange Limited (NCDEX) for the period from May 2015 to Jan. 2016. The results from unit root test (ADF) indicate stationarity at 1st difference. Hence, Johansen’s cointegration test is examined to know the relationship between Gold futures prices and spot prices. The causalitytest reveals no contradictory findings If two or more time series are cointegrated, then there must be Granger causality between them
directions. It is concluded that there is long- term relationship be
prices price traded in India on testifying Unit Root Test, Cointegration Test and Pair
Causality Test. This study enables to determine which market is possessing better information. Spot prices of Gold are caused by the effects of Future prices. The study is immensely helpful for the investors and portfolio managers to develop effective trading and hedging strategies in the Indian gold market.
is an open access article distributed under the Creative Commons Attribution License, which distribution, and reproduction in any medium, provided the original work is properly cited.
(from Latin: aurum) 79. In its purest form, it is a bright, slightly ductile metal. It is one of the least reactive chemical elements, and is solid . This metal has been a valuable and coinage, jewellery, and since long before the beginning of recorded history. shielding, colored-tooth restoration. anti-inflammatories in medicine. The world consumption of new gold produced is investments, and 10% of gold is in existence above ground, as of 2014. This is equivalent to 9513 m3 of
Commerce, Government First Grade College,
Investment
Gold prices (US$ per troy ounce) are in nominal US$ and inflation adjusted US$. Many holders of gold store it in form of bullion coins or bars as a hedge against
economic disruptions.
Feldstein does not believe gold serves as a hedge against inflation or currency depreciation.
investment or collector purposes do not require good mechanical wear properties; they are typically fine gold at 24k. India has a rich tradition of gold consumption and production. It is cherished both as an adornment
households own circa 22000 tonnes of gold and around 600 tonnes of gold is used in jewellery production each year.
Review of Literature
Ehrich (1969) studied the cash
live beef cattle markets during 1948 to 1966. The results suggested that there were long run price relationships between the spot and futures prices of the sample market and it was also found that the cash markets lead the future markets. Wahab
International Journal of Current Research Vol. 8, Issue, 06, pp.33775-33779, June, 2016
INTERNATIONAL
An empirical study on relationship between future and spot price”, International Journal of Current Research
AN EMPIRICAL STUDY ON RELATIONSHIP BETWEEN FUTURE AND SPOT PRICE
583222, Karnataka, India
Gold is a chemical element with symbol Au (from Latin: aurum) and atomic number 79. In its purest dense, soft, malleable and ductile metal. This metal has after precious metal for coinage, jewellery, and other arts since long before the beginning of recorded history. The world consumption of new gold produced is about 50% in jewellery, 40% in investments, and 10% in industry. The primary purpose of the study is to examine the relationship between the Gold futures prices and Gold spot prices traded in India. The es Exchange Limited (NCDEX) for the period from May 2015 to Jan. 2016. The results from unit root test (ADF) indicate stationarity at 1st difference. Hence, Johansen’s cointegration test is examined to know the relationship between Gold spot prices. The causalitytest reveals no contradictory findings If two or more time-series are cointegrated, then there must be Granger causality between them - either one-way or in both
term relationship between Gold futures prices and spot prices price traded in India on testifying Unit Root Test, Cointegration Test and Pair-wise Granger This study enables to determine which market is possessing better information. Spot used by the effects of Future prices. The study is immensely helpful for the investors and portfolio managers to develop effective trading and hedging strategies in the Indian gold
ribution License, which permits unrestricted use,
Gold prices (US$ per troy ounce) are in nominal US$ and Many holders of gold store it in form as a hedge against inflation or other However, economist Martin does not believe gold serves as a hedge against inflation or currency depreciation. Modern bullion coins for or collector purposes do not require good mechanical wear properties; they are typically fine gold at 24k. India has a rich tradition of gold consumption and production. It is cherished both as an adornment and investment. Indian households own circa 22000 tonnes of gold and around 600 tonnes of gold is used in jewellery production each year.
Ehrich (1969) studied the cash – futures price relationship for live beef cattle markets during 1948 to 1966. The results suggested that there were long run price relationships between the spot and futures prices of the sample market and it was also
that the cash markets lead the future markets. Wahab
INTERNATIONAL JOURNAL OF CURRENT RESEARCH
et al. (1994) tested the co integration between gold and silver prices with daily spot and future prices. They used daily cash price and daily futures price and establish that there is no integration between gold and silver in both markets. Since gold is used as the primary commodities in the commodity trading centre, there are very few researches that have focused on the long –run relationship between the silver spot and future prices metals especially gold and explained the relationship. It is believed that there exists the long –run relationship between spot and future prices rather than a short –run which can be verified by inspecting whether the spot and future prices are co integrated. There exist the immense literatures highlighting the long –run relationship between spot and future prices of commodities among others, (Matin & Garcia 1981, Hokkio & Rush, 1989, Wahab & Lashgari 1993, Giot 2003, Garica & Leuthold, 2004, Hernanadez & Torero, 2010)
Objectives: The purpose of the study is to
To examine the relationship between future and spot prices of Gold
Data Source and Methodology
The empirical investigation was carried out based on daily data ranging from May 2015 2009 to Jan.2016 which covers 160 observations. Future and Spot prices of Gold commodity was chosen for its study. The empirical investigation considers closing prices of Gold. Data for all variables were collected from the official websites of National Commodity & Derivatives Exchange Limited (NCDEX). Descriptive and inferential statistics and e views 7 are used for (1) unit root test (2) pairwise granger causality test (3) cointegration test and (4) Regression Model.
Hypothesis Testing
The hypotheses of this research are given below:
H01: There is a normal distribution
H02: There is unit root of Future and Spot prices of Gold.
H03: There is no cointegration between Future and Spot prices of Gold.
H04: FUTURE prices do not Granger Cause SPOT prices.
H05: SPOT price does not Granger Cause FUTURE prices.
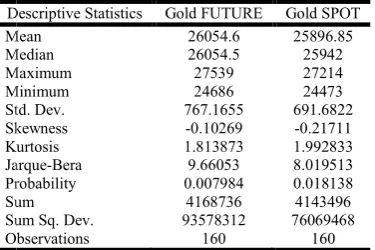
Descriptive Statistics
It describes then patterns and general trends of a dataset. It enables a reader to quickly understand and interpret the set of data that has been collected. This study uses measures of central tendency (Mean), measures of Variability (standard deviation, range, minimum and maximum), skewness and kurtosis. JarqueBera test statistic measures the difference of the skewness and kurtosis of the data series from the normal distribution. Jarque-Berastatistic tests the null hypothesis that data follow normal distribution.
Linear Regression Model
Linear regression analysis is used to learn more about the relationship between one independent and dependent variable. The linear regression equation can be represented as
Yt = at + beta1*t + Ut………2
Where Yt is the dependent variable, Xt is the independent variable, at is the constant (or intercept), β1 is the slope of the regression line which represent the strength and direction of the relationship between the independent and dependent variables and ut is random error term. The value of R-square, the coefficient of determination, is commonly used to evaluate the model fit of a regression equation. It explains the percentage of variance explained by the independent variable.
Unit Root Test
The foundation of time series analysis is stationarity. A stationary process is a stochastic process whose joint probability distribution does not change when shifted in time or space. If the variable is not stationary, we can obtain a high regression although there is no meaningful relation between variables i.e. spurious regression between totally unrelated variables. Therefore before estimating regression,Augmented Dickey Fuller Test (Hamilton, 1994) was conducted to check the stationarity of the data. If the caluculated absolute ADF test statistics is more than the critical values from fuller’s table, then the series are stationary or integrated of order zero i.e. unit root do not exists. The test for a unit root is conducted on the coefficient of yt-1 in the regression.Where Yt is the variable in period t, T denotes a time trend, is the difference operator, et is pure white noise error term disturbance with mean zero and variance deviation 2, k represents the no. of lags of the differences in the ADF equation and Yt 1 = (Yt-1 – Yt-2). ADF test is also employed to check the presence of unit root in the variables. The time series model specification of unit root is given below.
IMPt= b0 + b1t + IMPt-1 + ut ……… (1)
EXRt= b0 + b1 t + EXRt-1 +ut ………..(2)
The above models are non-stationary as root ( ) ≤ 1.
IMP = b0 +b1t + IMPt-1 + ut-1 where ≤ 1 ……….. (3)
Co integration
Cointegration test is conducted after ADF test showing stationarity variables. The cointegration test is to be done to check whether there is a long term relationship existing between variables through Johansen Co-integration Test. The test results of Johansen cointegration indicate long term relationship through Trace statistic and Max-Eigen Statistics.
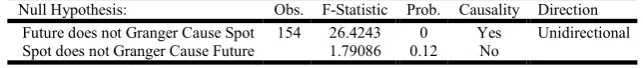
Granger Causality Test
Ordinarily regressions reflect “mere” Correlations, but Granger, who won a Nobel Prize in Economics, argued that there is an interpretation of a set of tests as revealing something about causality. The Standard Granger causality test (granger 1988) is a statistical hypothesis test for determining whether one time series is useful in forecasting another. Granger (Nobel Prize in Economics) causality technique measures the information given by one variable in explaining the latest value
of another variable. In addition, it also says that variable Y is granger caused by variable X if variable X assists in predicting the value of variable Y. If this is the case it means that the lagged values of variables X are statistically significant in explaining variable Y. Causality is the relationship between two variables, the first being cause and the second being effect. There are two types of causality relationship between these variable, bidirectional causality and unidirectional causality. The relationship between these two variables should be either unidirectional or bidirectional. If F-statistic
Alternate hypothesis is accepted. If F- statistic < 3.84 then H Null hypothesis is accepted. The test is based on the following regressions.
Yt =β0 + ∑mk=1 βkY1-k + ∑nl – 1 αl Xt – l + ut
RESULTS AND DISCUSSION
Chart I. Trend of Future and spot prices
Interpretation
On visual inspection of Chart-1 depicts the movement of future and spot prices have similar. The blue line shows future prices and the red line indicates spot prices.
24,400 24,800 25,200 25,600 26,000 26,400 26,800 27,200 27,600
25 50 75 100
[image:3.595.207.395.545.670.2]FUTURE SPOT Descriptive Statistics Mean Median Maximum Minimum Std. Dev. Skewness Kurtosis Jarque Probability Sum Sum Sq. Dev. Observations Table 2. Variable C FUTURE R-squared Adjusted R-squared S.E. of regression Sum squared resid Log likelihood F-statistic Prob(F-statistic) Source: Output of E-views
of another variable. In addition, it also says that variable Y is granger caused by variable X if variable X assists in predicting Y. If this is the case it means that the lagged values of variables X are statistically significant in Causality is the relationship between two variables, the first being cause and the second being effect. usality relationship between these variable, bidirectional causality and unidirectional causality. The relationship between these two variables should be either statistic ≥ 3.84, then statistic < 3.84 then Ho
-The test is based on the following
Chart I. Trend of Future and spot prices
movement of future and spot prices have similar. The blue line shows future prices
The graphs show the trends in the volatility of future and spot price is moderate. From a single glance it is clear that the future and spot price share price have highly positive relationship (0.961719) in between.
Interpretation
The Table 1 shows the description statistic of the future and spot prices from May 2015 to Jan.
median, minimum, standard deviation, skewness and kurtosis. According to the table, the mean for gold future price is 26054.6 and gold spot price is
same is 26054.5and 25942respectively. For the go maximum value is 27539and the minimum value is
the gold spot the maximum value during the period is 27214and the minimum value is
the variation from the mean which is higher in gold futures than that of gold spot. It shows the level
A negative skewness indicates that the tail on the right side is shorter than that of left side and the bulk of the values lie to the right of the mean. These have been found both in the Gold future and spot prices. If the kurtosis exceeds 3, the distribution is leptokurtic relative to the normal. If the kurtosis is less than 3, the distribution is platykurtic relative to the normal. In the above cases, Kurtosis is platykurtic because it does not excee the 3. (Kurtosis < 3, platykurtic distribution).
future price probability values 0.018138of Jarque- berastastistics, is rejected for future and spot prices significance.
Interpretation
It is evident from table 2 that determined by gold future price.
indicates it is significant at 5% level of significance. is 0.943094 which means 94.30% of the vari
prices is explained by external factors. The null hypothesis of insignificant impact of gold future price in explaining gold spot price is rejected at fiveper cent level of significance.
125 150
Table 1. Descriptive Statistics
Descriptive Statistics Gold FUTURE Gold SPOT Mean 26054.6 25896.85 Median 26054.5 25942 Maximum 27539 27214 Minimum 24686 24473 Std. Dev. 767.1655 691.6822 Skewness -0.10269 -0.21711 Kurtosis 1.813873 1.992833 Jarque-Bera 9.66053 8.019513 Probability 0.007984 0.018138 Sum 4168736 4143496 Sum Sq. Dev. 93578312 76069468 Observations 160 160
Regression Analysis of Gold Future and Spot Prices
Coefficient Std. Error t-Statistic Prob. 3084.007 446.006 6.914721 0 0.875578 0.017111 51.17121 0 0.943094 Mean dependent var 25896.85 squared 0.942734 S.D. dependent var 691.6822 S.E. of regression 165.5224 Akaike info criterion 13.06851 Sum squared resid 4328833 Schwarz criterion 13.10695 -1043.48 Hannan-Quinn criter. 13.08412 2618.493 Durbin-Watson stat 1.179681 statistic) 0
views
The graphs show the trends in the volatility of future and spot moderate. From a single glance it is clear that the future and spot price share price have highly positive relationship
1 shows the description statistic of the future and spot prices from May 2015 to Jan. 2016. The table gives mean, median, minimum, standard deviation, skewness and kurtosis. According to the table, the mean for gold future price is and gold spot price is 25896.85and the median for the respectively. For the gold future the and the minimum value is 24686. For the gold spot the maximum value during the period is and the minimum value is 24473. Standard deviation is the variation from the mean which is higher in gold futures gold spot. It shows the level of risk in gold Futures. A negative skewness indicates that the tail on the right side is shorter than that of left side and the bulk of the values lie to the right of the mean. These have been found both in the Gold nd spot prices. If the kurtosis exceeds 3, the distribution is leptokurtic relative to the normal. If the kurtosis is less than 3, the distribution is platykurtic relative to the normal. In the above cases, Kurtosis is platykurtic because it does not exceed the 3. (Kurtosis < 3, platykurtic distribution).By using gold future price probability values0.007984and gold spot price of berastastistics, null hypothesis of normality future and spot prices at 5percent level of
It is evident from table 2 that 87.55% of gold spot prices is determined by gold future price. T-Statistic Prob. of 0.00 indicates it is significant at 5% level of significance. R squared which means 94.30% of the variation in Spot prices is explained by external factors. The null hypothesis of insignificant impact of gold future price in explaining gold spot price is rejected at fiveper cent level of significance.
[image:3.595.159.440.692.791.2]It is free from spurious regression since Durbin-Watson stat of 1.179681 is greater than that of R-squared of 0.943094.
Interpretation
It is disclosed from table 3 that all the absolute test statistics values are more than those of critical value. Therefore, the null hypotheses of non-stationary are rejected. It is also clear from the P value that all the P values are 0 which are less than 5 per cent. Therefore, the null hypothesis of unit root is rejected in the series. Therefore the alternative hypothesis of stationarity is accepted for all the series namely Gold Future and Spot prices at first difference.
Interpretation
The table 5 shows the cointegrated or non- cointegrated status of gold future and spot prices. The test results of Johansen cointegration represent the gold future and spot are cointegrated priced over long term. There are two statistic results namely Cointegration Rank Trace statistic and Maximum Eigenvalue statistic Tests. Trace test indicates cointegration at the 0.05 level since their statistic values are more than those of critical values and their prob. values are 0.00 and 0.00 at none and at most 1 respectively. Hence, it accepts null hypothesis of number of co integration at none and at most one. Max-eigenvalue test also indicates cointegration at the 0.05 level since their statistic values are also more than those of critical values and their prob. Values are 0.00 and 0.00 and hence, it accepts alternative hypothesis of number of cointegration. Based on the cointegration tests, we conclude there is long term relationship between gold future and spot prices.
Interpretation
Alternative hypothesis is accepted since its prob. is 0.0000 which is less than 0.05. Hence, Gold futures prices cause Gold spot prices. Whereas for null hypothesis 2, Null hypothesis is accepted which means Gold spot does not cause Gold future prices. Therefore, this proves cause and effect relationship is unidirectional and not bidirectional. Therefore, it appears that Granger causality runs one way from Gold future prices to Gold spot prices and not other way
Conclusion
It is concluded that there is long- term relationship between Gold futures prices and spot prices price traded in India on testifying Unit Root Test, Cointegration Test and Pair-wise Granger Causality Test. This study enables to determine which market is possessing better information. . Spot price of Gold is caused by the effects of Future prices. The study is immensely helpful for the investors and portfolio managers to develop effective trading and hedging strategies in the Indian gold market.
REFERENCES
Granger, C.W.J. 1998. “Some Recent Developments In The Concept Of Causality”, Journal Of Econometrics, Volume 39, pp. 199-211.
PatelSamveg, 2012. “The effect of Macroeconomic Determinants on the performance of the indian stock market”, NMIMS Management Review Volume XXII August pp 37-48.
Bae, S.C., Kwon, T.H. and Park, J.W. 2004. “Futures trading, spot market volatility, and market efficiency: the case of the
[image:4.595.138.465.78.137.2]33778 Dr. Jeelan Basha, An empirical study on relationship between future and spot price
Table 3. Test statistic for unit root/Stationary
Augmented Dickey-Fuller test statistic Variables Test Critical Values
1% level 5% level 10% level t-Statistic- Calculated Value Prob.* Gold Spot prices 3.47199 2.87973 2.57655 12.03 0 Gold Future prices -3.472 -2.8797 -2.5765 -10.866 0
[image:4.595.67.534.185.263.2]* Prob. at 5% level of significance Source: Output of E-views
Table 4. Johansen Co integration Test
Johansen's Cointegration Test Results
Variables Cointegrating Equations Trace Test Maximal Eigenvalue Test
Statistics Critical Values Prob. Statistics Critical Values Prob. Spot and Future Prices of Gold None 83.10009 15.49471 0 58.21138 14.2646 0
Atmost 1 24.88871 3.841466 0 24.88871 3.841466 0 Trace test indicates 2 cointegratingeqn(s) at the 0.05 level
* denotes rejection of the hypothesis at the 0.05 level **MacKinnon-Haug-Michelis (1999) p-values Source: Output of E-views
Table 5. Pair-wise Granger Causality Tests
Null Hypothesis: Obs. F-Statistic Prob. Causality Direction Future does not Granger Cause Spot 154 26.4243 0 Yes Unidirectional Spot does not Granger Cause Future 1.79086 0.12 No
[image:4.595.139.461.308.342.2]Korean index futures markets”, The Journal of Futures
Markets, Vol. 24, No.12, pp.1195-1228.
JeelanBasha, V. 2015. “A study on co integration between Sensex and TCS security in India”, International Journal of
Management and Social Science Research Review, Vol.1,
Issue 16, Oct. 2015, pp. 348-352.
JeelanBasha, V. 2015. “Testing for Granger Causality between BSE Sensex and Forex Reserves – An Empirical Study”,
International Journal of Current Research, Vol.7, Issue11,
Nov. 2015, pp. 23381-23385.
Gujarati, D. N. 2003. Basic Econometrics, pp. 856–862. www.investopedia.com