GLOMERULAR FILTRATION RATE AND CYSTATIN C AS MARKERS FOR DIABETIC NEPHROPATHY
*
Hana Mohamed Gashlan and Heba Abdullah Alghamdi
Faculty of Science, King Abdulaziz University, Jeddah
ARTICLE INFO ABSTRACT
Diabetes is recognized as a major risk factor for the development of kidney disease. Diabetic subjects with kidney disease may be at high risk for developing other health complications. The early detection of kidney dysfunction in subject with type 1 diabe
progression to diabetic nephropathy. The aim of this study is to assess the level of cystatin C for studying early renal function decline in type 1 diabetic patients. This study included 64 type 1 diabetes mellitus pa
control and control group included 30 healthy age matching subjects. Levels of HbA1c, serum fasting blood glucose, lipid profile, uric acid, creatinine and cystatin C were dete
filtration rate was detected according to cockcroft
(MDRD) formulas. For uric acid level a significant reduction was found in patients with GFRMDRD
highly significant increase (P< 0.005) in high density lipoprotein in patients with GFR ml/min/1.73m2, meanwhile the serum level of low density lipoprotein showed a non increase in pat
cystatin C and creatinine (P< 0.01) and a very highly significant decrease (P< 0.001), (P< 0.000) in both formulas CG and MDRD > 90. This study may suggest that age, BMI, ge
and duration of the diabetes may influence the level of cystatin C and the GFR provides a good index for the decline of kidney function.
Copyright©2016, Hana Mohamed Gashlan and Heba Abdullah Alghamdi
License, which permits unrestricted use, distribution, and reproduction in any medium, provided the original work is properly cited.
INTRODUCTION
Diabetes mellitusis developing as a major public health problem in Saudi Arabia in parallel with the worldwide diabetes epidemic, which is having a particular impact upon the Middle East and the third world (El-Hazmi
Nozha and Al-Maatouq, 2004). Diabetes ca changes in kidney structure, tubular (Brito
interstitial (Katz et al., 2002) changes are also present. Diabetic nephropathy is considered one of the major microvascular complications of diabetes (Felehgari
Approximately 20–30% of patients with type 1 or type 2 diabetes develop evidence of nephropathy (Pantalone 2015). Diabetic nephropathy develops in about 40% of patients with diabetes, even when high glucose levels are maintained for long periods of time. The serum level of cystatin C has beenused as an endogenous marker of renal function that is
*Corresponding author: Hana Mohamed Gashlan
Faculty of Science, King Abdulaziz University, Jeddah
ISSN: 0975-833X
Article History:
Received 21st March, 2016
Received in revised form 18th April, 2016
Accepted 22nd May, 2016
Published online 15th June,2016
Key words: Diabetes,
Glomerular filtration rate, Cystatin C- Diabetic nephropathy, Hyperfiltration.
Citation: Hana Mohamed Gashlan and Heba Abdullah Alghamdi.
International Journal of Current Research, 8, (06), 32337
RESEARCH ARTICLE
GLOMERULAR FILTRATION RATE AND CYSTATIN C AS MARKERS FOR DIABETIC NEPHROPATHY
Mohamed Gashlan and Heba Abdullah Alghamdi
Faculty of Science, King Abdulaziz University, Jeddah
ABSTRACT
Diabetes is recognized as a major risk factor for the development of kidney disease. Diabetic subjects with kidney disease may be at high risk for developing other health complications. The early detection of kidney dysfunction in subject with type 1 diabetes is of vital important to treat the progression to diabetic nephropathy. The aim of this study is to assess the level of cystatin C for studying early renal function decline in type 1 diabetic patients. This study included 64 type 1 diabetes mellitus patients (male and female) all the patients were hyperglycaemic with poor glucose control and control group included 30 healthy age matching subjects. Levels of HbA1c, serum fasting blood glucose, lipid profile, uric acid, creatinine and cystatin C were dete
filtration rate was detected according to cockcroft-gault (CG) and modification of diet in renal disease (MDRD) formulas. For uric acid level a significant reduction was found in patients with
MDRD>90. The serum levels of cholesterol showed a significant increase (P< 0.05) and a very
highly significant increase (P< 0.005) in high density lipoprotein in patients with GFR ml/min/1.73m2, meanwhile the serum level of low density lipoprotein showed a non
increase in patients with GFRMDRM 90 ml/min/1.73m2. A highly significant decrease was found in
cystatin C and creatinine (P< 0.01) and a very highly significant decrease (P< 0.001), (P< 0.000) in both formulas CG and MDRD > 90. This study may suggest that age, BMI, ge
and duration of the diabetes may influence the level of cystatin C and the GFR provides a good index the decline of kidney function.
Hana Mohamed Gashlan and Heba Abdullah Alghamdi.Thisis an open access article distributed under the Creative Commons Att use, distribution, and reproduction in any medium, provided the original work is properly cited.
developing as a major public health problem in Saudi Arabia in parallel with the worldwide diabetes epidemic, which is having a particular impact upon the Hazmi et al., 1995 ; Al-Maatouq, 2004). Diabetes causes unique changes in kidney structure, tubular (Brito et al., 1998) and ., 2002) changes are also present. Diabetic nephropathy is considered one of the major microvascular complications of diabetes (Felehgari et al., 2011). 30% of patients with type 1 or type 2 diabetes develop evidence of nephropathy (Pantalone et al., 2015). Diabetic nephropathy develops in about 40% of patients with diabetes, even when high glucose levels are maintained . The serum level of cystatin C has used as an endogenous marker of renal function that is
Corresponding author: Hana Mohamed Gashlan,
Faculty of Science, King Abdulaziz University, Jeddah
accurate even at the low concentrations found when Glomerular filtration rate (
(Westhuyzen, 2006). Cystatin C is unique among cystatins as it seems to be produced by all human nucleated cells (Čabarkapa,2015). It is freely filtered by the renal glomerulus and primarily catabolized in the renal tubules, if kidney functions and glomerular filtration rate decline, the b
of cystatin C rise (Newman, 2002). This observation obviously implied an insignificant peritubular uptake of cystatin C. Inhuman, cystatin C is normally degraded by proximal tubular cells after its passage through the glomerular membrane (Jacobsson et al., 1995). Several st
does not appear to be affected by age, gender, diet, lean body mass, body fat content, inflammatory processes, liver functions or malignancies (Randers et al., 1998 and
Glomerular hyperfiltration is occurs
young Type 1 diabetes and consider a characteristic functional abnormality in insulin-dependent diabetic patients. It is also a proposed mechanism for kidney injury in several clinical circumstances (Palatini, 2012).
evaluate the significance ofglomerular filtration rateand serum International Journal of Current Research
Vol. 8, Issue, 06, pp.32337-32342, June, 2016
INTERNATIONAL
Citation: Hana Mohamed Gashlan and Heba Abdullah Alghamdi. 2016. “Glomerular filtration rate and cystatin c as markers for diabetic nephropathy”, 337-32342.
GLOMERULAR FILTRATION RATE AND CYSTATIN C AS MARKERS FOR DIABETIC NEPHROPATHY
Mohamed Gashlan and Heba Abdullah Alghamdi
Diabetes is recognized as a major risk factor for the development of kidney disease. Diabetic subjects with kidney disease may be at high risk for developing other health complications. The early tes is of vital important to treat the progression to diabetic nephropathy. The aim of this study is to assess the level of cystatin C for studying early renal function decline in type 1 diabetic patients. This study included 64 type 1 tients (male and female) all the patients were hyperglycaemic with poor glucose control and control group included 30 healthy age matching subjects. Levels of HbA1c, serum fasting blood glucose, lipid profile, uric acid, creatinine and cystatin C were determined. Glomerular gault (CG) and modification of diet in renal disease (MDRD) formulas. For uric acid level a significant reduction was found in patients with showed a significant increase (P< 0.05) and a very highly significant increase (P< 0.005) in high density lipoprotein in patients with GFRMDRM 90
ml/min/1.73m2, meanwhile the serum level of low density lipoprotein showed a non-significant 90 ml/min/1.73m2. A highly significant decrease was found in cystatin C and creatinine (P< 0.01) and a very highly significant decrease (P< 0.001), (P< 0.000) in both formulas CG and MDRD > 90. This study may suggest that age, BMI, gender, glycaemic control and duration of the diabetes may influence the level of cystatin C and the GFR provides a good index
article distributed under the Creative Commons Attribution use, distribution, and reproduction in any medium, provided the original work is properly cited.
accurate even at the low concentrations found when merular filtration rate (GFR) is normal or high Westhuyzen, 2006). Cystatin C is unique among cystatins as it seems to be produced by all human nucleated cells ). It is freely filtered by the renal glomerulus and primarily catabolized in the renal tubules, if kidney functions and glomerular filtration rate decline, the blood levels (Newman, 2002). This observation obviously implied an insignificant peritubular uptake of cystatin C. Inhuman, cystatin C is normally degraded by proximal tubular cells after its passage through the glomerular membrane ., 1995). Several studies stated that cystatin C does not appear to be affected by age, gender, diet, lean body mass, body fat content, inflammatory processes, liver functions ., 1998 and Schuck et al., 2004). Glomerular hyperfiltration is occurs in the large majority of young Type 1 diabetes and consider a characteristic functional dependent diabetic patients. It is also a proposed mechanism for kidney injury in several clinical (Palatini, 2012). The aim ofthis study was to evaluate the significance ofglomerular filtration rateand serum
INTERNATIONAL JOURNAL OF CURRENT RESEARCH
cystatin C as a marker for early detection of renal impairment in Saudi patients with type 1 diabetes mellitus.
MATERIALS AND METHODS
Subjects
This study included 64 patients with T1DM (male and female) attending outpatient’s clinics of King Abdulaziz University
Hospital in Jeddah, Saudi Arabia with age range between (13-48 years) and duration of diabetes from (1 year to 19
years). The 64 patients were subdivided into two groups according to estimated glomerular filtration rate: One included diabetic patients with GFR more than 90 ml/min. The other included diabetic patients with GFR less than 90 ml/min. The control group included thirty healthy age matching subjects not suffering from any disease. All the patients gave written, informed consent and the study was approved by the Ethics and Research Committee.
Samples Collection
Five milliliters of venous blood were withdrawn from both normal and diabetic subjects after an overnight fasting. Two milliliters were put into a tube containing EDTA as anticoagulant while the other 3ml were put into a plain tube and left to clot then centrifuged at 3000 rpm for 10 minutes to separate serum and stored at -20 C° until assayed.
Biochemical Analysis
Whole blood of glycosylated haemoglobin HbA1C level was measured according to the method described by (Calisti and Tognetti S, 2005), uric acid was measured according to (Kalckar, 1947). Determination of serum levels of creatinine employed a modification of the kinetic Jaffe reaction reported by Larsen (1972). Serum Cystatin C was determined according to the method described by Grubb et al. (1985).
Calculation of glomerular filtration rate
The most widely used equations to calculate the estimated GFR (eGFR) in adults are Cockcroft-Gault (CG) 1976 and the Modification of Diet in Renal Disease (MDRD) (Levey et al., 1999), both equations use serum creatinine levels to determine the eGFR.
eGFR , mL/ min
=[140 age] × body weight(kg) 72 × serum creatinine(mg/dl) × (0.85 if female)
eGFRMDRD, mL/min/1.73m2=186.3 × Creatinine, mg/dL-1.154 ×
age-0.203 × (0.742, if female)
Statistical Analysis
Statistical analysis wasperformed using Social Package for Social Science (SPSS) software package for data analysis version 21. Data was represented as mean ± standard deviations of the mean. Comparison between two groups was performed by using student (t) test. Pearson’s correlation test was used for
correlating variables. Probability P< 0.05 was considered statistically significant.
RESULTS
Serum levels of LDL and HDL displayed a highly significant increase in T1DM group compared to control. Meanwhile
serum levels of cholesterol and TGL showed a non-significant increase as compared to control. BMI showed non-significant changes (Table 1). From Table 2, HbA1c and serum glucose levels showed a very highly significant increase, while a very highly significant decrease was found in the serum levels of uric acid and creatinine in T1DM compared to control group.
Cystatin C level showed on difference between the two groups. The serum levels of cholesterol, LDL and HDL showed a non-significant increase in patients with GFRCG> 90 ml/min, while
a non-significant decrease was shown in the serum levels of TGL in patients with GFRCG> 90 ml/min compared to GFRCG ≤
90 ml/min (Table 3). The serum level of LDL showed a non-significant increase in patients with GFRMDRM 90
ml/min/1.73m2 compared to patients with GFRMDRD ≤ 90
ml/min/1.73m2. The serum levels of cholesterol and HDL showed a significant increase in patients with GFRMDRM 90
ml/min/1.73m2 as compared to patients with GFRMDRD ≤ 90
ml/min/1.73m2 (Table 3). The serum levels of TGL showed a non-significant decrease in patients with GFRMDRM 90
ml/min/1.73m2. The body mass index showed non-significant increase in patients with GFRCG> 90 ml/min compared to
GFRCG ≤ 90 ml/min. At the same time, BMI showed a very
highly significant decrease in patients with GFRMDRM 90
ml/min/1.73m2as compared to patients with GFRMDRD ≤ 90
ml/min/1.73m2.
The serum levels of glucose and uric acid showed non-significant decrease in GFRCG group with > 90 ml/min
compared to the GFRCG ≤ 90 ml/min group, by contrastthe
blood level of HbA1c showed a non-significant increase in GFRCG group with > 90 ml/min compared to the GFRCG ≤ 90
ml/min group(Table 4). The blood level of HbA1c and the serum level of glucose showed a non-significant decrease in GFRMDRD group with > 90 ml/min/1.73m
2
compared to the GFRMDRD ≤ 90 ml/min/1.73m2 group,while the serum level of
uric acid showed a significant decrease in patient with GFRMDRD>90 ml/min/1.73m2 compared to GFRMDRD ≤ 90
ml/min/1.73m2 group (Table 4). The serum levels of cystatin C and creatinine showed highly significant decrease in patients with GFRCG> 90 ml/min compared to GFRCG ≤ 90 ml/min as
well as in patients with GFRMDRM 90 ml/min/1.73m2
compared to patients with GFRMDRD ≤ 90 ml/min/1.73m 2
.
DISCUSSION
Table 1. Serum levels of Cholesterol, TGL, LDL, HDL and BMI in control and type1 diabetic patients
Parameters Groups
Cholesterol mg/dl
TGL mg/dl
LDL mg/dl
HDL mg/dl
BMI
Kg/m2
Control Range n= 19
136-197 53-69 77.2–125.2 35-59 21.3-33.5
Mean ± SD 176.5 ± 20.7 60 ± 7.9 104.1 ± 15.1 45.9 ± 7.45 26.8± 4.39
T1DM
Range n= 64
104-267 54-84 65.4–175.2 16-90 14.8- 43.8
Mean ± SD 185.7 ± 31.3 69±8.9 115.8 ± 25.9 52.2 ± 14.8 25.5± 6.64
P Value < NS NS 0.01 0.01 NS
[image:3.595.122.468.254.367.2]SD: Standard deviations P Value 0.01: Significant. NS: Non-significant
Table 2. Blood level of HbA1cand serum levels of Glucose, uric acid Cystatin C and Creatinine in control and type 1 diabetic patients
Parameters Groups
HbA1c% Glucose
mg/dl
Uric Acid mg/dl
Cystatin C mg/L
Creatinine mg/dl Control
Range n= 19
4.3–5.8 79-106 2.9–6.2 0.54–0.8 0.6–1.3
Mean ± SD 4.75 ± 0.37 94.4 ± 8.09 4.57 ± 1.07 0.69±0.07 0.94±0.19
T1DM
Range n= 64
5.5–14.7 72-492 1.9–6.4 0.43-1.46 0.4-1.6
Mean ± SD 9.75 ± 2.11 222.1 ± 95.5 3.45 ± 1.03 0.65±0.14 0.81±0.21
P Value 0.000 0.000 0.000 NS 0.05
SD: Standard deviations P Value 0.05: Significant.
P Value 0.005: very highly significant. NS: Non-significant
Table 3. Comparison between the serum levels of Cholesterol, TGL, LDL, HDL and BMI in type 1 diabetic
patients with GFRCG and GFRMDRD
GFRCG≤90
ml/min
GFRCG >90
ml/min
P Value GFRMDRD≤90
ml/min/1.73m2 GFRml/min/1.73mMDRD >90 2 P Value
Number 18 46 13 51
Cholesterol mg/dl 178.8±28.2 187±32.1 NS 173.3±30.4 190.6±30.7 0.05
LDL mg/dl 112.9±27.1 116.5±25.9 NS 109.7±24.2 118.2±26.5 NS
TGL mg/dl 70±10.3 65±9.36 NS 75±8.56 68±8.45 NS
HDL mg/dl 50.9±13.5 52.6±15.3 NS 44.3±12.2 55.3±14.7 0.005
BMI 22.9±6.65 26.1±6.55 NS 30.4±6.87 23.5±5.51 0.000
SD: Standard deviations P Value 0.05: Significant.
P Value 0.005: very highly significant. NS: Non-significant
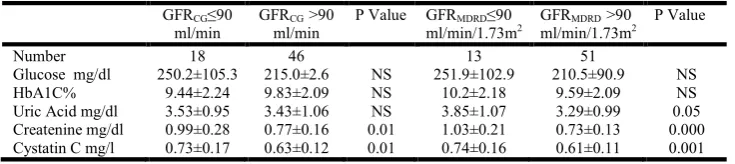
Table 4. Comparison between the levels of glucose, HbA1c, uric acid, creatinine and cystatin c in T1DM
patients with GFRCG and GFRMDRD
GFRCG≤90
ml/min
GFRCG >90
ml/min
P Value GFRMDRD≤90
ml/min/1.73m2 GFRml/min/1.73mMDRD >90 2 P Value
Number 18 46 13 51
Glucose mg/dl 250.2±105.3 215.0±2.6 NS 251.9±102.9 210.5±90.9 NS
HbA1C% 9.44±2.24 9.83±2.09 NS 10.2±2.18 9.59±2.09 NS
Uric Acid mg/dl 3.53±0.95 3.43±1.06 NS 3.85±1.07 3.29±0.99 0.05
Createnine mg/dl 0.99±0.28 0.77±0.16 0.01 1.03±0.21 0.73±0.13 0.000
Cystatin C mg/l 0.73±0.17 0.63±0.12 0.01 0.74±0.16 0.61±0.11 0.001
SD: Standard deviations P Value 0.01: Significant. P Value 0.05: Significant.
[image:3.595.103.480.444.524.2] [image:3.595.111.479.600.682.2]A highly positive correlation was found between HbA1c and glucose level (r= 0.514). Serum glucose levels are the main determinant of HbA1c levels. In high serum glucose concentration glucose can be combined into proteins non-enzymatically by an unregulated glycation reaction. Hussein et al. (2007) reported that HbA1c levels provides an index of integrated glucose concentration over the life span of the red blood cell normally about 100-120 days. Uric acid a weak organic acid plays an important role in renal disease. It is excreted mostly in the kidney and has been historically linked to acute kidney damage (Pasalic et al., 2012). The results of the current study of serum levels of Cholesterol, TGL, LDL and HDL in all the diabetic patients and control were represented in table 2. Guy et al. (2009) stated that youth with type 1 diabetes have abnormal lipid levels and atherogenic changes in lipoprotein composition, even after relatively short disease duration. James and Pometta (1990) stated that under normal circumstances, triglyceride-rich particles are rapidly hydrolyzed by lipoprotein lipase. The enzyme is induced in adipose tissue by insulin, and thus, intensive insulin therapy is typically associated with a marked fall of triglyceride-rich particles, which may explain the results obtained from the current study.
In this study, the participants were divided into two groups according to their estimated glomerular filtration rate. GFR ≤ 90 and > 90 which calculated by cockroftgult formula (CG) and modification of diet in renal disease (MDRD) formulas. Table 3 were adjusted for the comparison between the levels of glucose, HbA1c, uric acid, creatinine and cystatin C in T1DM patients according to GFRCG and GFRMDRD. The mean values
of creatinine and cystatin C in patients with GFR ≤ 90 calculated with both formulas (CG and MDRD) was the same. Also there were no differences in the results of creatinine and serum cystatin C in patients with GFR 90 in both formulas. The results of this study indicated that all the patients with GFR 90 or GFR ≤ 90 were hyperglycaemic with poor glucose control and a significant decrease was found in the level of uric acid (P< 0.05) in patients with GFRMDRD> 90
ml/min/1.73m2. In concomitant with this study, Yokoyama et al. (2009) found that high baseline GFR and high HbA1c to be a significant predictors in subjects with diabetes.
Mogensen and Andersen (1975) declared that in type 1 diabetes the most important determinant of hyperfiltration is uncontrolled hyperglycaemic. Perkins et al. (2007) indicated high HbA1c as a risk of early renal function decline. Regarding to low level of serum uric acid Goliket al. (1993) found that hypouricemia could be a marker for the onset of the diabetic kidney disease. Bo et al. (2001) stated that hypouricemia would be associated with poor disease control, hyperfiltration or a late onset nephropathy. Suryawanshiet al., (2006) observed that in diabetic patients, high levels of total cholesterol appear due to increased cholesterol synthesis and the triglyceride levels changes according to the glycemic control. The increase may be dueto over production of VLDL-TGL. The result of this study may not show typical dyslipidemia profile but it showed a disturbance in lipid profile as a result of diabetes. The results of this study suggested that cystatin C level may not be used to estimate renal function unless one accounts for other factors such age, BMI, gender, glycaemic control and duration of the
diabetes that may influence its level. It can be concluded that longer diabetes duration, poorer glycaemic control and BMI may associated with development of kidney function decline. Moreover, the glomerular filtration rate may provide the best index of kidney function. For this study cystatin C may consider as an alternative for serum creatinine but not a sensitive indicator. It may due to that the diabetic patients in this study despite they were hyperglycaemic with poor glucose control but they did not reach the stage of renal damage. Also, to take into account the glomerular hyperfiltration which may be strong predictive of the development of renal impairment parallel to cystatin C. In this study, serum creatinine and serum cystatin C concentration showed a normal level in GFRCG and
GFRMDRD. In cohort study, Mussap et al. (2002) found that the
correlation of cystatin C and creatinine was lower in patients with a normal GFR (>80 ml/min), as a consequence of different pathophysiological factors that may affect the serum concentration. In addition, the GFR calculated with CG and MDRD formulasrevealed that most of diabetic patients have a GFR > 90 which consider in other studies normal. Glomerular filtration rate is determined by renal plasma flow, the transmembrane hydraulic pressure gradients and the ultrafiltration coefficient. Renal plasma flow is dependent on changes between afferent and efferent renal arteriolar resistance; the transmembrane hydraulic pressure gradients is the difference between the mean pressure in the glomerular capillary and the proximal tubule; and the ultrafiltration coefficient is consistent with the filtration surface area and its permeability. in patients with diabetes, all of these factors are altered (Steffes et al., 1992 and Bak et al., 2000).
Disturbance of glomerular hemodynamic is an early event in type 1 diabetes mellitus, and glomerular hyperfiltration has been supported as a determinant of progression to clinical nephropathy. Hyperfiltration is a prerequisite for nephropathy (Rudberg et al., 1992). Yip et al. (1996) confirmed that the rate of renal function decline was faster in those with hyperfiltration than those without. From this study, the GFR calculated by CG and MDRD formulas was higher than 140 ml/min in about 25% of the diabetic population while, about 7.8% of the diabetic patients registered GFR between (120- 140 ml/min). Previous studies indicated that the threshold for hyperfiltration has ranged from 125 to 140 ml.min-1.1.73 m-2 (Dahlquist et al., 2001, Amin et al., 2005 and Magee et al., 2009). The state of hyperfiltration reflect hyperglycaemic and can be reversed with intensive insulin therapy. In conclusion for this study the level of cystatin C did not show any marked difference than serum creatinine level. It may consider as an alternative for serum creatinine but not a sensitive marker to detect the early changes in renal function. The diabetic patients in this study despite they were hyperglycemic with poor control of glucose level but they maybe did not reach yet the stage of renal damage. This study recommend to take into account the glomerular hyperfiltration which may be a strong predictive of the development of renal impairment.
REFERENCES
and expression of the human cystatin C gene, Biochem J, vol. 268:287-294.
Nozha, M. M., Maatouq, M. A., Mazrou, Y. Y., Harthi, S. S., Arafah, M. R., Khalil, M. Z. and Al-Mobeireek, A. 2004 Diabetes mellitus in Saudi Arabia,
Saudi Medical Journal, vol. 11:1603-1610.
Amin, R., Turner, C., VAN AKEN, S. A. R. A., Bahu, T. K., Watts, A., Lindsell, D. R. and Dunger, D. B. 2005. The relationship between microalbuminuria and glomerular filtration rate in young type 1 diabetic subjects: The Oxford Regional Prospective Study, Kidney international, vol. 4:1740-1749.
Ann Clin Lab Sci. Autumn;36(4):387-94.
Bak, M., Thomsen, K., Christiansen, T. and Flyvbjerg, A. 2000. Renal enlargement precedes renal hyperfiltration in early experimental diabetes in rats, J Am SocNephrol, vol. 11:1287–1292.
Bo, S., Cavallo‐Perin, P., Gentile, L., Repetti, E. and Pagano, G. 2001. Hypouricemia and hyperuricemia in type 2 diabetes: two different phenotypes, European journal of clinical investigation, vol. 4:318-321.
Brito, F.S., Caixeta, A.M., Rati MA, Perin, M.A., Martinez Filho, E.E., Ramires, J.A. 1998. Patient-Related and Angiographic Predictors of Restenosis After Excimer Laser Coronary Angioplasty. J Invasive Cardiol. Apr;10(3):162-168.
Čabarkapa, V. 2015. Cystatin C - more than the marker of the glomerular filtration rate. Med Pregl. 68(5-6):173-9. Calisti, L., and Tognetti, S. 2005. Measure of glycosylated
hemoglobin. Acta Biomed. 76, 3: 59-62.
Cano, N.J., Roth, H., Aparicio, M., Azar, R., Canaud, B., Chauveau, P., Combe, C., Fouque, D., Laville, M. and Leverve, X.M. 2002. French Study Group for Nutrition in Dialysis: Malnutrition in hemodialysis diabetic patients: evaluation and prognostic influence, Kidney Int, vol. 62:593–601.
Cha, R. H., Lee, C. S., Lim, Y. H., Kim, H., Lee, S. H., Yu, K. S. and Kim, Y. S. 2010. Clinical usefulness of serum cystatin C and the pertinent estimation of glomerular filtration rate based on cystatin C, Nephrology, vol. 8:768-776.
Cockcroft, D.W. and Gault, M.H. 1976. Prediction of creatinine clearance from serum creatinine, Nephron, vol. 1:31-41.
Dahlquist G, Aperia A, Broberger O et al. Renal function in relation to metabolic control in children with diabetes of different duration. ActaPaediatrScand 1983; 72: 903–909 Dahlquist, G., Stattin, E. L. and Rudberg, S. 2001. Urinary
albumin excretion rate and glomerular filtration rate in the prediction of diabetic nephropathy; a long‐term follow‐up study of childhood onset type‐1 diabetic patients, Nephrology Dialysis Transplantation, vol. 7:1382-1386. Domingueti, C.P., Dusse, L.M, Carvalho, M.D., de Sousa,
L.P., Gomes, K.B. and Fernandes, A.P 2015. Diabetes mellitus: The linkage between oxidative stress, inflammation, hypercoagulability and vascularcomplications. J Diabetes Complications.
El-Hazmi, M.A., Al-Swailem, A.R., Warsy, S.A., Al. Swailem, A.M., Sulimani, R. and Al-Mashari A.A. 1995. Consanguinity among Saudi Arabian population, J Med Genetics, vol. 32(8):623.
Felehgari, V., Rahimi, Z., Mozafari, H. and Vaisi-Raygani, A. 2011. ACE gene polymorphism and serum ACE activity in Iranians type II diabetic patients with macroalbuminuria, Molecular and cellular biochemistry, vol. 46:23-30.
Golik, A., Weissgarten, J., Cotariu, D., Cohen, N., Zaidenstein, R. and Ramot, Y. 1993. Renal uric acid handling in non-insulin-dependent diabetic patients with elevated glomerular filtration rates, ClinSci, vol. 85:713-6.
Grubb, A., Simonsen, O., Sturfelt, G., Truedsson, L. and Thysell, H. 1985. Serum concentration of cystatin C, factor D and b2-microglobulin as a measure of glomerular filtration rate, Acta Med Scand, vol. 218: 499– 503.
Guy, J., Ogden, L., Wadwa, R. P., Hamman, R. F., Mayer-Davis, E. J., Liese, A. D. and Dabelea, D. 2009. Lipid and Lipoprotein Profiles in Youth With and Without Type 1 Diabetes The SEARCH for Diabetes in Youth Case-Control Study, Diabetes Care, vol. 32:416-420.
Hannemann, A., Friedrich, N., Dittmann, K., Spielhagen, C., Wallaschofski, H., Völzke, H. and Nauck, M. 2012. Age-and sex-specific reference limits for creatinine, cystatin C and the estimated glomerular filtration rate, Clinical Chemistry and Laboratory Medicine, vol. 5:919-926. Hsu, C. Y., Chertow, G. M. and Curhan, G. C. 2002.
Methodological issues in studying the epidemiology of mild to moderate chronic renal insufficiency, Kidney international, vol. 5:1567-1576.
Huisman, T.H., Martis, E.A. and Dozy, A. 1958. Chromatography of hemoglobin types on carboxymethylcellulose, J Lab Clin Med, vol. 52: 312–27. Hussain, Z., Desai, S., Alam, N., Cheng, J. and Millet, T. 2007.
System and method for routing traffic through a virtual router-based network switch, U.S. PatentNo. 7,177,311. Jacobsson, B., Lignelid, H. and Bergerheim, U.S. 1995.
Transthyretin and cystatin C are catabolized in proximal tubular epithelial cells and the proteins are not useful as markers for renal cell carcinomas, Histopathology, vol. 26:559–64.
James, R.W. and Pometta, D. 1990. Differences in lipoprotein subfraction composition and distribution between type I diabetic men and control subjects, Diabetes, vol. 39:1158– 1164.
Kalckar, H.M. 1947. The biological synthesis of purine compounds. SympSocExp Biol. ;(1):38-55.
Katz, D. I., Giacino, J. T., Ashwal, S., Childs, N., Cranford, R., Jennett, B. and Zasler, N. D. 2002. The minimally conscious state definition and diagnostic criteria, Neurology, vol. 3:349-353.
Levey, A. S., Perrone, R. D. and Madias, N. E. 1988. Serum creatinine and renal function, Annual review of medicine, vol. 39:465-490.
Levey, A.S., Bosch, J.P., Lewis, J.B., Greene, T., Rogers, N., Roth, D. 1999. A more accurate method to estimate glomerular filtration rate from serum creatinine: a new prediction equation. Ann Intern Med, 130:461–70.
Maahs, D. M., Prentice, N., McFann, K., Snell-Bergeon, J. K., Jalal, D., Bishop, F. K. and Wadwa, R. P. 2011. Age and sex influence cystatin C in adolescents with and without type 1 diabetes, Diabetes care, vol. 11:2360-2362.
with the future risk of developing diabetic nephropathy? A meta-analysis, Diabetologia, vol. 4:691–697.
Mogensen, C. E., and Andersen, M. J. F. 1975. Increased kidney size and glomerular filtration rate in untreated juvenile diabetes: normalization by insulin-treatment, Diabetologia, vol. 11:221-224.
Mussap, M., DallaVestra, M., Fioretto, P., Saller, A., Varagnolo, M., Nosadini, R. and Plebani, M. 2002. Cystatin C is a more sensitive marker than creatinine for the estimation of GFR in type 2 diabetic patients, Kidney international, vol. 4:1453-1461.
Nandhini, T.A. and Anuradha, C.V. 2003. Inhibition of lipid peroxidation, protein glycation and elevation of membrane ion pump activity by taurine in RBC exposed to high glucose, ClinicaChimicaActa, vol. 336:129-135. Newman, D.J. 2002. Cystatin C, Ann ClinBiochem, vol. 39: 89
–104.
Palatini, P. 2012. Glomerular hyperfiltration: a marker of early renal damage in pre-diabetes and pre-hypertension. Nephrol Dial Transplant. 27(5):1708-14.
Pantalone, K., Hobbs, T., Wells, B., Kong, S., Kattan, M., Bouchard, J., Yu, Ch., Sakurada, B., Milinovich, A., Weng, W., Bauman, J., and Zimmerman, R., 2015. Clinical characteristics, complications, comorbidities and treatment patterns among patients with type 2 diabetes mellitus in a large integrated health systemBMJ Open Diab Res Care. Pasalic, D., Marinkovic, N. and Feher-Turkovic, L. 2012. Uric
acid as one of the important factors in multifactorial disorders–facts and controversies, Biochemia Medica, vol. 63-75.
Perkins, B.A., Ficociello, L.H., Ostrander, B.E., Silva, K. H., Weinberg, J., Warram, J. H. and Krolewski, A. S. 2007. Microalbuminuria and the risk for early progressive renal function decline in type 1 diabetes, J Am SocNephrol, vol. 18:1353–1361.
Randers, E. and Erlandsen, E. J. 1999. Serum cystatin C as an endogenous marker of the renal function–a review, Clinical chemistry and laboratory medicine, vol. 37: 389-395. Rudberg, S., Persson, B. and Dahlquist, G. 1992. Increased
glomerular filtration rate as a predictor of diabetic nephropathy--an 8-year prospective study, Kidney international, vol. 4:822.
Schuck, P.1., Boyd, L.F, Andersen, P.S. 2004. Measuring protein interactions by optical biosensors. CurrProtoc Cell Biol. May; Chapter (17)
Solerte, S.B., Fioravanti, M., Schifino, N. and Ferrari, E. 1989. Effects of diet-therapy on urinary protein excretion albuminuria and renal haemodynamic function in obese diabetic patients with overt nephropathy, Int J Obes, vol. 13:203–211.
Steffes, M., Bilous, R., Sutherland, D. and Mauer, S. 1992. Cell and matrix components of the glomerular mesangium in type I diabetes, Diabetes, vol. 41:679–684.
Suryawanshi, N. P., Bhutey, A. K., Nagdeote, A. N., Jadhav, A. A. and Manoorkar, G. S. 2006. Study of lipid peroxide and lipid profile in diabetes mellitus, Indian Journal of Clinical Biochemistry, vol. 1:126-130.
Westhuyzen, J. Cystatin C: a promising marker and predictor of impaired renal function. 2006.
Yip, J. W., Jones, S. L., Wiseman, M. J., Hill, C. and Viberti, G. 1996. Glomerular hyperfiltration in the prediction of nephropathy in IDDM: a 10-year follow-up study, Diabetes, vol. 12:1729-1733.
Yokoyama, H., Matsuo, S., Imai, E., Horio, M., Yasuda, Y., Tomita, K., Nitta, K. and Hishida, A. 2009. Revised equations for estimated GFR from serum creatinine in Japan, American Journal of Kidney Diseases, vol. 53:982-992.