ISSN Online: 2168-1538 ISSN Print: 2168-152X
Application of Statistical Design of Experiments
to Performance Analysis of Charcoal Cooks
Stoves
André Ndécky
1, Sébastien Gamache
1, Fabé I. Barro
2, Issakha Youm
1,21Centre d’Etudes et de Recherches sur les Energies Renouvelables (CERER), Dakar, Sénégal
2Laboratoire des Semi-Conducteurs et d’Energie Solaire (LASES), Département de Physique, Faculté des Sciences et
Techniques, Université Cheikh Anta Diop de Dakar, Dakar, Sénégal
Abstract
The Design of Experiments (DOE) and the Analysis of Variance (ANOVA) are used to determine the effect of fuel type, fuel initial load, secondary air inlet and ventilation on thermal efficiency and CO emission of two biomass fire cookstoves during boiling or simmering. Analysis of variance with Fisch-er’s statistical test (F-test) and Newman-Keuls test were applied to establish the influence of the independent parameters on the studied responses. The results of this study are useful to application of charcoal cooks stoves.
Keywords
Biomass Combustion, Charcoal Stove, Thermal Efficiency, Water Boiling Test, Carbon Monoxide Emission, ANOVA
1. Introduction
Energy use is closely linked with economic development, poverty reduction and the provision of vital services. Solid biomass energy (fuel wood, charcoal, agri-cultural residues, animal dung, etc.) plays a vital role in meeting local energy demand in many Sub-Saharan Africa (SSA) countries. Fuel wood is predomi-nantly used by rural people, while charcoal is the preferred cooking fuel for most urban and peri-urban dwellers [1]. Basic Charcoal or lump charcoal is usually produced by a process known as slow pyrolysis, by heating wood or other bio-mass inside relatively air tight enclosure, like an earth covered pit in the ground (earth mound kiln). Reliance on wood-based biomass energy contributes
sub-How to cite this paper: Ndécky, A., Ga-mache, S., Barro, F.I. and Youm, I. (2018) Application of Statistical Design of Expe-riments to Performance Analysis of Char-coal Cooks Stoves. International Journal of Clean Coal and Energy, 7, 39-57.
https://doi.org/10.4236/ijcce.2018.73003
Received: July 18, 2018 Accepted: August 28, 2018 Published: August 31, 2018
Copyright © 2018 by authors and Scientific Research Publishing Inc. This work is licensed under the Creative Commons Attribution International License (CC BY 4.0).
http://creativecommons.org/licenses/by/4.0/
Open Access
stantially to continuing process of deforestation and soil erosion, and signifi-cantly to greenhouse gases (GHG) and black carbon emissions, fostering the global climate change [2] [3][4][5]. Besides being a major threat to the envi-ronment, burning wood-based biomass releases dangerous particulate matter (PM), carbon monoxide (CO), and other toxic pollutants due to incomplete combustion and leads to household air pollution (HAP) [6][7][8]. HAP is con-sidered as a major contributor to several human health diseases such as acute low respiratory infection, chronic obstructive lung diseases, cataracts, etc. [8] [9]. In Senegal, exposure to HAP was responsible for at least 8,400 premature deaths and 24,000 disability-adjusted life years (DALYs), in 2010 [10][11].
Wood fuel and charcoal meet approximately 52.3% of Senegal’s domestic fuel requirements [12]. A national survey conducted recently with detailed questions on households cooking energy consumption and practices, revealed that the largest proportion of biomass fuel consumption consisted mainly of wood (61%) and charcoal (29%) [13]. More wood and consequently more forest are needed for producing charcoal in order to meet the demand, mainly from urban and semi-urban areas. This demand for solid wood outweighs natural regeneration and therefore puts Senegal’s forest under tremendous pressure and has severe consequences for the ecosystem as a whole.
Therefore, improved cook stoves (ICS), (i.e. stoves with high efficiency, cleaner combustion and better safety) received significant attention as interme-diate technologies to address adverse health and environmental impacts [14] [15].
Many authors suggested the use of insulation and radiation shields to decrease energy loss and optimizing heat transfer in order to improve charcoal stoves [16] [17][18][19]. However, by reducing the volume of the combustion chamber to a strict minimum and by controlling the space through which hot air can leave the combustion chamber, the traditional charcoal stove “Éclair-Taaru”1 could be improved [20]. The channel gaps under and around the pot can be sized to op-timize heat transfer efficiency [21]. Adding jets of preheated secondary air above the burning fuel is a technique suggested to decrease CO emission while using less fuel [22] [21]. Cook stove performance and emissions evaluation is influ-enced by a number of process factors including cook stove design, fuel type, pot, operational factors… and sometimes they are often ignored by researchers [23]. MacCarty et al. (2010) [24] reported that adding fan to a wood-burning stove reduce dramatically the average of CO and PM in the test kitchen and under the emissions hood. The study of Bentson et al. (2013) inferred the initial fuel load as an important and determining variable influencing the charcoal cook stove performance. An investigation on semi-gasifier biomass cook stoves concluded that emissions and efficiency varied substantially with stove design and fuel type [24].
However, to the best of our knowledge, no attempt has been made to study the interactive effect of process variables. Multivariate statistical techniques have
been used for analyzing situation in which a response of interest is influenced by several variables. In addition, these techniques are very useful tools to reduce the time and cost of studies and to obtain more information per experience [25]. The most commonly used statistical method is design of experiments (DOE), to predict the relationship between the responses and independent variables, espe-cially if there is a need to optimize the responses of a process [26]. Now, there is a growing body of literature documenting the application of design of experi-ment (DOE) for process optimization [27]-[32]. Hence, this present paper aimed to evaluate the individual and interactive effect of some parameters such as stove type (stove with secondary inlet or without); fuel type, fuel initial load and vent-ing that are likely to affect performance of charcoal cook stoves in terms of thermal efficiency and emissions. The outcome of this study will be useful to understand in depth-knowledge regarding the principal factors which are most influential on the response of cook stoves as well as their statistical significance.
2. Materials and Methods
2.1. “Éclair-Taaru” Stove
Cooking with charcoal in Sub-Saharan Africa is typically performed with a sim-ple stove usually made out of scrap sheet metal by local artisans generally named “Malgache” with no airflow control. With this stove, the pot sits directly on the charcoal bed and can block the air passage in combustion chamber [20].
The improved cook stove (ICS) selected for this study is a new innovative de-sign of charcoal ICS developed by GIZ firstly in Benin and Burkina Faso, called the “Éclair” referring to the fact that the device is fastest than other cook stove [33] and recently in Senegal, where it has been renamed “Éclair-Taaru”. “Taaru” in local language means beautiful referring to the fact that the device take care of users’ health, economy and environment.
To make difference between the stove with secondary air inlet and the stove without secondary air inlet, two stoves are considered in this study: “Éclair-Taaru”1 stove and “Éclair-Taaru”2 stove. That will limit the variability of certain factors.
The “Éclair-Taaru” (Figure 1) works as a “quasi-gasifier” with natural air convection. The stove is made from metal sheets and local tinsmiths are trained to manufacture the stoves. The air inlet compartment consists of two concentric cylinders acting as primary/secondary air separator to separate flow passage of two combustion airs. Very few charcoal stoves have a secondary air controller. Primary air enters through a side door which can also be opened and close to regulate airflow. Inflow of primary air supplies the charcoal in the combustion chamber from underneath. Provision of primary/secondary air separator allows secondary air to enter at the bottom holes of the outer cylinder and to get heated and rise upward towards combustion chamber at of just above the top level of the burning fuel. Preheated secondary air between the metal walls is then mixed with existing volatile contents efficiently to ensure complete combustion.
Figure 1. Pictorial view of the improved “Éclair-Taaru” charcoal cooking stove.
Primary and secondary airflow can be driven externally by a fan or blower. To avoid variations due to the change of cook stove, we have simply blocked the secondary air holes with the Scotch (or Duktape) that give us “Éclair-Taaru”2 stove (Figure 1(b)) without secondary air.
2.2. Fuels Used
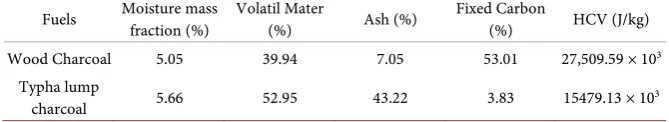
The stoves were tested with two different fuel types: natural wood charcoal and typha lump charcoal. Wood charcoal is bought in Dakar local market and come from South and/or East Senegal by using many different wood trees. For the ty-pha lump charcoal, it’s produced in Noth Senegal (Saint Louis) by family busi-ness. Wood charcoal in Senegal is produced by carbonizing wood in a low-oxygen atmosphere using traditional or improved Casamance kiln and can be purchased in the local market. The gathered charcoal consisted of a combina-tion of thin and thick pieces randomly distributed. Typha lump charcoal ob-tained through agglo-briquetting, from invasive typha australis are produced in a process including carbonization in kilns and agglomeration. The briquettes can have additive such as clay or molasses as binding agent. Typha lump charcoal used in this work have round forms. Indeed it has been proven by other re-searchers that variations in fuel dimensions have little influence and sometimes do not even influence the results on emissions and performance of cookstove. The effects of the size of wood fuel on efficiency and emission of the stoves was investigated. The fuel size had no significant influence on the efficiency of the stove. It was observed that burn rate increased as the size of fuel decreased. Burn rate can be regarded as comparable to firepower. It has been reported that with increasing firepower, generally stove efficiency tends to reduce, as more energy is lost to the surroundings rather than transferred to the pot [34]. The properties of the two fuel types are shown in Table 1.
2.3. Test Protocol
The Water Boiling Test (WBT) protocol “Version 4.2.2. (2013)” was used to de-termine cook stove power, energy efficiency and emissions (CO, CO2 and PM). It is an internationally well known and well defined protocol that can be used to
Table 1. Fuels characteristics.
Fuels Moisture mass fraction (%) Volatil Mater (%) Ash (%) Fixed Carbon (%) HCV (J/kg)
Wood Charcoal 5.05 39.94 7.05 53.01 27,509.59 × 103 Typha lump
charcoal 5.66 52.95 43.22 3.83 15479.13 × 103
test and compare any cook stove in the field and in the laboratory. This allows WBT results from any laboratory to be compared with those from other labora-tories using other stoves. However, WBT is a simulation of actual cooking activ-ities in communactiv-ities. Intend at the design phase for relatively fast feedback on design modifications. The WBT consists of three phases:
- The first phase is the high power test or cold-start, the tester begins with the stove at room temperature and uses a pre-weighed bundle of wood or other fuel to boil a measured quantity of water in a standard pot.
- The second phase, the high-power test or hot-start, follows immediately after the first while stove is still hot. Again, the tester uses aa pre-weighed bundle of fuel to boil a measured quantity of water in a standard pot.
- The third phase or low power test follows immediately from the second. Here, the tester determines the amount of fuel required to simmer a meas-ured amount of water at just below boiling for 45 minutes. This step simu-lates the long cooking of legumes or pulses common throughout much of the world.
The same initial charge is used for the boiling and simmering of the water throughout the test, no other fuel is added.
Thermal efficiency and emissions data were collected only for high-power cold start and low-power. The hot start was omitted to save testing time. In the high power cold start the test begins with the cook stove, pot and water at am-bient temperature and uses a pre-weighed amount of charcoal to boil 5 liters of water in a standard pot. The low-power simmering phase continues immediately from the cold start and used to simmer water 3˚C below boiling temperature for 45 min. For stove with a door to control air supply, the door was kept open for high-power cold start test and closed during low power test.
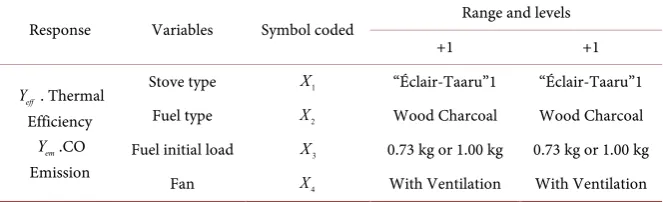
2.4. Experimental Design and Statistical Analysis
The experimental design for the study consisted of four factors (or independents variables): cook stove type (traditional stove, improve cook stove), fuel type (lump charcoal, briquettes), fuel initial load (maximum load, minimal load) and ventilation (with ventilation, without ventilation); each with two levels denoted by (“low (−1)” and “high (+1)”). Independent variable and their levels are pre-sented in Table 2. Analysis of variance (ANOVA) with Fisher’s statistical test (F-test) was applied to ascertain statistical significant difference in average values of factors and their interaction at a confidence level of 95% [35]. Further, New-man-Keuls test was conducted in order to identify factors means that are signif-icantly different from each other.
Table 2. Independent variables and their levels used in the experimental design.
Response Variables Symbol coded Range and levels
+1 +1
eff
Y . Thermal Efficiency
em
Y .CO Emission
Stove type X1 “Éclair-Taaru”1 “Éclair-Taaru”1
Fuel type X2 Wood Charcoal Wood Charcoal
Fuel initial load X3 0.73 kg or 1.00 kg 0.73 kg or 1.00 kg
Fan X4 With Ventilation With Ventilation
A general linear interaction model Equation (1) which accounts for the main effect of factor with their interaction effects was considered in this study [36] [37].
Usually, two values (called levels) of the X’s are used in the experiment for each factor. The response functions measured were emission Yem and efficiency
eff
Y . The responses were related to coded value (Xi) by linear interaction model shown in Equation (1).
( )
4 4 4 4 4 4
1 1 1 1 1 1
o i i ij i j ijk i j k ijkl i j k l m ijkl
i i j i j k
Y β β X β X X β X X X β X X X X ε
= = = = = =
= +
∑
+∑∑
+∑∑∑
+ +(1) with: i j i k j k≠ ; ≠ ; ≠
where
Y: is the predicted response of the process (% yield of thermal efficiency (Yeff) or CO emissions (Yem))
βo= the overall mean response
βi= the main effect for factor (i = 1, 2, 3, 4)
βij= the two-way interaction between the ith and the jth factors, βijk= the three-way interaction between the ith, jth, and kth factors βijkl= the four-way interaction between the ith, jth, kth, and lth factors.
( )
m ijkl
ε
: is the experimental error which is due to different variations of theen-vironment or uncontrollable variables.
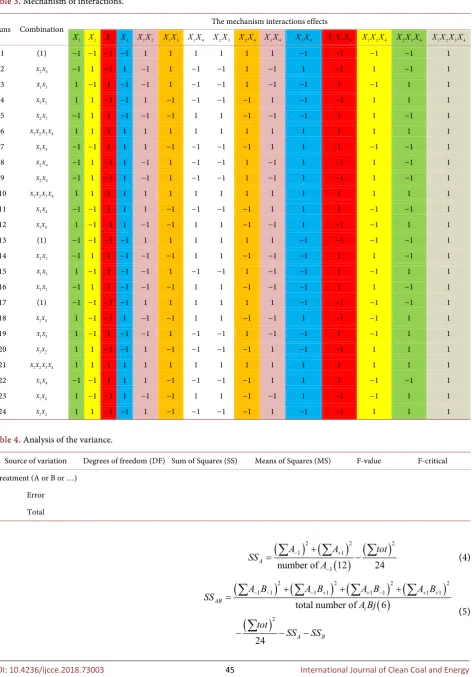
Table 3 presents the mechanism interaction effects
Columns of same color have the same combinations and produce the same result in the final answer.
0 0 0 0 1 2 3 4
x x x x = (1): indicates that the 4 factors are at their low level
1 1
1 2 1 2
x x =x x : indicates that the 2 factors are at their highest level as well as for
1 3
x x , x x2 3, x x2 4, … 1 1 1 1
1 2 3 4 1 2 3 4
x x x x =x x x x : indicates that the 4 factors are at their highest level. Table 4 presents the general content of an ANOVA table.
(
)
number of levels 1 2 1 1
df = − = − =
(
)
(
)
total number of tests number of tests without repetition 1 24 8 1 15
error
df = −
− = − − = (2)
(
)
number of tests 1 24 1
tot
df = − = − (3)
Table 3. Mechanism of interactions.
Runs Combination The mechanism interactions effects
1
X X2 X3 X4 X X1 2 X X1 3 X X1 4 X X2 3 X X2 4 X X3 4 X X3 4 X X X1 2 4 X X X1 3 4 X X X2 3 4 X X X X1 2 3 4
1 (1) −1 −1 −1 −1 1 1 1 1 1 1 −1 −1 −1 −1 1 2 x x2 4 −1 1 −1 1 −1 1 −1 −1 1 −1 1 −1 1 −1 1
3 x x1 3 1 −1 1 −1 −1 1 −1 −1 1 −1 −1 1 −1 1 1
4 x x1 2 1 1 −1 −1 1 −1 −1 −1 −1 1 −1 −1 1 1 1
5 x x2 3 −1 1 1 −1 −1 −1 1 1 −1 −1 −1 1 1 −1 1
6 x x x x1 2 3 4 1 1 1 1 1 1 1 1 1 1 1 1 1 1 1
7 x x3 4 −1 −1 1 1 1 −1 −1 −1 −1 1 1 1 −1 −1 1
8 x x2 4 −1 1 −1 1 −1 1 −1 −1 1 −1 1 −1 1 −1 1
9 x x2 4 −1 1 −1 1 −1 1 −1 −1 1 −1 1 −1 1 −1 1
10 x x x x1 2 3 4 1 1 1 1 1 1 1 1 1 1 1 1 1 1 1
11 x x3 4 −1 −1 1 1 1 −1 −1 −1 −1 1 1 1 −1 −1 1
12 x x1 4 1 −1 −1 1 −1 −1 1 1 −1 −1 1 −1 −1 1 1
13 (1) −1 −1 −1 −1 1 1 1 1 1 1 −1 −1 −1 −1 1 14 x x2 3 −1 1 1 −1 −1 −1 1 1 −1 −1 −1 1 1 −1 1
15 x x1 3 1 −1 1 −1 −1 1 −1 −1 1 −1 −1 1 −1 1 1
16 x x2 3 −1 1 1 −1 −1 −1 1 1 −1 −1 −1 1 1 −1 1
17 (1) −1 −1 −1 −1 1 1 1 1 1 1 −1 −1 −1 −1 1 18 x x1 4 1 −1 −1 1 −1 −1 1 1 −1 −1 1 −1 −1 1 1
19 x x1 3 1 −1 1 −1 −1 1 −1 −1 1 −1 −1 1 −1 1 1
20 x x1 2 1 1 −1 −1 1 −1 −1 −1 −1 1 −1 −1 1 1 1
21 x x x x1 2 3 4 1 1 1 1 1 1 1 1 1 1 1 1 1 1 1
22 x x3 4 −1 −1 1 1 1 −1 −1 −1 −1 1 1 1 −1 −1 1
23 x x1 4 1 −1 −1 1 −1 −1 1 1 −1 −1 1 −1 −1 1 1
[image:7.595.67.540.76.754.2]24 x x1 2 1 1 −1 −1 1 −1 −1 −1 −1 1 −1 −1 1 1 1
Table 4. Analysis of the variance.
Source of variation Degrees of freedom (DF) Sum of Squares (SS) Means of Squares (MS) F-value F-critical Treatment (A or B or …)
Error Total
(
) (
)
( )
(
)
2 2 2
1 1
1
number of 12 24
A
A A tot
SS
A
− +
−
+
−
=
∑
∑
∑
(4)(
) (
) (
) (
)
( )
(
)
2 2 2 2
1 1 1 1 1 1 1 1
2
total number of 6
24 AB
i
A B
A B A B A B A B
SS
A Bj tot
SS SS
− − + − + + + − + + +
=
− − −
∑
∑
∑
∑
∑
(5)( )
2(
)
21 24
tot
tot tot
SS =
∑
−∑
(6)1
n error tot i i
SS =ss −
∑
= ss (7)A A
A
SS MS
df
= (8)
( )
Ratio or A
Value A
error
MS F
MS
= (9)
F-critical is obtained by looking at the fisher table (at the 5% level) between the value given by the DF line of the numerator and DF column of the denomi-nator.
where:
df is degrees of freedom SS is Sum of Squares MS is Means of Squares
3. Results and Discussion
3.1. Results
The 2-levels half fractional factorial design was employed to assess the effects of the independent variables on the response functions Y. Therefore a total of 24-1 × 3 = 24 runs of randomize experiments was conducted. The experimental plan which contains the run of test, the factors model, the fuel load used for each test and the responses Yeff and Yem corresponding respectively to thermal
effi-ciency and CO emissions are in Table 5.
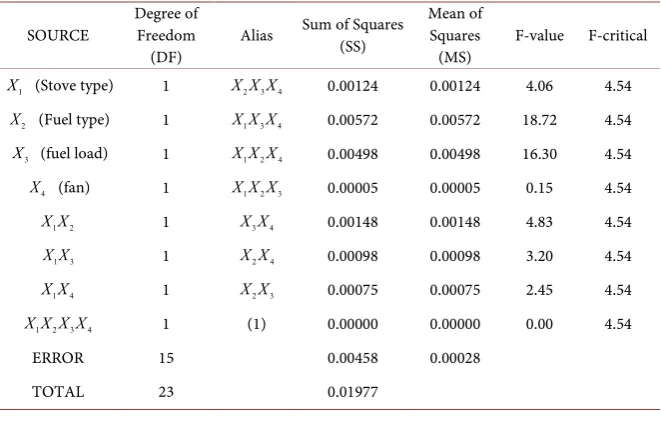
3.2. Discussion: Interpretation of Results by ANOVA Analysis
Analysis of variance with Fischer’s statistical test (F-test) was applied to establish the influence of the independent parameters on the studied responses.The interpretation of results is based on compared the F-value and F-critical. It is found that in Table 6 the fuel type
( )
X2 has the highest influence onthermal efficiency, followed by the fuel load
( )
X3 and the interaction stovetype-fuel type
(
X X1 2)
or the alias fuel load-fan(
X X3 4)
, respectively.Alias are interactions which have the same effect on the response simulta-neously with the source. To know which of fuel type (Typha lump charcoal or wood charcoal) and fuel load (minimal or maximal load) or which of interaction
(
X X1 2)
or(
X X3 4)
provide better effect on thermal efficiency, we calculatethe mean of thermal efficiency for each one. The average of each of the levels of the main factors X2 (fuel type) and X3 (initial fuel load) is in Table 7.
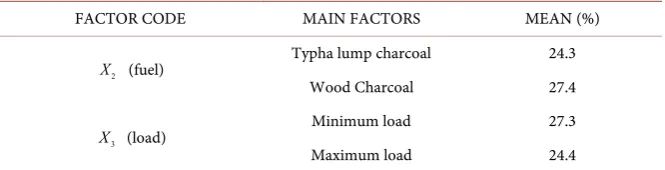
In Table 7, extraction of the average of each level, we show a significant dif-ference between the levels. The level with the highest mean is the optimum level “PANDEY et al. (2014)” Therefore, from the above analysis, it is observed that charcoal and minimum load (fill in under the combustion chamber holes) are parameters which mainly affect the thermal efficiency.
Table 5. Experimental plan with responses.
Runs coded values weight Fuel (kg) eff
Y (%) Yem (kg/s) time (s) Boiling
1
X X2 X3 X4 CO boiling CO simmer
1 −1 −1 −1 −1 0.73 27.5 74.5 × 10⁻⁶ 38.8 × 10⁻⁶ 2280 2 −1 1 −1 1 0.50 29.5 21.2 × 10⁻⁶ 9.67 × 10⁻⁶ 1080 3 1 −1 1 −1 1.00 21.1 40.7 × 10⁻⁶ 28.8 × 10⁻⁶ 3000 4 1 1 −1 −1 0.50 31.0 11.2 × 10⁻⁶ 3.00 × 10⁻⁶ 1740 5 −1 1 1 −1 0.73 22.4 5.67 × 10⁻⁶ 0.83 × 10⁻⁶ 2220 6 1 1 1 1 0.73 26.7 22.7 × 10⁻⁶ 3.33 × 10⁻⁶ 1260 7 −1 −1 1 1 1.00 21.9 34.5 × 10⁻⁶ 16.8 × 10⁻⁶ 1560 8 −1 1 −1 1 0.50 27.3 0.83 × 10⁻⁶ 9.83 × 10⁻⁶ 1020 9 −1 1 −1 1 0.50 29.2 19.0 × 10⁻⁶ 8.33 × 10⁻⁶ 1140 10 1 1 1 1 0.73 27.3 14.0 × 10⁻⁶ 3.67 × 10⁻⁶ 900 11 −1 −1 1 1 1.00 22.7 13.2 × 10⁻⁶ 6.17 × 10⁻⁶ 1800 12 1 −1 −1 1 0.73 24.4 14.5 × 10⁻⁶ 7.50 × 10⁻⁶ 1680 13 −1 −1 −1 −1 0.73 26.1 44.5 × 10⁻⁶ 44.5 × 10⁻⁶ 2400 14 −1 1 1 −1 0.73 20.9 34.2 × 10⁻⁶ 6.67 × 10⁻⁶ 1980 15 1 −1 1 −1 1.00 25.9 27.3 × 10⁻⁶ 14.5 × 10⁻⁶ 2580 16 −1 1 1 −1 0.73 26.0 46.8 × 10⁻⁶ 8.83 × 10⁻⁶ 1800 17 −1 −1 −1 −1 0.73 23.6 106.2 × 10⁻⁶ 74.5 × 10⁻⁶ 2940 18 1 −1 −1 1 0.73 23.6 16.8 × 10⁻⁶ 10.7 × 10⁻⁶ 1440 19 1 −1 1 −1 1.00 24.6 23.2 × 10⁻⁶ 12.7 × 10⁻⁶ 2880 20 1 1 −1 −1 0.50 29.5 8.33 × 10⁶ 6.50 × 10⁻⁶ 1860 21 1 1 1 1 0.73 29.0 11.0 × 10⁻⁶ 0.83 × 10⁻⁶ 840 22 −1 −1 1 1 1.00 24.4 73.3 × 10⁻⁶ 22.7 × 10⁻⁶ 1020 23 1 −1 −1 1 0.73 25.9 22.3 × 10⁻⁶ 18.0 × 10⁻⁶ 1860 24 1 1 −1 −1 0.50 29.8 20.5 × 10⁻⁶ 13.7 × 10⁻⁶ 2040
Table 6. ANOVA thermal efficiency.
SOURCE Degree of Freedom
(DF) Alias
Sum of Squares (SS)
Mean of Squares
(MS) F-value F-critical
1
X (Stove type) 1 X X X2 3 4 0.00124 0.00124 4.06 4.54
2
X (Fuel type) 1 X X X1 3 4 0.00572 0.00572 18.72 4.54
3
X (fuel load) 1 X X X1 2 4 0.00498 0.00498 16.30 4.54
4
X (fan) 1 X X X1 2 3 0.00005 0.00005 0.15 4.54
1 2
X X 1 X X3 4 0.00148 0.00148 4.83 4.54
1 3
X X 1 X X2 4 0.00098 0.00098 3.20 4.54
1 4
X X 1 X X2 3 0.00075 0.00075 2.45 4.54
1 2 3 4
X X X X 1 (1) 0.00000 0.00000 0.00 4.54
ERROR 15 0.00458 0.00028
TOTAL 23 0.01977
[image:9.595.208.539.518.731.2]Table 7. Optimal levels of thermal efficiency.
FACTOR CODE MAIN FACTORS MEAN (%)
2
X (fuel) Typha lump charcoal 24.3 Wood Charcoal 27.4
3
X (load) Minimum load 27.3 Maximum load 24.4
For interactions (X X1 2or X X3 4) which have significant effect on thermal
efficiency, extraction of their average is not enough to concluded on which inte-raction have really significant effect.
The ANOVA study only can’t distinguish differences due to interaction fac-tors in the responses. To know which interaction at which levels has significance effect, we do the Newman-Keuls test and results are in Table 8.
Newman-Keuls test in Table 8 shows that three interactions
(“Éclair-Taaru”1-charcoal, minimum initial load-without fan and minimum ini-tial load-with fan) generate a very near mean and have the highest significant ef-fect on thermal efficiency. On the other hand, interaction
“Éclair-Taaru”1-charcoal is the optimal level whit 28.9% of thermal efficiency. The interaction minimum initial load-with fan has lower effect among signifi-cant interaction factors. So fan does not make any difference to the thermal effi-ciency. When the results are very close, the Newman-keuls test says that interac-tions have same effect on the response: either their effect is significant or not.
To maximize the thermal efficiency in this study, we should use “Éclair-Taaru”1 stove, with minimal initial load of wood charcoal fuel and with or without fan. For this first analysis, secondary air stove (“Éclair-Taaru”1) is better than stove without secondary air (“Éclair-Taaru”2).
Therefore the efficiency of charcoal cookstove depends on the nature of the charcoal (lump charcoal or wood charcoal), the initial load of charcoal and the presence of secondary air.
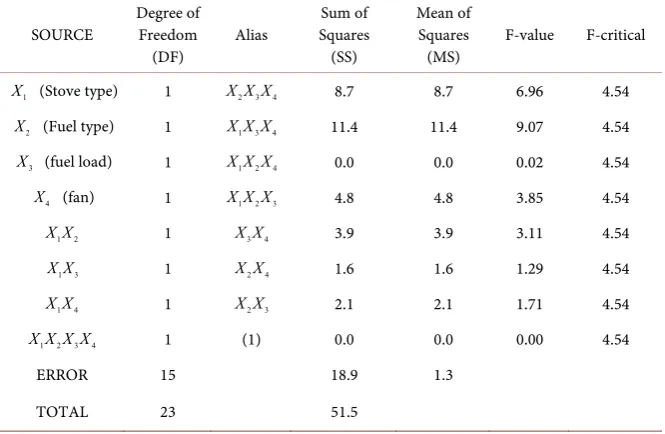
Table 9 shows that X1 (Stove type) and X2 (Fuel type) are factors which
have significant effect on CO emissions during cold start. The most important effect is produced by fuel type. To know which fuel between wood charcoal and typha lump charcoal and which stove (“Éclair-Taaru”1 or “Éclair-Taaru”2) pro-vide the best effect, we calculate the mean of each level. Table 10 presents the results.
As what is desired here is to minimize CO emissions, extraction mean of analysis of variance showed a significant difference between the levels and the optimal levels of significant factors are “Éclair-Taaru”1 and wood charcoal. The “Éclair-Taaru”2 cookstove produce much CO and lump charcoal too. The dif-ference between stoves is the secondary air. So this secondary air contributes to reduce CO emissions during the boiling phase. The significant factors are factors which minimize CO emissions in the boiling phase.
Table 8. Optimal levels of thermal efficiency (interactions effect).
Factors combination INTERACTIONS Mean (%)
1 2
X X (Stove – fuel)
“Éclair-Taaru”2-Typha lump charcoal 24.4 “Éclair-Taaru”2-Wood charcoal 25.9 “Éclair-Taaru”1-Typha lump charcoal 24.2 “Éclair-Taaru”1-Wood Charcoal 28.9
3 4
X X (load – fan)
[image:11.595.207.540.290.507.2]Minimum initial load-Without fan 27.9 Minimum initial load-With fan 26.6 Maximum initial load-Without fan 23.5 Maximum initial load-With fan 25.3
Table 9. CO emissions during boiling phase ANOVA.
SOURCE Degree of Freedom
(DF) Alias
Sum of Squares (SS)
Mean of Squares
(MS) F-value F-critical
1
X (Stove type) 1 X X X2 3 4 8.7 8.7 6.96 4.54
2
X (Fuel type) 1 X X X1 3 4 11.4 11.4 9.07 4.54
3
X (fuel load) 1 X X X1 2 4 0.0 0.0 0.02 4.54
4
X (fan) 1 X X X1 2 3 4.8 4.8 3.85 4.54
1 2
X X 1 X X3 4 3.9 3.9 3.11 4.54
1 3
X X 1 X X2 4 1.6 1.6 1.29 4.54
1 4
X X 1 X X2 3 2.1 2.1 1.71 4.54
1 2 3 4
X X X X 1 (1) 0.0 0.0 0.00 4.54
ERROR 15 18.9 1.3
TOTAL 23 51.5
Table 10. Optimum levels of CsO at the boiling.
FACTOR CODE MAIN FACTORS MEAN (kg.s−1) (Stove type) “Éclair-Taaru”1 19.3 × 10
−6 “Éclair-Taaru”2 39.5 × 10⁻⁶ (Fuel type) Wood charcoal 18.0 × 10
−6 Typha lump charcoal 41.0 × 10⁻⁶
The other factors or interactions factors have not significant effect on CO emissions during the boiling phase. Those factors which are not significant on CO emissions can be used at the level desired by the experimenter or the cooker.
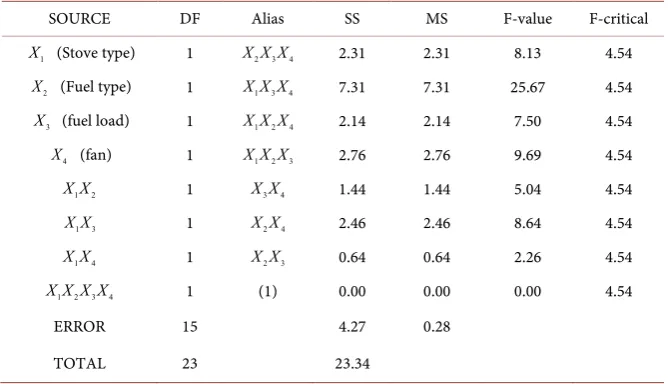
In Table 11, except the interaction X X1 4 or X X2 3 all factors and
interac-tion have significance effect on CO emissions during the simmer. But the most
[image:11.595.208.540.540.629.2]Table 11. CO emissions during simmer phases ANOVA.
SOURCE DF Alias SS MS F-value F-critical
1
X (Stove type) 1 X X X2 3 4 2.31 2.31 8.13 4.54
2
X (Fuel type) 1 X X X1 3 4 7.31 7.31 25.67 4.54
3
X (fuel load) 1 X X X1 2 4 2.14 2.14 7.50 4.54
4
X (fan) 1 X X X1 2 3 2.76 2.76 9.69 4.54
1 2
X X 1 X X3 4 1.44 1.44 5.04 4.54
1 3
X X 1 X X2 4 2.46 2.46 8.64 4.54
1 4
X X 1 X X2 3 0.64 0.64 2.26 4.54
1 2 3 4
X X X X 1 (1) 0.00 0.00 0.00 4.54
ERROR 15 4.27 0.28
TOTAL 23 23.34
important effect is provided by the fuel type. To know which fuel between wood charcoal and typha lump charcoal provide the best effect; for this purpose, the test of Newman-keuls is necessary.
In Table 12 average levels of different factors which have significant influence on CO emission help us select the optimal factors to minimize emissions.
Table 12 groups together the mean of main factors and Newman-keuls test results (interactions effects). It is found that among the main of significant fac-tors: “Éclair-Taaru”1 stove, wood charcoal, with maximum initial load and presence of fan are optimal level because they minimize CO emissions during simmering phase.
So wood charcoal, maximum initial load and presence of fan (ventilation) have good effect on CO emissions during the simmer phase when they are used on the “Éclair-Taaru”1 stove however this is not the same on the “Éclair-Taaru” 2 (without secondary air inlets). Typha lump charcoal with minimum initial load, and without fan have bad effect on CO emissions during the simmer when they are used on “Éclair-Taaru”2. The secondary air has positive effect on CO emissions and type of fuel has the higher effect. The control of type of stove and type of fuel are very important during the test or during the cooking.
Fuel type
( )
X2 and fan( )
X4 present the higher effect on water boilingtime.
The boiling time ANOVA in Table 13 shows that both factors (fuel type and fan) have a significant effect on the boiling time of the water. The fan has a very significant effect (92.40) while the fuel type has a slightly significant effect (35.95). Remember that the production and quantity of heat depends on these two factors (oxygen and fuel). These two factors entering into the combustion reaction produce heat used to boil the water. On the other hand, we do not know at what level the type of fuel and the fan allow us to reach boiling in record time. It is thanks to Table 14 that we have decided on this fact.
Table 12. Optimal levels of CO at simmer.
FACTOR CODE MAIN FACTORS MEAN (kg∙s−1)
1
X (Stove type) “Éclair-Taaru” 1 10.33 × 10 −6 “Éclair-Taaru” 2 20.67 × 10⁻⁶
2
X (Fuel type) Wood charcoal 6.33 × 10 −6 Typha lump charcoal 24.67 × 10⁻⁶
3
X (load) Maximum initial load 10.50 × 10 −6 Minimum initial load 20.50 × 10⁻⁶
4
X (Fan) With fan 9.83 × 10
−6 Without fan 21.17 × 10⁻⁶ INTERACTIONS MEAN (kg∙s−1)
2 3
X X (Fuel type—load)
Typha lump charcoal—Min load 32.33 × 10⁻⁶ Typha lump charcoal—Max load 17.00 × 10⁻⁶ Wood charcoal—Min load 8.50 × 10⁻⁶ Wood charcoal—Max load 4.00 × 10⁻⁶
4 1
X X (Stove type—fan)
“Éclair-Taaru”2—without fan 29.00 × 10⁻⁶ “Éclair-Taaru”2—With fan 12.17 × 10⁻⁶ “Éclair-Taaru”1—Without fan 13.17 × 10⁻⁶ “Éclair-Taaru”1—With fan 7.33 × 10⁻⁶
Table 13. Time to boil water ANOVA.
SOURCE DF Alias SS MS F-value F-critical
1
X (Stove type) 1 X X X2 3 4 8.17 8.17 0.44 4.54
2
X (Fuel type) 1 X X X1 3 4 661.50 661.50 35.95 4.54
3
X (fuel load) 1 X X X1 2 4 1.50 1.50 0.08 4.54
4
X (fan) 1 X X X1 2 3 1700.17 1700.17 92.40 4.54
1 2
X X 1 X X3 4 48.17 48.17 2.62 4.54
1 3
X X 1 X X2 4 20.17 20.17 1.10 4.54
1 3
X X 1 X X2 3 0.17 0.17 0.01 4.54
1 2 3 4
X X X X 1 (1) 0.00 0.00 0.00 4.54
ERROR 15 276.00 18.40
[image:13.595.206.542.429.611.2]TOTAL 23 2715.83
Table 14. Optimum levels of boiling time.
FACTOR CODE MAIN FACTORS MEAN (s)
(Fan) With fan 1300.20
Without fan 2310.00
(Fuel type) Wood charcoal 1489.80 Typha lump charcoal 2119.80
The calculation of the mean of each level of the different factors that have a significant effect on the boiling time of the water helps us to know the optimum level and to choose the best factors to cook with this stove and to make the best profit. Table 14 shows that with fan and wood charcoal the boiling time is low (1300.2 s with fan and 1489.8 s with charcoal) compared to 2310 s when no fan is used and 2119.8 s with typha lump charcoal. This allows us to say that the venti-lation contributes to accelerate the boiling water by increasing the quantity of heat transmitted to the pot.
Table 15 summarizes the optimum factors levels that have a significant effect on thermal efficiency, CO emissions and boiling time in the 24 tests of our expe-rimental design. The fact is that it is easy to say that the “Éclair-taaru”1 stove, the charcoal fuel and the ventilation are the optimum levels factors that give us the best results in thermal efficiency, low CO emissions and low boiling time. On the other hand for the initial fuel load, the results are equal for both levels, which can make the choice difficult. But since it is sought to minimize the costs of use, it is chosen to load the stove with a minimum charge. In this study, PM2.5 emis-sions are not taken into account because they are low when the fuel is carbo-nized (case of wood charcoal and lump charcoal) and it is not interesting to study the effect of our parameters on the latter. According some researchers, “the coal has little impact on fine particle pollution, giving it a harmless image; while the main problem of coal is the massive emission of CO2 the PM2.5 emis-sions of charcoals were lower than PM2.5 from current biomass cookstoves. However, the CO emission was very highat which 2 times or even more than 20 times higher than some normal cooking stoves” [38][39].
These results are confirmed in our study giving up to 39.5 × 10⁻⁶ kg∙s−1 of CO emission with normal cookstove and 19.3 × 10⁻⁶ kg∙s−1 of CO emission with sec-ondary air cookstove (Table 10). Similarly, we have at Table 12 between 20 and 29 kg∙s−1 of CO emission with the normal cookstove and between 7 and 13 kg∙s−1 of CO emission with secondary air cookstove.
To confirm the reliability of the methodology and the results of optimum fac-tors, validity tests are performed using the optimal combination of these four factors. The results of the validity test are given in the Table 16.
The three tests of validity give us conclusive results because they are between the extreme values of the 24 tests did in this experience. So it is possible to si-tuate their mean in relation to IWA performance tiers [40]. So on 4 tiers defined by IWA, our results are in the middle (for thermal efficiency and CO at the boiling) and on a good level for CO at the simmer. For boiling time, we are un-der the optimal levels of Table 14 (1300.2 s) and allows us to confirm that these factors are the best possible for this cookstove.
This study clearly shows that wood charcoal is the best fuel for charcoal cookstoves. But with the DOE and ANOVA, we understand that, when it is used at different levels of charge, it give different responses on thermal efficiency and CO emissions. The secondary air cookstove “Éclair-Taaru”1 used with ventila-tion exhibit very low emissions and good efficiency with minimum load of wood
Table 15. Recapitulation of optimal parameters which gives us best results.
Responses Optimal parameters and their levels
Thermal efficiency “Éclair-taaru”1 Wood Charcoal Min load (0.50 kg) With or Without fan
CO emissions to boil “Éclair-taaru”1 Wood Charcoal Min load (0.50 kg) Max load (0.73 kg) With fan CO emissions to
simmer “Éclair-taaru”1 Wood Charcoal Max load (0.73 kg) With fan Time to boil water “Éclair-taaru”1 “Éclair-taaru”2 Wood Charcoal Max load (0.73 kg) Min load (0.50 kg) With fan
Table 16. Validity tests.
N˚ test Thermal efficiency (%) CO at boiling (kg∙s−1) CO at simmer (kg∙s−1) Boiling time (s) V1 26.60 7.17 × 10⁻⁶ 6.50 × 10⁻⁶ 1020 V2 26.50 12.50 × 10⁻⁶ 8.83 × 10⁻⁶ 1140 V3 28.00 13.30 × 10⁻⁶ 8.50 × 10⁻⁶ 1020 Mean 27.03 11.00 × 10⁻⁶ 8.00 × 10⁻⁶ 1060.2
Tier 2 2 3
charcoal but with maximum load of wood charcoal, it exhibit high emissions with low efficiency of stove.
It is safe to say that despite the nature of charcoal and ventilation, secondary air is responsible for reducing CO emissions during testing and moderately im-proving thermal efficiency.
It is important to note that in many classic studies, results discussion are li-mited only on the main effect of studied parameters and does not take into ac-count what interactions can bring. This type of study is found in “test results of cook stove performance” of MacCarty et al., 2010 [41] or in “comparative study of effect of different parameters on performance and emission of biomass cook stoves” of Kumar et al. 2013 they consider only the effect of individual factors on improved study cook stove. On the other hand, the studies focus on the external parameters (the dimensions of the combustion chamber, the quality of the ma-terial, ...) to improve or to have a good quality of stove [23]. With the DOE, we were able to exploit the internal parameters of the cookstove, which allowed them to be optimized in order to make the most profit without having to modify the stove in question or a dimension of the parts of the stove. In our case, thanks to the DOE, we went further taking into account the effects of the interactions on the thermal efficiency and the CO emissions. These results allow us to ob-serve that even if an isolated factor does not have a significant effect on one re-sponse, it can have one when it interacts with other factors.
4. Conclusions
The effects of different parameters on performance and CO emissions of two
charcoal cookstoves have been investigated. Parameters such as fuel type, fuel load, secondary air inlet and ventilation were examined using a traditional cookstove (“Éclair-Taaru”2) and improved cookstove (“Éclair-Taaru”1). The “Design of Experiment” methodology has been used to determine the effect of parameters level and the effect of interactions parameters on responses.
The ANOVA and the Newman-keuls test allow us to understand how to profit from a cookstove (by determine the optimal level of parameters to used). The improved cookstove is better than the traditional cookstove because it saves charcoal (minimum load, maximum efficiency), it is clean at this level of load (it emits less CO2) but it must be used under ventilation.
However, during the experiences, the peak of CO (106 × 10−6 kg∙s−1 at the boiling phase and 74.5 × 10⁻⁶ kg∙s−1 at the simmer phase) is obtained with the combination “Éclair-Taaru”2, typha lump charcoal, maximum load and without ventilation. The lowest CO (0.833 × 10⁻⁶ kg∙s−1) is obtained with the combination “Éclair-Taaru”2, wood charcoal, minimum load without ventilation or the com-bination “Éclair-Taaru”1, wood lump charcoal, minimum load with ventilation during simmer phase. For thermal efficiency, the best combination does not al-ways for CO emissions. Since human health is what that matters, we will choose the factors that will lower emissions of CO for the entire period of cooking, even if it reduces the thermal efficiency of the stove.
This study clearly shows that wood charcoal is the best fuel for charcoal cookstoves at minimum charge of combustion chamber. But with the DOE and ANOVA, we understand that, when it is used on different cookstoves, it give different responses on thermal efficiency and emissions. The “Éclair-Taaru”1 cookstove used with ventilation exhibits very low emissions and good efficiency with minimum load, but with maximum load of wood charcoal, it exhibits high emissions with low efficiency of stove.
The ventilation brings much oxygen which accelerates combustion reaction, converting CO to CO2. Finally, wood charcoal is definitely fuel that best meets objectives of thermal efficiency and CO emissions if we look at the results. Therefore factors to be used together to satisfy our need for heat or for cooking while maintaining good health is “Éclair-Taaru”1 stove (container secondary air inlet), with minimum initial load of wood charcoal and with proper ventilation.
This Design of Experiments method can be extended to the study of CO2 emissions and breathable particles (PM2.5) to know if PM2.5 is negligible at any level.
Conflicts of Interest
The authors declare no conflicts of interest regarding the publication of this pa-per.
References
[1] Sander, K., Haider, S.W., Hyseni, B. and Araya, M.K. (2011) Wood-Based Biomass
Energy Development for Sub-Saharan Africa: Issues and Approaches, Energy Sector
Management Assistance Program (ESMAP). World Bank, Washington DC.
http://documents.worldbank.org/curated/en/2011/09/17121432/wood-based-bioma
ss-energy-development-sub-saharan-africa-issues-approaches.
[2] World Health Organization (WHO) (2012) Health Effects of Black Carbon.
http://www.euro.who.int/__data/assets/pdf_file/0004/162535/e96541.pdf
[3] Jacobson, M.Z. (2014) Effects of Biomass Burning on Climate, Accounting for Heat
and Moisture Fluxes, Black and Brown Carbon, and Cloud Absorption Effects,
Journal of Geophysical Research: Atmospheres, 119, 8980-9002.
https://doi.org/10.1002/2014JD021861
[4] Bruce,N.G., Rehfuess, E.A. and Smith, K.R. (2011) Household Energy Solutions in
Developing Countries, In: Nriagu, J.O., Ed., Encyclopedia of Environmental Health,
Elsevier 3, 62-75. https://doi.org/10.1016/B978-0-444-52272-6.00717-0
[5] Brink, S. (2004) WHO Repport: Indoor Air Pollutions Is Greatest Environmental
Health Risk.
https://news.nationalgeographic.com/news/2014/03/140325-world-health-organizat
ion-indoor-fuel-pollution-death/
[6] Stanistreet, D., Hyseni, L., Bashin, M., Sadumah, I., Pope, D., Sage, M. and Bruce, N.
(2015) The Role of Mixed Methods in Improved Cookstove Research. Journal of
Health Communication, 20, 84-93. https://doi.org/10.1080/10810730.2014.999896
[7] Hanna, R., Duflo, E. and Greenstone, M. (2016) Up in Smoke: The Influence of
Household Behavior on the Long-Run Impact of Improved Cooking Stoves.
Amer-ican Economic Journal: Economic Policy, American Economic Association, 8, 80-114.
[8] Patelarou, E., Tzanakis, N. and Kelly, F.J. (2015) Exposure to Indoor Pollutants and
Wheeze and Asthma Development during Early Childhood. International Journal
of Environmental Research and Public Health, 12, 3993-4017.
https://doi.org/10.3390/ijerph120403993
[9] World Health Organization (WHO) (2015) World Health Statistics.
http://apps.who.int/iris/bitstream/handle/10665/170250/9789240694439_eng.pdf;jse
ssionid=28E9FBC61BEF917CD40825CE75121333?sequence=1
[10] Africa Clean Cooking Energy Solution Initiative (ACCES) (2014) Clean and
im-proved cooking in Sub-Saharan Africa, Report N°98664.
http://documents.worldbank.org/curated/en/164241468178757464/pdf/98664-REVI
SED-WP-P146621-PUBLIC-Box393185B.pdf
[11] Practical Action (2014) Poor People’s Energy Outlook 2014: Key Messages on
Energy for Poverty Alleviation, Rugby, UK, Practical Action Publishing.
http://www.sun-connect-news.org/fileadmin/DATEIEN/Poor-Peoples-energy-outlo ok-2014.pdf
[12] Système d’Information Énergétique du Sénégal (SIE Sénégal). 2013.
http://www.compagnie3e.com/images/stories/documentation/energie-conventionne
lle/Rapport_SIE_Senegal.pdf
[13] Deuxième projet de gestion durable et participative des énergies traditionnelles et
de substitution (PROGEDE 2), Réalisation d’une enquête nationale portant sur la consommation et les pratiques des ménages en combustibles domestiques. 2014.
http://www.ecreee.org/sites/default/files/event-att/progede_ii-_amenagement_gdf_e
cree_versionfinale.pdf
[14] Jeuland, M.A. and Pattanayak, S.K. (2012) Benefits and Costs of Improved
Cooks-toves: Assessing the Implications of Variability in Health, Forest and Climate
Im-pacts. PLoS ONE, 7, e30338. https://doi.org/10.1371/journal.pone.0030338
[15] Grieshop, A.P., Marshall, J.D. and Kandlikar, M. (2011) Health and Climate
Bene-fits of Cook Stove Replacement Options. Energy Policy, 39, 7530-7542.
https://doi.org/10.1016/j.enpol.2011.03.024
[16] Agyei-Agyemang, A., Tawiah, P.O. and Nyarko, F. (2014) Efficient Charcoal Stoves:
Enhancing Their Benefits to a Developing Country Using an Improved Design
Ap-proach. International Journal of Engineering Trends and Technology, 15, 94-100.
https://doi.org/10.14445/22315381/IJETT-V15P219
[17] Komolafe, C.A. and Awogbemi, O. (2010) Fabrication and Performance Evaluation
of an Improved Charcoal Cooking Stove. The Pacific Journal of Science and
Tech-nology, 11, 51-58.
[18] Pesambili, C., Magessa, F. and Mwakabuta, S.N. (2003) Szawa Charcoal Stove
De-signed for Efficient Use of Charcoal. International Conference on Industrial Design
Engineering USDM, Dar es Salaam, 17-18 July 2003, 91-97.
http://stoves.bioenergylists.org/stovesdoc/Tanzania/11_Mwakabuta.pdf
[19] Umogbai, V.I. and Orkuma, J.G. (2011) Development and Evaluation of a Biomass
Stove. Journal of Emerging Trends in Engineering and Applied Sciences, 2, 514-520.
[20] Massé, R. (2011) Designing an Improved Domestic Cookstove on a Charcoal Basis
in Sub Saharan Africa.
https://siteresources.worldbank.org/EXTAFRREGTOPENERGY/Resources/717305-1266613906108/BiomassEnergyPaper_WEB_Zoomed75.pdf
[21] (2011) Partnership for Clean Indoor Air (PCIA).
http://www.pciaonline.org/files/PCIA-Results-2011-web.pdf
[22] Kshirsagar, M.P. (2009) Experimental Study for Improving Energy Efficiency of
Charcoal Stove. Journal of Scientific and Industrial Research, 68, 412-416.
[23] Still, D., Bentson, S., Lawrence, R.H. and Andreatta, D. (2015) Clean Burning
Bio-mass Cookstoves, Aprovecho Research Center.
http://file:///C:/Users/User/Downloads/CleanBurningBiomassCookstoves_2016%20 (2).pdf
[24] Tryner, J., Willson, B.D. and Marchese, A.J. (2014) The Effects of Fuel Type and
Stove Design on Emissions and Efficiency of Natural-Draft Semi-Gasifier Biomass
Cookstoves. Energy for Sustainable Development, 23, 99-109.
[25] Thirugnanasambandham, K., Sivakumar, V. and Maran, J.P. (2014) Optimization of
Electrocoagulation Process to Treat Biologically Pretreated Bagasse Effluent. Journal
of the Serbian Chemical Society, 79, 613-626. https://doi.org/10.2298/JSC130408074T
[26] Rushing, H., Andrew, K. and James, W. (2017) Design and Analysis of Experiments
by Douglas Montgomery: A Supplement for Using JMP(R). SAS Institute Inc., Cary.
https://www.sas.com/storefront/aux/en/spdesignanlysisjmp/66584_excerpt.pdf
[27] Bono, A., Sulaiman, J. and Rajalingam, S. (2014) Analysis of Optimal Injection
Moulding Process Parameters for Thin-Shell Plastic Product Using Response
Sur-face Methodology. Journal of Applied Sciences, 14, 3192-3201.
https://doi.org/10.3923/jas.2014.3192.3201
[28] El-Gendy, N.S., Deriase, S.F., Hamdy, A. and Abdallah, R.I. (2015) Statistical
Opti-mization of Biodiesel Production from Sunflower Waste Cooking Oil Using Basic
Heterogeneous Biocatalyst Prepared from Eggshells. Egyptian Journal of Petroleum,
24, 37-48.
[29] Miraculas, G.A., Bose, N. and Raj, R.E. (2014) Optimization of Process for Biodiesel
Extraction from Tamanuoil Using Design of Experiments. Journal of Renewable
Sustainable Energy, 6, Article ID: 033120.
[30] Mohagir, A.M., Bup, N.D., Abi, C.F., Kamga, R. and Kapseu, C. (2015) Optimiza-tion of Kernels PreparaOptimiza-tion CondiOptimiza-tions Involved in the Press ExtracOptimiza-tion of Shea (Vitellaria paradoxa Gaertner F.) Butter. American Journal of Food Science and Technology, 3, 103-110.
[31] Saravanakumar, K. and Kathiresan, K. (2014) Bioconversion of Lignocellulosic
Waste to Bioethanol by Trichoderma and Yeast Fermentation. 3 Biotech, 4,
493-499.https://doi.org/10.1007/s13205-013-0179-4
[32] Manivasagam, T.G., Magusin, P.C.M.M., Srinivasan, S., Krishnan, G., Kooi, B.J. and
Notten, P.H.L. (2014) Electrochemical Deuteration of Metastable MgTi Alloys: An
Effective Way to Inhibit Phase Segregation, Home. Advanced Energy Materials, 4,
1-7.https://doi.org/10.1002/aenm.201300590
[33] Werner, C. (2012) Portable Metal Stove for Households, Suitable for Various Pot
Sizes. Deutsche Gesellschaft für International Zusammenarbeit (GIZ) GmbH.
https://energypedia.info/images/5/51/ECLAIR_Benin_stove-factsheet_eng.pdf
[34] Kumar, A., Prasad, M. and Mishra, K.P. (2013) Comparative Study of Effect of
Dif-ferent Parameters on Performance and Emission of Biomass Cook Stoves.
Interna-tional Journal of Research in Engineering & Technology, 1, 121-126.
[35] El-Gendy, N.Sh., Hamdy, A. and Salem, S.A.A. (2014) An Investigation of Biodiesel
Production from Wastes of Seafood Restaurants. International Journal of
Biomate-rials, 2014, Article ID: 609624.https://doi.org/10.1155/2014/609624
[36] Armstrong, R.A., Eperjesi, F. and Gilmartin, B. (2002) The Application of Analysis
of Variance (ANOVA) to Different Experimental Designs in Optometry.
Ophthal-mic Physiological Optics, 22, 248-256.
https://doi.org/10.1046/j.1475-1313.2002.00020.x
[37] Lazic, S.E. (2008) Why We Should Use Simpler Models if the Data Allow This:
Re-levance for ANOVA Designs in Experimental Biology. BMC Physiology, 8, 16.
[38] Trépide, A. (2018) Arrêtons avec les “centrales à charbon allemandes”.
https://www.les-crises.fr/arretons-avec-les-centrales-a-charbon-allemandes/
[39] Li, J., Shan, M., Baumgartner, J., Carter, E., Ezzati, M. and Yang, X. (2014)
Labora-tory Study of Pollutant Emissions from Wood Charcoal Combustion for Indoor
Space Heating in China. 13th International Conference on Indoor Air Quality and
Climate, Hong Kong, 12 July 2014, 710-716.
https://experts.umn.edu/en/publications/laboratory-study-of-pollutant-emissions-fr
om-wood-charcoal-combus
[40] The Water Boiling Test: Version 4.2.2.
https://cleancookstoves.org/binary-data/DOCUMENT/file/000/000/399-1.pdf
[41] MacCarty, N., Still, D. and Ogle, D. (2010) Fuel Use and Emissions Performance of
Fifty Cooking Stoves in the Laboratory and Related Benchmarks. Energy for
Sus-tainable Development, 14, 161-171.https://doi.org/10.1016/j.esd.2010.06.002