Modeling Transfer Function of Electrical Power Lines for
Broadband Power Line Communication
Saad D. Bennani
Ecole Nationale des Sciences Appliquées, Fès, Marocco Email: [email protected]
Received September 29, 2011; revised November 23, 2011; accepted December 6, 2011
ABSTRACT
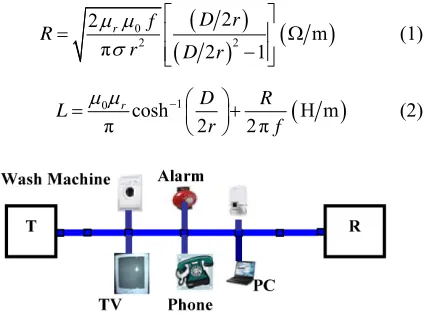
The indoor access network is characterized by several branches that cause many reflections. In this paper, we present an approach to model the transfer function of electrical power lines for broadband power line communication. The assum-ing channel consists of three wires, which is widely used in many countries. As an application of the proposed method, the effect of line length from transmitter to receiver, branched line length and number of branched are also studied. From the frequency response of the transfer function (magnitude and phase), it is seen that the position of notches and peaks in the magnitude responses are largely affected in terms of attenuation by the electrical network which consists of 15 branches.
Keywords: Power Line Communications; Transmission Line Theory; Magnitude Response and Branched Line
1. Introduction
The power-line communications (PLC) has been applied as a data transfer method in both public electricity dis-tribution networks and indoor disdis-tribution networks. The profile of these applications has been different. The de-vices developed for domestic use are mainly designed for the purpose of controlling electric devices at home. For
example, the current and most common functions (
Fig-ure 1) are: control of lights, fire alarming system and
heating controlling [1].
The design of an appropriate communication system, the choice of modulation and coding schemes, and the evaluation of performance, require the knowledge of the end-to-end PLC channel responses in a wide range of frequencies up to 75 MHz [2].
Several approaches for modelling the transfer charac- teristics of power lines can be found in literature. The most widely used model for the power line channel trans-
fer function H(f) is the multipath model proposed by Phi-
lipps [3] and Zimmermann [4].
Actually, the proposed model is the result of a top- down approach: the various parameters need to be deter- mined through measurements. As such, it is not suitable for the computation at first of the actual transfer function of a given link. Alternative models, based on the multi- conductor transmission line theory (MTL), have been proposed in the case of indoor channels [2-5].
The objective of this paper is to calculate the transfer function for a power line communications channel which
consists on fifty branches. As an application of the pro- posed method, the effect of line length from transmitter to receiver, branched line length and number of branched are also studied.
2. Influence of Line Length
2.1. Length from Transmitter to the Receiver
In this part, we are going to see the influence of line length on response of the PLC channel.
We consider a typical medium voltage line of a power line communications which consists of fifteen branches. The PLC network and all branches are formed by three conductors. All the lines have the following per unit length parameters [6] with:
0
2 2
2 2
m
π 2 1
r f D r
R
r D r
(1)
1
0 cosh H m
π 2 2π
r D R
L
r f
[image:1.595.327.540.563.722.2] (2)
2
F m
r D r
0 1
π
cosh
C (3)
0
1
0.06 S m
f
r
10
2 π 5.7257 10
G f C (4)
where, r is the radius of the conductors (r = 0.8 mm), D is
the distance between the conductors (D = 3.2 mm), is
the electric conductivity of the conductors ( = 5.5758 ×
107), µ is the magnetic permeability (
0
, µ0 =
4·10–7 H/m,
µr = 1), is the dielectric constant ( = 0r,
0 = 8.8542 × 10⁻¹² F/m).
The configuration under study is given in Figure 2
with ZL = 50 , Zg = 50 . The line length Transmitter-
receiver was varied as 48 m, 64 m, 80 m and 96 m.
Figures 3(a)-(d) shows the magnitude of the transfer
function versus frequency H(f) [6] relating the transmitter
and the receiver for 48 m, 64 m, 80 m and 96 m
respec-tively. From Figure 3 the peak values of transfer
func-tion were not attenuating significantly with either frequ- ency or line length. Any differences that are seen could be attributed to the finite losses due the line series resis- tance. The position of notches in the transfer function of medium voltage channel also does not depend on length from transmitter to receiver.
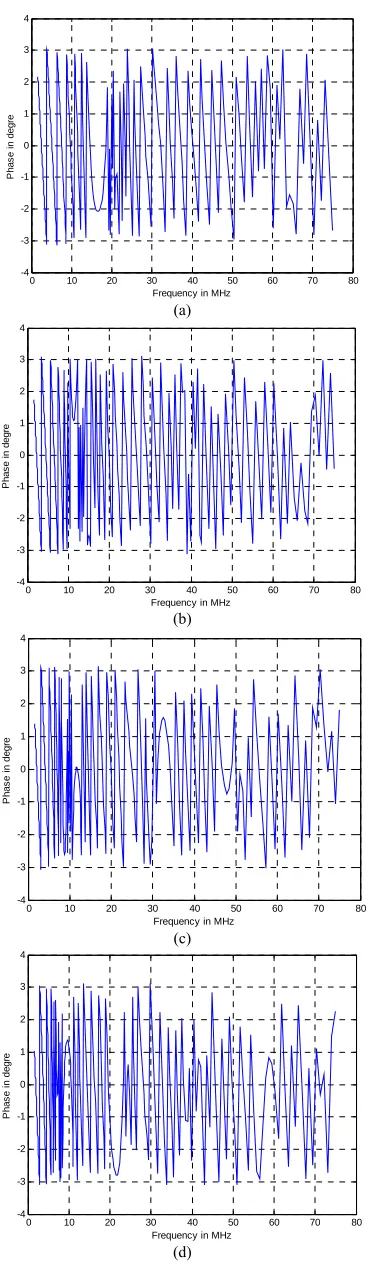
Figures 3(a)-(d) shows the corresponding phase re-
sponses. It is observed that as the line length increases there are rapid changes in the phase response. The effects of branch length are studied next.
2.2. Branched Length
We now consider the configuration as given in Figure 2;
i.e. the length of a line from transmitter to receiver was
kept constant at 48 m. The branched length was varied as
(Lbi = 2 m, 3 m, 4 m and 5 m for i = 1:15 branches) with
the distance between every branch is constant and equal to 3 m. The fifteen branches are terminated by open cir- cuits.
We calculate the transfer characteristics with respect to
the receiver [6]. Figure 4 show the corresponding fre-
quency responses for various branch line lengths. It is observed that in all cases the peaks of frequency respon- ses for various branches was not either attenuating with frequencies or branch length similar to the earlier case. Whereas, the position of the peaks and notches is case dependant unlike the previous case.
Figure 2. Power line network with 15 branches.
0 10 20 30 40 50 60 70 80
-350 -300 -250 -200 -150 -100 -50
Frequency in MHz
|H(f
)| i
n
dB
(a)
0
0 10 20 30 40 50 60 70 80
-400 -350 -300 -250 -200 -150 -100 -50
Frequency in MHz
|H
(f
)|
i
n
d
B
(b)
0
0 10 20 30 40 50 60 70 80
-400 -350 -300 -250 -200 -150 -100 -50
Frequency in MHz
|H
(f
)| i
n
dB
(c)
0
0 10 20 30 40 50 60 70 80
-400 -350 -300 -250 -200 -150 -100 -50
Frequency in MHz
|H
(f
)|
i
n
dB
[image:2.595.330.513.84.702.2](d)
0 10 20 30 40 50 60 70 80 -4
-3 -2 -1 0 1 2 3 4
Frequency in MHz
P
has
e
i
n de
gre
(a)
0 10 20 30 40 50 60 70 80
-4 -3 -2 -1 0 1 2 3 4
Frequency in MHz
P
has
e
i
n de
gre
(b)
0 10 20 30 40 50 60 70 80
-4 -3 -2 -1 0 1 2 3 4
Frequency in MHz
P
h
as
e i
n
de
gr
e
(c)
0 10 20 30 40 50 60 70 80
-4 -3 -2 -1 0 1 2 3 4
Frequency in MHz
P
has
e
i
n d
egr
e
[image:3.595.81.264.79.710.2](d)
Figure 4. Phase response for PLC with 15 branches (a) 1 m; (b) 2 m; (c) 3 m; (d) 4 m.
As the length of branched line increases the number of
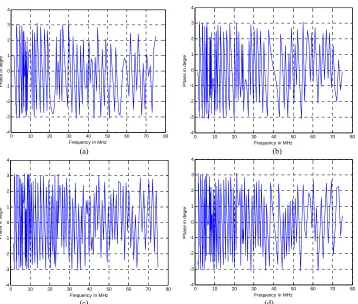
notches increase. The phase response (Figure 5) for the
case under study had similar behavior as in Figure 6.
3. Influence of Number of Branches
We consider the power line channel with distributed
branches as shown in Figure 2. The number of branches
was varied in the link between transmitter and receiver. We note that the distance between transmitter and re-ceiver was kept constant at 48 m, while all branches were 5 m long. The number of branches was varied as 1, 5, 10 and 15.
Note that for each case the distances between the trans- mitter and the receiver were equal but not equally dis-
tributed [(case 1 ec1 = ec2 = 24 m), (case 2 ec1 = ec2 = ec3
= ec4 = ec5 = 3 m ec6 = 33 m), (case 3 ec1 = ec2 = ec3 =
ec4 = ec5 = ec6 = ec7 = ec8 = ec9 = ec10 = 3 m ec11 = 18 m)
and (case 4 eci = 3 m i = 1:16)]. The terminations of all
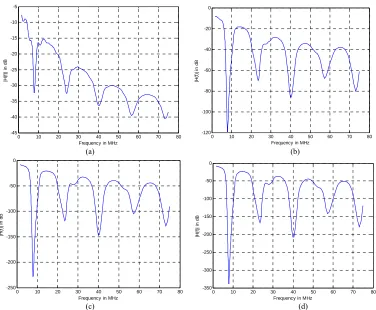
the branches are connected on open circuit. Figure 7
shows the corresponding frequency responses for differ- rent number of branches. It is observed that the positions of notches are not changed. But as the number of bran- ches increases the attenuations of notched point tends to increase. The phase responses are comparable to previ-
ous cases as shown in Figure 8.
4. Summary of the Conditions
The parametric study conducted in this paper showed that the number of branches, the length of the line and length of connections leads an attenuation of the transfer function.
5. Conclusions
In this paper, we were interested in modeling transfer function of electrical power lines for broadband power line communication.
A detailed study of factors influencing wave propaga-tions in the medium voltage lines was done.
The magnitude of the transfer function is reduced and selective versus the frequency.
We showed that the notches in PLC channel do not depend on the line length from the position of the trans-mitter and receiver. The pulse distortion does not depend on the line length between transmitter and receiver. The position of notches in frequency response depends on the branched line length. The increase in branched line length tends to limit the available bandwidth in the me-dium voltage channel.
We also showed that the position of deep notches does not change with a number of distributed branches. As the number of distributed branches increases the amplitude
0
0 10 20 30 40 50 60 70 80
-350 -300 -250 -200 -150 -100 -50 0
Frequency in MHz
|H
(f
)| i
n
d
B
0 10 20 30 40 50 60 70 80
-400 -350 -300 -250 -200 -150 -100 -50
Frequency in MHz
|H(f
)|
i
n
d
B
(a) (b)
0 10 20 30 40 50 60 70 80
-400 -350 -300 -250 -200 -150 -100 -50
0 0
Frequency in MHz
|H
(f
)| i
n
dB
0 10 20 30 40 50 60 70 80
-350 -300 -250 -200 -150 -100 -50
Frequency in MHz
|H
(f
)| i
n
dB
[image:4.595.112.483.88.383.2](c) (d)
Figure 5. Simulation results for PLC with 15 branches (a) 1 m; (b) 2 m; (c) 3 m; (d) 4 m.
4
0 10 20 30 40 50 60 70 80
-4 -3 -2 -1 0 1 2 3 4
Frequency in MHz
P
has
e
i
n deg
re
0 10 20 30 40 50 60 70 80
-4 -3 -2 -1 0 1 2 3
Frequency in z
P
h
as
e
i
n
deg
re
MH
(a) (b)
4
0 10 20 30 40 50 60 70 80
-4 -3 -2 -1 0 1 2 3 4
Freq
P
h
as
e
i
n
de
gr
e
uency in MHz
0 10 20 30 40 50 60 70 80
-4 -3 -2 -1 0 1 2 3
Frequenc in MHz
P
has
e
i
n
degr
e
y
(c) (d)
[image:4.595.121.479.412.716.2]0 10 20 30 40 50 60 70 80 -45
-40 -35 -30 -25 -20 -15 -10
-5 0
Frequenc
|H
(f
)|
i
n
dB
y in MHz
0 10 20 30 40 50 60 70 80
-120 -100 -80 -60 -40 -20
Frequency in Hz
|H
(f
)| i
n
d
B
M
(a) (b)
0 10 20 30 40 50 60 70 80
-250 -200 -150 -100 -50 0
0
Frequen
|H
(f
)|
i
n
dB
cy in MHz
0 10 20 30 40 50 60 70 80
-350 -300 -250 -200 -150 -100 -50
|H
(f
)|
i
n
d
B
Frequency in MHz
[image:5.595.111.487.83.393.2] [image:5.595.121.477.423.719.2](c) (d)
Figure 7. Simulation results for medium voltage channel with 1 branch (a); 5 branches (b); 10 branches (c); and 15 branches (d).
4
0 10 20 30 40 50 60 70 80
-4 -3 -2 -1 0 1 2 3 4
Frequency in MHz
|H
(f
)|
i
n dB
0 10 20 30 40 50 60 70 80
-4 -3 -2 -1 0 1 2 3
Frequency in MH
|H
(f
)|
i
n
d
B
z
(a) (b)
0 10 20 30 40 50 60 70 80
-4 -3 -2 -1 0 1 2 3
4 4
Frequency in MHz
|H(
f)| i
n
d
B
0 10 20 30 40 50 60 70 80
-4 -3 -2 -1 0 1 2 3
Frequency in M z
|H
(f
)|
i
n
d
B
H
(c) (d)
The peak points in the frequency responses tend to fluctuate as number of distributed branches increases.
The study of these phenomena is crucial for improving the performance of the PLC channel.
REFERENCES
[1] J. Ahola, “Applicability of Power-Line Communications
to Data Transfer of On-Line Condition Monitoring of Elec- trical Drives,” Ph.D Thesis, Lappeenranta University of Technology, Lappeenranta, 2003.
[2] T. Sartenaer and P. Delogne, “Deterministic Modelling of
the (Shielded) Outdoor Powerline Channel Based on the Multiconductor Transmission Line Equations,” IEEE Jour- nal on Selected Areas in Communications, Vol. 24, No. 7,
2005, pp. 1277-1291.
[3] H. Philipps, “Modelling of Powerline Communications
Channels,” Proceedings of 3rd International Symposium on Power-Line Communications and Its Applications, Lan-
caster, March 1999, pp. 14-21
[4] M. Zimmermann and K. Dostert, “A Multipath Model for
the Powerline Channel,” IEEE Transactions on Commu-
nications, Vol. 50, No. 4, 2002, pp. 553-559.
doi:10.1109/26.996069
[5] T. Esmailian, et al., “In-Building Power Lines as High
Speed Communication Channels: Channel Characteriza-tion and a Test Channel Ensemble,” International Journal of Communication Systems, Vol. 16, No. 5, 2003, pp. 381- 400. doi:10.1002/dac.596
[6] I. C. Papaleonidopoulos, et al., “Evaluation of the Two-
Conductor HF Transmission-Line Model for Symmetrical Indoor Triple-Pole Cables,” Measurement, Vol. 39, No. 8,