ISSN Print: 2327-5219
DOI: 10.4236/jcc.2018.611025 Nov. 28, 2018 276 Journal of Computer and Communications
False Data Injection Attacks Detection in Power
System Using Machine Learning Method
Can Yang
1, Yong Wang
1, Yuhao Zhou
2, Jiongming Ruan
2, Wei Liu
31Department of Information Security, Shanghai University of Electric Power, Shanghai, China
2National Energy Distributed Energy Technology Research and Development (Experimental) Center, Huadian Electric Power
Research Institute Co., LTD., Hangzhou, China
3Shanghai Cloud Information Technology Co., LTD., Shanghai, China
Abstract
False data injection attacks (FIDAs) against state estimation in power system are a problem that could not be effectively solved by traditional methods. In this paper, we use four outlier detection methods, namely one-Class SVM, Robust covariance, Isolation forest and Local outlier factor method from machine learning area in IEEE14 simulation platform for test and compare their performance. The accuracy and precision were estimated through simu-lation to observe the classification effect.
Keywords
FIDA, Machine Learning, Outlier Detection, Unsupervised Learning
1. Introduction
As an important role of the country, the power system has a vital impact on the national economy and public safety. With the in-depth application of informa-tion and communicainforma-tion technologies in modern power systems, power systems are gradually developing into cyber-physical systems (CPS) that are integrated by power physical networks and information networks. In smart grids, it re-quires high quality interaction between the information system and the physical system. However, due to the inevitable defects and loopholes in information communication systems in the power system, data collection, information transmission, and even data control centers are at risk of being attacked, result-ing in security incidents in the power network [1].
State estimation in power system is the estimation of the current system state, to provide data support for the EMS (Energy Management System) to do the
op-How to cite this paper: Yang, C., Wang, Y., Zhou, Y.H., Ruan, J.M. and Liu, W. (2018) False Data Injection Attacks Detec-tion in Power System Using Machine Learning Method. Journal of Computer and Communications, 6, 276-286.
https://doi.org/10.4236/jcc.2018.611025
Received: September 15, 2018 Accepted: November 25, 2018 Published: November 28, 2018
Copyright © 2018 by authors and Scientific Research Publishing Inc. This work is licensed under the Creative Commons Attribution International License (CC BY 4.0).
DOI:10.4236/jcc.2018.611025 277 Journal of Computer and Communications timal load distribution, and economic dispatching. The methods of state estima-tion are WLS (Weighted Least Square), PQ and so on [2]. During the estimaestima-tion process, attacks could be injected into data. False data injection attack (FIDA) is an attack first proposed by Yao Liu et al. in 2009 [3].
While different types of false data injection attacks despite traditional ones have been found, like attacks aiming at load distribution and economic dispatch [4] [5], various methods like using statistical method and topological method for detecting the false data injection attacks in state estimation [6] [7]. Recently, machine learning as an intelligent method in data mining, is excellent in dealing with data by self-learning.
The paper [8] is used for the comprehensive malicious attack as well as cyber disturbance of the power system. Probabilistic classifier, rule reduction, decision tree, non-probabilistic binary classifier, boosting multiple weak classifiers and other 7 learners are compared and tested. Random Forests, JRipper and Ada-boost + JRipper have the strongest performance for precision, while random forest shows poor averaged recall. Using the JRipper and Adaboost method over a three-class classification scheme is able to classify power system disturbances with low false positive rates. General idea of the effects of different classifiers is given in applications of smart grid. However, it’s not specified for detecting of the FID attacks.
Mohammad Esmalifalak et al. [9] use Principal Component Analysis (PCA) to reduce the noise, and use the Support Vector Machine (SVM) method to divide the hyperplane. It’s found that the sensitivity of detecting a point as an anomaly depends on the magnitude of threshold. There are several other failures that are not due to cyber attacks. In paper [10], supervised, semi-supervised, and online learning algorithms, as well as decision and feature level fusion algorithms are used to solve the classification problem. It turns that the perform of the SVM is affected by the selection of kernel types in different scale systems. While experi-mental results show that fusion methods provide learning models that are more robust to changes in the system size and data sparsity than theother methods. In the paper [11], supervised machine learning methods like perceptron method, SVM and kNN are studied in IEEE 9 and 57-bus system for the anomaly detec-tion. SVM is proved to be better than the others in large systems while KNN is sensitive to the size of system.
Youbiao He [12] put forward the intelligent detection mechanism of false data attack based on deep learning in smart grid. Conditional Deep Belief Network (CDBN) is proposed to recognize the high-dimensional temporal behavior fea-tures of the FDI attacks on IEEE 118 and 300-bus systems compared with the simulation results of ANN and SVM. The simulation showed that the proposed method is resilient to the different numbers of attacked measurements and level of environment noise levels. Real time detection is simulated by controlling the time.
DOI: 10.4236/jcc.2018.611025 278 Journal of Computer and Communications going further into application in cyber-attacks in power system, outlier detection in machine learning is still a fresh method that hasn’t been tested, but only in industrial anomaly field. Therefore, in this paper, we firstly applied four outlier detection methods including one-Class SVM, Robust covariance, Isolation forest and Local outlier factor to simulate the false data injection attacks (FIDAs) in IEEE 14-bus power system, and use the Principle Component Analysis (PCA) to prepare the data set. We analyze the performances of the outlier detection me-thods under different contamination rate by comparing the accuracy and preci-sion. Visualization is used to present the identification result of bad data in the data set during the simulation process.
2. Problem Setting
The power system states are those parameters that can be used to determine all other parameters of the power system, which includes node voltage phasor, complex power flow and so on. When we have measurements, we are able to obtain the states through state estimator.
( )
,z h x v= + (1)
T
, , , ,
ij ij i i i
z= P Q P Q V (2)
,
ij ij
X = θ V (3)
X is the states that can’t be observed directly, it determines the state of power system. z is the measured states, including active power, reactive power and vol-tage value. The error v in the measurements is assumed as a Gaussian Distribu-tion. The weights are different in order to emphasize the trusted measurement and deemphasize the untrusted one [2].
False data injection attack is to inject data into the measurements by injecting a non-zero vector e=
(
e e1, , ,2… em)
T, so that the measurement delivered to thestate estimator will be,
bad
z = +z e (4) Then after the state estimation the states would be gained as,
bad
x = +x c (5)
The error will be,
( )
( )
(
)
(
)
r z z h x v a h x H x Hc v H x a Hc
= − = + + − − −
= − + −
(6)
when
a Hc
=
, the error of the false data will not be detected, the traditionalfalse data detection method based on error cannot detect the false data [3].
3. Methodology: Outlier Detection Methods for False Data
Injection Detection
detec-DOI:10.4236/jcc.2018.611025 279 Journal of Computer and Communications tion from machine learning. Outlier detection is a type of anomaly detection method that the training data contains outliers and the central mode of the data should be fitted. This strategy is implemented with objects learning in an unsu-pervised way from the data [13]. Four detection methods are implemented in our experiment: One-Class SVM, Robust covariance (subpicture on lower left), Isolation forest (iForest) and Local Outlier Factor (LOF) based on scikit-learn tools [14].
3.1. One-Class SVM for False Data Injection Detection
One-Class SVM is a common classifier. It has the capability to capture the shape of data set, therefore performs well for high dimensional non-Gaussian data es-pecially data set from two entirely different types. To separate the data set from the origin, the special quadratic program should be solved so that the decision function will be positive for most examples contained in the training set. The support vector domain description is done in the process to decide the boun-dary, namely a closed curve in dual dimensional space to surround the positive samples. Under different data distribution the errors could be different. By ad-justing the parameter v the negative ratio in the total samples could be changed. The specific principle of this classical algorithm was described in [15]. Besides, the implementation of the detection is based on libsvm [16].
3.2. Local Outlier Factor for False Data Injection Detection
Local Outlier Factor is a density-based anomaly detection method. It considers outlier as the degree to which the object is isolated from its surrounding neigh-borhood. The local outlier factor of a point x is defined as [17]:
( )
( )( )
k( )
( )
k k
k
o N xk lrd o
LOF x lrd x
N x
∈
=
∑
(7)where lrdk is the local reachability density, Nk is the k-distance
neighbor-hood, 𝑜𝑜is a point in the space. If the factor is close to 1, it means the density of x’s neighbor is similar that may belong to a cluster. The smaller the value is compared with 1, the higher possibility that the point is an anomaly one.
3.3. Isolation Forest for False Data Injection Detection
Isolation Forest is an anomaly detection method first proposed by Fei Tony Liu et al. in 2008 [18], which is based on random forests to split the data space to detect the data that more likely to be separated, without employing any distance or density measure. It outperforms many methods like one-class SVM, LOF and random forests in terms of AUC and process time against the effects of swamp-ing and maskswamp-ing.
DOI: 10.4236/jcc.2018.611025 280 Journal of Computer and Communications stage: To obtain the anomaly score of every test sample according to the ex-pected path length from the trees. The anomaly score of different instances x can be calculated as:
( )
, 2 (( )( ))E h x c n
s x n = − (8)
where E h x
(
( )
)
is the average of h x( )
from a collection of isolation trees. And c n( )
is the average path lengths. If the anomaly score is very close to 1, it is judged as anomalies, if the score is much smaller than 0.5, then the instances are considered normal. The size of subsamples and the number of trees is set 256 and 100 respectively (experience value).3.4. Robust Covariance Estimation for False Data Injection
Detection
Robust covariance estimation uses elliptic envelope fitting method that fits a ro-bust covariance estimate to the data, and thus fits an ellipse to the central data points, ignoring points outside the central mode. It based on the assumption that the inlier data are Gaussian distributed, the Mahalanobis distances will be estimated according to inlier location and covariance of data and to be utilized as a reference of the intimacy with the group. Mahalanobis distance could be calculated as [19] [20]:
( , )
( ) (
i 2 i)
1(
i)
dµ∑ x = x −µ ′
∑
− x −µ (9)where μ and Σare the location and the covariance of the underlying Gaussian distribution.
For all the four detection methods, the fit function would be able to decide the boundary between normal and abnormal data according to training set and pre-dict the results (labels, 1 is for normal samples, and −1 for abnormal ones). The decision function in the training process will return the signed distance of every sample point to the hyperplane.
4. Simulation and Results
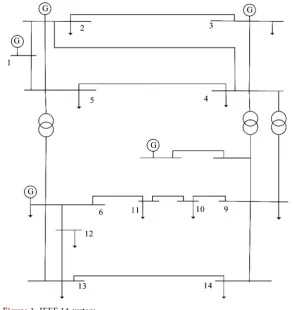
In the simulation stage, we evaluate the performances of the outlier detection mechanism using IEEE 14-bus test system as shown in Figure 1. In IEEE 14 bus system, the measurement vector z∈41 is composed of the measurements of
me-DOI:10.4236/jcc.2018.611025 281 Journal of Computer and Communications thod. Attack vectors are randomly chosen to generate an attack vector with Gaussian distributed nonzero elements with the same mean and variance as the original measurement set z in the experiments. The guideline of specific process for the implementation is listed as in Figure 1 and below.
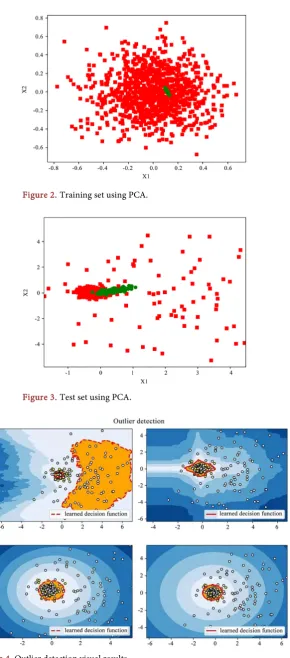
As shown in the detection process, the attacked estimated data set 1000 con-taining 100 compromised ones and 200 ones respectively as the test set to be analyzed using python 2.7.13. The number of features of every data set is 41 since the measurement points of IEEE 14 bus system is so. To better prepare the data set, we use Principal Component Analysis (PCA) [23] after Kalman filter to reduce the dimension of the data from 41 to 2 avoid the effect of noises and sim-plify the problem while retaining the main signal variations. The visualization of the training set and test set applying PCA is shown in Figure 2 and Figure 3.
The red points are original data set while the green ones are points after the dimensional reduction process. It can be observed that for the pure normal data set in Figure 2, namely the training data, the data points after using PCA me-thod are concentrated together, whereas the test set which contains compro-mised data in the Figure 3 has some isolated points after PCA method. Impor-tant features have been extracted to maximize the separation between the nor-mal and abnornor-mal data points which helps us to have a better detection proper-ty. In the next step, the prepared data are gathered to put into our outlier detec-tors. As for the parameter of the outlier detectors, the number of maximum samples is set as 200, the contamination rate is adjusted as 0.1 and 0.2 according to the injected portion and the experiment performance. In accordance with this, the number of the neighbors of LOF appears to work well as 20 when the outlier rate is high; when the proportion of outliers is greater, the number of neighbors should also be greater and would be set as 35 for 20% contamination rate. The visual results of different outlier detection methods, namely, one-Class SVM, Robust covariance (subpicture on lower left), Isolation forest (iForest) and Local Outlier Factor (LOF) are presented in Figure 4.
As can be observed from Figure 4, the red line is the learned boundary be-tween normal and abnormal data points, while orange area covering the central normal data set. LOF is seen to have two parts of the area, which may indicate swamping problem, taking the normal data as abnormal ones mistakenly. This will be proved through calculation of precision in the next. Part of the data is detected as outliers outside the boundary, and these data are labeled as −1, namely the abnormal samples. The accuracy and recall rates (precision) are used for the evaluation of the outlier detection outliers, which are defined as [24]:
Accuracy tp tp fp
=
+ ,
Precision tn tn fn
=
+ (10)
re-DOI: 10.4236/jcc.2018.611025 282 Journal of Computer and Communications peated the experiment of different contamination rate of 0.1 and 0.2 for 3 times respectively. It is found that the results of 3 times are the same for each rate, which indicated the stability of the algorithms’ performances. The results of ac-curacy and recall rates of the four different methods for different outlier rate are listed in Table 1.
Figure 1. IEEE 14 system.
Detecting false data injection attacks using outlier detection 1) Input: Training data from state estimator
( )1 ( )2 (1000) T
, , ,
Z=z z …z ,
(Total number of the samples is set as 1000)
2) Preprocess the data set Principal Component Analysis: dimensional feature reduction of Z from 41 to 2; 2) Parameters set for the outlier detectors:
size of samples n = 200, contamination rate = 0.1 and 0.2; 3) Fit the training data in the outlier detection estimators Estimator.fit(Z_train)
4) Sort out the outliers with the predict function of the algorithm:
(
)
Estimator.predict Z_test
5) Return: Predicted labels 1,( )( )is normal
1, is abnormal
p p
z z −
,
( )p
DOI:10.4236/jcc.2018.611025 283 Journal of Computer and Communications
[image:8.595.258.488.64.458.2]Figure 2. Training set using PCA.
Figure 3. Test set using PCA.
[image:8.595.221.532.467.722.2]DOI: 10.4236/jcc.2018.611025 284 Journal of Computer and Communications
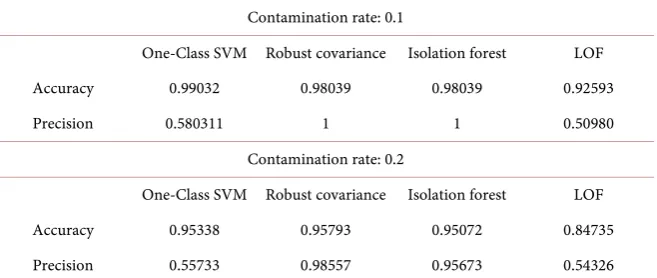
Table 1. Accuracy and precision of different detection methods.
Contamination rate: 0.1
One-Class SVM Robust covariance Isolation forest LOF Accuracy 0.99032 0.98039 0.98039 0.92593
Precision 0.580311 1 1 0.50980
Contamination rate: 0.2
One-Class SVM Robust covariance Isolation forest LOF Accuracy 0.95338 0.95793 0.95072 0.84735 Precision 0.55733 0.98557 0.95673 0.54326
5. Conclusions
When it comes to the big data detection problem of false data injection attack in power system, machine learning method is an efficient, fast method as a solu-tion. After the dimension reduction, the detection process is quite fast and the results are visualized. All the four outlier detectors perform better when the contamination rate is smaller, no matter in respect of accuracy or precision, which is a benefit for detecting those small-scale attacks that are unobservable in traditional detections. In the first case, robust covariance and isolation forest have the same excellent performance while robust covariance outstands in the higher outlier rate case. The rate of the robust estimator of covariance, which is assuming that the data are Gaussian distributed and performs way better than the one-class SVM in our case, and that also turns that the errors of the data are Gaussian noises. The one-class SVM performs not so well in this experiment. The reason for that could be the rareness of the abnormal samples in the big da-ta. Some normal data points are classified as abnormal data, which cause the low precision and poor performance of One-Class SVM. LOF is a density-based anomaly detection algorithm with respect to its neighbors by comparing their local density, which may also cause a problem of local swamping, namely re-garding the positive samples as negative, which largely effect the precision of the detection. That’s also the reason why two areas of “normal data” are figured out. The density of abnormal data misleads the result. Robust covariance and isola-tion forest have observably good performance in the experiment, and robust co-variance achieves extremely high accuracy and precision in the experiment. The machine learning method shows its effectivity in detecting FIDAs. Isolation for-est is supposed to stay ideal performance when applying high complexity data, which is to be studied in the future.
DOI:10.4236/jcc.2018.611025 285 Journal of Computer and Communications
Funding
This work was supported by the National Natural Science Foundation of China under Grant 61772327, Shanghai Municipal Natural Science Foundation under Grant 16ZR1436300, Shanghai University of Electric Power, Department of Smart Grid Center under Grant A-0009-17-002-05. Shanghai Science and Tech-nology Committee under Grant 15110500700. Zhejiang University State Key Laboratory of Industrial Control Technology Open Fund (ICT1800380).
Conflicts of Interest
The authors declare no conflicts of interest regarding the publication of this pa-per.
References
[1] Yan, Y., Qian, Y., Sharif, H. and Tipper, D. (2012) A Survey on Cyber Security for Smart Grid Communications. IEEE Communications Surveys & Tutorials, 14, 998-1010. https://doi.org/10.1109/SURV.2012.010912.00035
[2] Abur, A. and Exposito, A.G. (2004) Power System State Estimation, Theory and Implementation. Marcel Dekker, Inc., New York.
https://doi.org/10.1201/9780203913673
[3] Liu, Y., Ning, P. and Reiter, M.K. (2009) False Data Injection Attacks against State Estimation in Electric Power Grid. Proceedings of the 16th ACM Conference on Computer and Communications Security, Chicago, Illinois, 9-13 November 2009, 21-32.https://doi.org/10.1145/1653662.1653666
[4] Yuan, Y.L., Li, Z.Y. and Ren, K. (2012) Quantitative Analysis of Load Redistribution Attacks in Power Systems. IEEE Transactions on Parallel and Distributed Systems, 23, 1731-1738.https://doi.org/10.1109/TPDS.2012.58
[5] Xie, L., Mo, Y.L. and Sinopoli, B. (2010) False Data Injection Attacks in Electricity Markets. Proceedings of 1st IEEE International Conference on Smart Grid
Commu-nications, Gaithersburg, MD, 4-6 October 2010.
[6] Wang, S.C. and Ren, W. (2014) Stealthy False Data Injection Attacks against State Estimation in Power Systems: Switching Network Topologies. 2014 American Con-trol Conference (ACC), Portland, Oregon, 4-6 June 2014.
https://doi.org/10.1109/ACC.2014.6858904
[7] Kosut, O., Jia, L., Thomas, R.J., et al. (2010) Malicious Data Attacks on Smart Grid State Estimation: Attack Strategies and Countermeasures. 2010 First IEEE Interna-tional Conference on Smart Grid Communications, Gaithersburg, MD, 4-6 October 2010, 220-225.https://doi.org/10.1109/SMARTGRID.2010.5622045
[8] Hink, R.C.B., Beaver, J.M., Buchner, M.A., Morris, T., Adhikari, U. and Pan, S.Y. (2014) Machine Learning for Power System Disturbance and Cyber-Attack Dis-crimination. 2014 7th International Symposium on Resilient Control Systems (ISRCS), Denver, CO, 19-21 August 2014.
[9] Esmalifalak, M., Liu, L.C., Nguyen, N., Zheng, R. and Han, Z. (2017) Detecting Stealthy False Data Injection Using Machine Learning in Smart Grid. IEEE Systems Journal, 11, 1644-1652. https://doi.org/10.1109/JSYST.2014.2341597
DOI: 10.4236/jcc.2018.611025 286 Journal of Computer and Communications https://doi.org/10.1109/TNNLS.2015.2404803
[11] Wang, B.Y., Zhao, Y.D., Zhang, S.M. and Li, B.H. (2017) Study of Monitoring False Data Injection Attacks Based on Machine-Learning in Electric Systems. Journal of Electronics and Information Science, 2, 122-128.
https://doi.org/10.23977/jeis.2017.22013
[12] He, Y.B., Mendis, G.J. and Wei, J. (2017) Real-Time Detection of False Data Injec-tion Attacks in Smart Grid: A Deep Learning-Based Intelligent Mechanism. IEEE Transactions on Smart Grid, 8, 2505-2516.
https://doi.org/10.1109/TSG.2017.2703842
[13] Aggarwal, C.C. and Yu, P.S. (2001) Outlier Detection for High Dimensional Data. Proceedings of the 2001 ACM SIGMOD International Conference on Management of Data, Santa Barbara, California,21-24 May 2001, 37-46.
https://doi.org/10.1145/375663.375668
[14] Scikit-Learn Developers (2018) Scikit-Learn User Guide, Release 0.19.2.
[15] Williamson, R., Smola, A., Shawe-Taylor, J. and Platt, J. (1999) Support Vector Me-thod for Novelty Detection. International Conference on Neural Information Processing Systems, 12, 582-588.
[16] https://www.csie.ntu.edu.tw/~cjlin/libsvm/
[17] Breunig, M.M., Kriegel, H.-P., Ng, R.T. and Sander, J. (2000) LOF: Identifying Den-sity-Based Local Outliers. Proceedings of the 2000 ACM SIGMOD International Conference on Management of Data, Dalles, 15-18 May 2000, 93-104.
https://doi.org/10.1145/342009.335388
[18] Liu, F.T. and Ting, K.M. (2012) Isolation-Based Anomaly Detection. ACM Transac-tions on Knowledge Discovery from Data, 5, 1-44.
[19] Rousseeuw, P.J. (1984) Least Median of Squares Regression. Journal of the Ameri-can Statistical Association, 79, 871-880.
https://doi.org/10.1080/01621459.1984.10477105
[20] Wilson, E.B. and Hilferty, M.M. (1931) The Distribution of Chi-Square. Proceed-ings of the National Academy of Sciences of the United States of America, 17, 684-688.https://doi.org/10.1073/pnas.17.12.684
[21] Zimmerman, R.D., Murillo-Sánchez, C.E. and Thomas, R.J. (2011) MATPOWER: Steady-State Operations, Planning, and Analysis Tools for Power Systems Research and Education. IEEE Transactions on Power Systems, 26, 12-19.
https://doi.org/10.1109/TPWRS.2010.2051168
[22] Chowdhury, F.N., Christensen, J.P. and Aravena, J.L. (1991) Power System Fault Detection and State Estimation Using Kalman Filter with Hypothesis Testing. IEEE Transactions on Power Delivery, 6, 1025-1030.https://doi.org/10.1109/61.85843 [23] Jolliffe, I.T. (2002) Principal Component Analysis. Wiley, Hoboken.