ISSN Print: 2327-5219
DOI: 10.4236/jcc.2018.69004 Sep. 11, 2018 39 Journal of Computer and Communications
A ZigBee-Based Acquisition System for
Agricultural Environment Information
with Low Power and High Reliability
Guiling Sun, Xuesong Guo, Tianyu Geng, Yawen Du
College of Electronic Information and Optical Engineering, Nankai University, Tianjin, China
Abstract
In order to guarantee the safety of products at modern agriculture, the whole factors of the environment of agricultural production process need to be mo-nitored. That needs to collect a variety of environmental information. In this paper, based on ZigBee technology, a system for crop growth environment information and image information acquisition is implemented. System net-work scheme can reduce the interchannel interference and enhance ZigBee communication quality. In the process of transmission, the transmission of the image data uses a coding scheme based on historical data comparison. For the image transmission, an intelligent transmission scheme based on gene-rating Feedback Report is proposed, which takes both the quality and effi-ciency into consideration. Based on these schemes, the system designed in this paper can realize efficient and reliable transmission of agricultural envi-ronmental information.
Keywords
ZigBee, Wireless Networking, Agricultural Internet of Things, Image Transmission
1. Introduction
In recent years, the frequent occurrence of food safety and environmental prob-lems has made people constantly aware of the importance of monitoring agri-cultural products. Monitoring the growth environment is an important way to ensure the safety of agricultural products. Many indicators in the growth envi-ronment of agricultural products are need to be recorded in this process. Except for the safety guaranteeing, it can also help to produce scientifically and reason-How to cite this paper: Sun, G.L., Guo,
X.S., Geng, T.Y. and Du, Y.W. (2018) A ZigBee-Based Acquisition System for Agri-cultural Environment Information with Low Power and High Reliability. Journal of Computer and Communications, 6, 39-49.
https://doi.org/10.4236/jcc.2018.69004
Received: August 10, 2018 Accepted: September 8, 2018 Published: September 11, 2018
Copyright © 2018 by authors and Scientific Research Publishing Inc. This work is licensed under the Creative Commons Attribution International License (CC BY 4.0).
http://creativecommons.org/licenses/by/4.0/
DOI: 10.4236/jcc.2018.69004 40 Journal of Computer and Communications ably as well as to improve the yield and quality of agricultural products [1].
Generally speaking, environmental information such as temperature, humidi-ty and PH value can be acquired by sensors. In this process, ZigBee technology, as a mature low-power Internet of things technology, can be a good choice for sensor data collection [2]. The existing ZigBee-based agricultural information acquisition system mainly collects sensor numerical information such as tem-perature and humidity, light intensity, PH value, electrical conductivity, and re-flects the health and growing conditions of crops through these growth envi-ronment parameters [3].
However, advances in technologies such as machine vision and machine learning have enabled crop image information to play a role in crop growth monitoring and pest control [4]. The image information collection of the growth environment of agricultural products has become valuable obviously. For these reasons, this paper designs a set of ZigBee-based multi-information acquisition system for agricultural product growth environment. Compared with the pre-vious ZigBee-based acquisition system, it not only adds image information col-lection, but also designs methods for fast and stable image data transmission and other sensor information transmission with low power consumption.
2. Hardware System and Network Design
ZigBee technology transmission range is generally between 10 to 100 meters. Thus, for each greenhouse with an area of about 2000 square meters, it is very reasonable to use a base station to set up a data acquisition system.
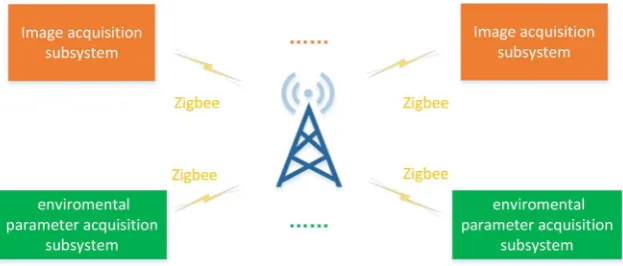
Each ZigBee-based agricultural environment multi-information acquisition system consists of three parts, including a regional gateway, several environ-mental parameter acquisition systems and image acquisition systems, as shown in Figure 1.
In the case of several greenhouses, through a reasonable networking scheme, every set of such systems is installed for each greenhouse, and the data of each system are sent to the server through Ethernet.
2.1. Regional Gateway and Acquisition Subsystem
[image:2.595.218.530.574.707.2]Regional gateway is the core of information acquisition system, which can obtain
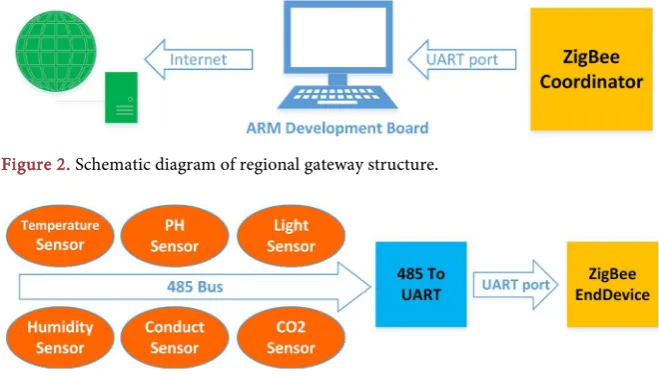
DOI: 10.4236/jcc.2018.69004 41 Journal of Computer and Communications data from several image acquisition subsystem and environment parameter ac-quisition subsystem in its jurisdiction network. It is mainly composed of a CC2530 of ZigBee coordinator mode and an embedded Linux development board based on ARM processor, as shown in Figure 2. The ZigBee coordinator is responsible for the establishment and maintenance of wireless networks throughout the region, and it receives data from the ZigBee nodes of the subsys-tem. The embedded Linux platform is responsible for storing and displaying the received data while transferring the data through Ethernet to the backend server for unified management.
The environmental parameter acquisition subsystem is responsible for col-lecting temperature, humidity, light intensity, pH value, conductivity and CO2
concentration information in the growth environment of agricultural products. The structure is shown in Figure 3. All sensors are connected to a 485 bus and then connected to CC2530 via a chip of 485 to serial port. The sensor data are con-trolled by CC2530 and then sent to the regional gateway via the ZigBee protocol.
The image acquisition subsystem includes the image acquisition module based on H3 ARM processor development platform and the sending module based on ZigBee terminal equipment, as shown in Figure 4. The image acquisition mod-ule controls the FA CAM202 model USB camera to collect images in a certain period, then compress the images and send them to the ZigBee terminal through the serial port, and then send them to the regional gateway through the ZigBee protocol.
2.2. Network Planning for Reducing Interference
[image:3.595.206.536.523.711.2]When there are several greenhouses, each greenhouse can be considered as a cell. Firstly, different network channels are allocated for each cell as far as possi-ble, so as to maximize the channel capacity of the whole communication system. In this case, information can be transmitted at the best information rate. The ZigBee network has a total of 16 channels available at 2.4 GHz frequency. When
Figure 2. Schematic diagram of regional gateway structure.
DOI: 10.4236/jcc.2018.69004 42 Journal of Computer and Communications
Figure 4. Structure diagram of image acquisition subsystem.
the number of base stations required is more than 16, each channel will be used in several different cells, and there will be co-frequency interference between cells. Meanwhile, limited by the actual technical conditions, there is also interfe-rence between adjacent frequencies in practical engineering [5].
In this paper, a network scheme is proposed, which can be shown that this scheme can minimize the influence of both the co-frequency interference and the adjacent frequency interference. The core idea of this scheme is to make the distance between these interference cells as large as possible.
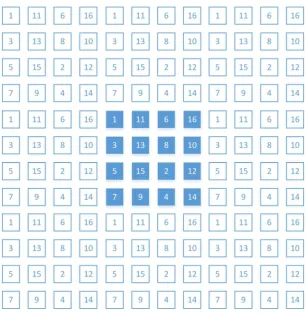
First, the problem of co-frequency interference is discussed. It is understanda-ble that the characteristics of each channel are completely the same for different frequencies of channels 1 - 16. It is easy to prove that the total channel capacity is the largest when the probabilities of being used of all channels are the same, all of which are 1/16. As shown in Figure 5, the flat grid is used to represent the cells formed by each greenhouse, and the distance from the center of the adja-cent cells is calculated as 1.
The same number in Figure 5 indicates using the same channel. It’s obvious that 4 is the maximum distance between different cells of the same frequency.
In addition, considering the problem of adjacent frequency channels, the dis-tance corresponding to the optimal solution can be found in theory, as shown in Figure 6.
The 4 black points represent 4 co-frequency cells with the shortest distance of 4, and the red point represents the neighborhood with the adjacent frequency of the black point. It can be seen that the average effect on black points is the least when red points are placed in the middle of four black points. However, since there are two adjacent frequency cells for each cell (one’s frequency is higher while the other’s is lower), if one is placed in the center and the other can only be placed near the center.
Based on the above principles, an optimal channel arrangement scheme is proposed in this paper, as shown in Figure 7.
It can be seen that in this scheme, the distance is 4 for all the same frequency cells close to each other. The same frequency interference has been controlled in the minimum range. However, the cell distance of the adjacent frequency is at least 2.236, with an average of 2.55. Even taking into account the worst case, the distance from 2.236 has interference gain of −10.5 dB compared with the dis-tance of 1, and the anti-interference effect is obvious.
3. Data Acquisition and Transmission
DOI: 10.4236/jcc.2018.69004 43 Journal of Computer and Communications
[image:5.595.328.417.287.373.2]Figure 5. Schematic diagram of cells arrangement.
Figure 6. Schematic diagram of adjacent frequency plots.
[image:5.595.220.527.398.713.2]DOI: 10.4236/jcc.2018.69004 44 Journal of Computer and Communications work mainly comes from battery replacement. So it is of great significance to ex-tend the battery life through reasonable software algorithm. When transmitting image information, the data size of a normal 24-bit color image of 640 × 480 is 900 KB, which is large for ZigBee network. Therefore, in the software design process, the image data must be compressed and can be transmitted efficiently and reliably.
3.1. Low Power Consumption Environment Parameter
Transmission Coding Scheme
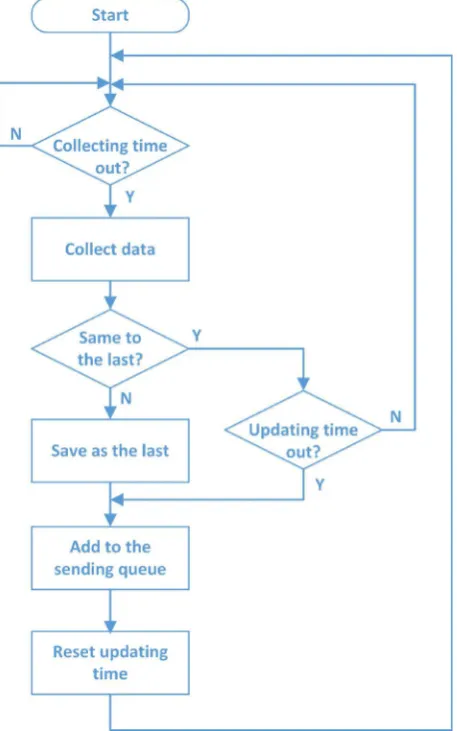
[image:6.595.261.490.339.705.2]Generally speaking, except for regularly collecting and sending data, ZigBee nodes realize low power consumption by sleeping at the collecting and sending interval [6]. Besides, for the data collected in the collection node designed in this paper, such as pH, conductivity and other sensors, the data returned by these sensors often remain unchanged for a period of time, or within a certain range of precision [7]. Even data such as temperature, humidity and light may remain constant for a certain number of hours. The proposed method is designed by using this feature, as shown in Figure 8.
DOI: 10.4236/jcc.2018.69004 45 Journal of Computer and Communications After reaching the wake-up time, the device collects data from each sensor, and then establishes a sending queue. The first byte of the queue is called the Flag Byte, and each sensor corresponds to a bit in the Flag Byte. Then, the data collected by the controller is compared with the data saved last time. If it is dif-ferent, it is saved as the latest data and added to the sending queue. At the same time, the data source’s corresponding Flag Bit is set. If it is the same as the pre-vious, it won’t join the sending queue and the system will go directly to the next step. When the comparison is completed, the data added to the sending queue will be sent together, and if no data is added to the sending queue, the sending will be cancelled.
Since a significant portion of the power for the nodes comes from the radio frequency part [8], the proposed method saves a lot of energy and greatly ex-tends battery life when most of the data collected is the same as before. Mean-while, in order to avoid the situation that the background can’t receive data for a long time and cannot judge whether the node is still working, a mandatory up-date timer is set. If no data has been sent after that time, even if there is no data update, the Flag Byte will be sent to indicate that the node is normal. In this way, if the background does not receive the data from the node after this time, it can be judged that there is something wrong with this node.
3.2. Efficient and Reliable Image Data Transmission Scheme
Regarding the problem of large amount of image data, the method adopted in this paper is to use the image acquisition module to firstly transform the image into JPG format file through the international standard JPEG compression me-thod, so the compressed image file is generally only 30 - 50 KB.However, since a JPG file is a compressed file, where each byte of data in the file no longer corresponds to a specific pixel point, there may be a big difference between the image acquired and the original image when any errors occur dur-ing transmission [9]. Therefore, it is necessary to establish an error control me-chanism to ensure accurate transmission.
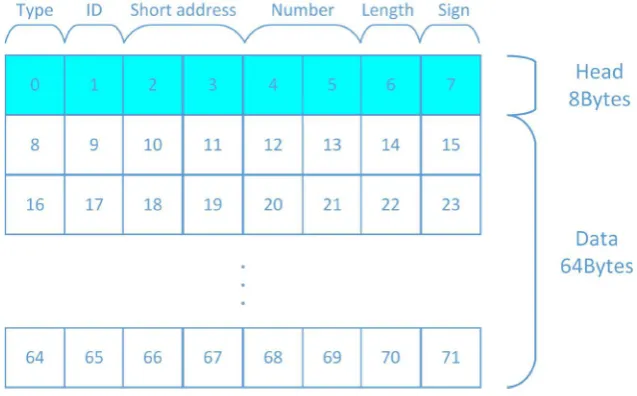
First, the preprocessing of the image file is to decompose the image file into a 64 byte packet (selecting 64 bytes is considering the ZigBee packet maximum is 75 bytes, and 64 = 26, is advantageous to the binary operation), Then, an 8-byte
header is added to each packet. Packet type and mark number information are recorded in the packet header. The packet structure is shown in Figure 9.
DOI: 10.4236/jcc.2018.69004 46 Journal of Computer and Communications
Figure 9. Image information packet structure.
Report is designed, which greatly improves the transmission rate. The specific scheme is as follows:
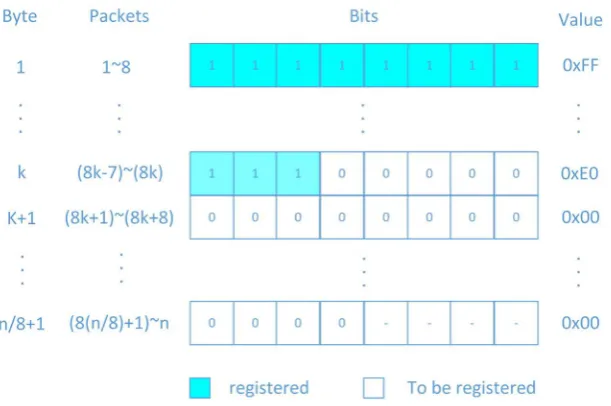
The image acquisition module sends out all the packets at one time and waits for the Feedback Report. After receiving the Feedback Report, it resends the packets not received by the base station according to the feedback situation. At the base station, the receiver knows the total number of packets N according to the first packet, and establishes the Registration Table composed of (N/8 + 1) bytes. Here, each byte is called a Table Item, and each bit in a Table Item is called a Registration Bit. Each bit corresponds to the receiving state of a packet. The Registration Table structure is shown in Figure 10.
The receiver waits for the packet to arrive, and when each packet is received completely, the corresponding Registration Bit will be set from 0 to 1. When the receiver receives the packet with the maximum mark number, it means that the sender has completed sending. Here, in order to prevent the system from enter-ing a dead loop due to sendenter-ing failure of last packet, let the node periodically send an end indicator packet during the time waiting feedback after sending. The receiver then checks each byte of the Registration Table in turn and reflects the Feedback Report based on the results of the inspection. In this paper, a scheme for intelligent selection of the Feedback Report form based on channel condition is proposed:
Firstly, when the channel condition is very good, every missing item is found at the base station, the corresponding packet mark number is calculated, and all unreceived packet mark numbers are combined into the Feedback Report. This form of Feedback Report is good for situations where only a few packets are re-ceived unsuccessfully, and because the node only needs to read the packet num-ber directly and resends the corresponding packet, no calculation for the node is required.
DOI: 10.4236/jcc.2018.69004 47 Journal of Computer and Communications
Figure 10. Diagram of Registration Table structure.
items in the Registration Table, the first form of Feedback Report will reduce the system performance rapidly. Because there are usually more than 256 packets, it must take two bytes to record a mark number. Taking a total of 512 packets as an example, if the unreceived packets reaches half, i.e., 256 packets, 512 bytes will need to be sent, and ZigBee will need to send eight times.
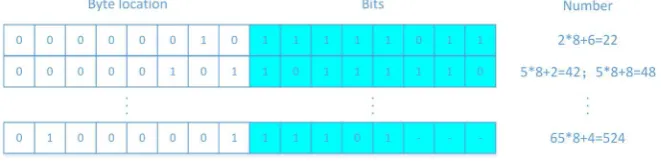
The system will automatically use the second form of Feedback Report: For each Table Item that is not 0xFF, two bytes are added to the data area to be sent. The first byte is the position of the searched Table Item in the entire Registration Table. The second byte is the data for the Table Item itself. After checking the complete Registration Table, the data in the waiting area will be sent as the Feedback Report. This report structure is shown in Figure 11.
In this method, for each missing packet, up to 2 bytes should be sent. For a node that receive a Feedback Report, it treats each 2 bytes as a group, left shifts the first byte 3 bits and adds the position of “0” in the second byte, then gains the mark number of a packet that need to be resent. For nodes, the total amount of computation is relatively small. Because a couple of 2 bytes of the Registration Table can record up to eight missing items, the data feedback will still not be large when the channel is poor.
Finally, intelligently choose the third method when the channel quality is ex-tremely poor or the transmission is interrupted unexpectedly: The entire Regis-tration Table is sent directly to the node as the Feedback Report. The node checks for unsuccessful received packets and resends them. In this way, even in the worst case the amount of data feedback will not be very large. For example, when totally 512 packets, there only 64 bytes of Registration Table, can be sent at one time.
4. Summary
DOI: 10.4236/jcc.2018.69004 48 Journal of Computer and Communications
Figure 11. Example diagram of the second kind Feedback Report structure.
information acquisition system for the growing environment of agricultural products was implemented in this paper. The acquisition of agricultural product image information is completed through the V4L2 Linux architecture, and im-age compression is completed through the Libjpeg library to generate JPG for-mat images. CC2530 controls the corresponding sensor to obtain temperature, humidity, pH, conductivity, light intensity and CO2 concentration data.
ZigBee network composed of CC2530 completes the wireless transmission of multi-parameter fusion data. In this process, the use of network schemes to re-duce interchannel interference can improve the communication quality of Zig-Bee network. The use of low-power coding scheme ensures the reliable trans-mission of environmental parameter information while greatly reducing the transmission power and improving the node’s endurance. The intelligent trans-mission scheme of image information based on feedback report can realize effi-cient and rapid image transmission in a variety of complex environments. Mul-ti-information monitoring of crop growing environment is realized.
Acknowledgements
This work was partially supported by the National Nature Science Foundation of China (No. 61771262), by Major Science and Technology Projects of Tianjin (No. 2017ZXHLNC00100) and by Tianjin Key Laboratory of Optoelectronic Sensor and Sensing Network Technology.
Conflicts of Interest
The authors declare no conflicts of interest regarding the publication of this pa-per.
References
[1] Qiu, T., Xiao, H. and Zhou, P. (2013) Framework and Case Studies of Intelligence Monitoring Platform in Facility Agriculture Ecosystem. Second International Con-ference on Agro-Geoinformatics, Fairfax, VA, USA, 12-16 August 2013, 522-525.
https://doi.org/10.1109/Argo-Geoinformatics.2013.6621976
[2] Yu, X., Wu, P., Han, W., et al. (2013) A Survey on Wireless Sensor Network Infra-structure for Agriculture. Computer Standards & Interfaces, 35, 59-64.
https://doi.org/10.1016/j.csi.2012.05.001
DOI: 10.4236/jcc.2018.69004 49 Journal of Computer and Communications
[4] Ojha, T., Misra, S. and Raghuwanshi, N.S. (2015) Wireless Sensor Networks for Agriculture: The State-of-the-Art in Practice and Future Challenges. Computers & Electronics in Agriculture, 118, 66-84. https://doi.org/10.1016/j.compag.2015.08.011
[5] Bloem, J.W.V., Schiphorst, R., Kluwer, T. and Slump, C.H. (2012) Interference Measurements in IEEE 802.11 Communication Links Due to Different Types of In-terference Sources. 8th International Conference on Wireless Communications,
Networking and Mobile Computing, Shanghai, 21-23 September 2012, 1-6.
[6] Fan, X., Song, G. and Zhang, D. (2015) Multipoint Monitoring of Self-Organized ZigBee Network Based on Mixture Sleep. Microcontrollers & Embedded Systems, 15, 11-14.
[7] Srbinovska, M., Gavrovski, C., Dimcev, V., Krkoleva, A. and Borozan, V. (2015) Environmental Parameters Monitoring in Precision Agriculture Using Wireless Sensor Networks. Journal of Cleaner Production, 88, 297-307.
https://doi.org/10.1016/j.jclepro.2014.04.036
[8] Davis, T.W., Liang, X., Navarro, M., Bhatnagar, D. and Liang, Y. (2012) An Expe-rimental Study of WSN Power Efficiency: MICAz Networks with XMesh. Interna-tional Journal of Distributed Sensor Networks, 8, 1-12.
https://doi.org/10.1155/2012/358238
[9] Willème, A. and Macq, B. (2016) Quality and Error Robustness Assessment of Low-Latency Lightweight Intra-Frame Codecs. 2016 Data Compression Conference
(DCC), Snowbird, UT, USA, 30 March-1 April 2016, 637-637.
https://doi.org/10.1109/DCC.2016.75
[10] Sun, G.L., Liu, Z.J., Du, Y.W. and Guo, X.S. (2018) Design and Implementation of Agricultural Information Acquisition System Based on ZigBee and Qt. Journal of Computer and Communications, 6, 13-26. https://doi.org/10.4236/jcc.2018.62002