ISSN Online: 2327-5960 ISSN Print: 2327-5952
Bigger Is Better? An Empirical Analysis of
Urban Compactness and Spatial
Autocorrelation in Guangdong Province
Qian Xu
School of Public Administration and Emergency Management, Jinan University, Guangzhou, China
Abstract
In the process of rapid urbanization in China, the problems caused by urban sprawl are becoming increasingly serious. Guangdong province’s GDP ranked first for 29 years in China. Its spatial and temporal characteristics of urban compactness are exceedingly typical. This paper uses catastrophe pro-gression method to calculate the urban compactness of 21 prefecture level ci-ties in Guangdong province from 2000 to 2015, then carries out the spatial analysis. The findings of this study indicate that 1) with the core of Guang-dong, Hong Kong and Macao Bay Area, fan-shaped diffusion of city pactness and spatial distribution pattern is formed. 2) The average city com-pactness of Guangdong province has changed little from 2000 to 2015 which fluctuates in the range of 0.75 - 0.80. And the urban compactness of Shenz-hen, Guangzhou and Dongguan is the top three stably. 3) The Global Moran’s I in Guangdong changed from −0.3315 to 0.4102; namely, the spatial auto-correlation of urban compactness changed from dispersion into agglomera-tion in 16 years. 4) The spatial difference of urban compactness in Guang-dong is mainly affected by polarization effect, diffusion effect and return ef-fect. After analysis, we suggest that Guangdong province should focus on the development of intercity rail transportation in order to consolidate the mu-tual relationship within the urban agglomeration of Guangdong-Hong Kong-Macao Greater Bay Area. In the meantime, it’s supposed to promote the process of Three Old Transformation in the low gradient city. These findings may have implications regarding the improvement of urban com-pactness and efficiency.
Keywords
Compact City, Catastrophe Progression, Spatial Autocorrelation, Intensive Use of Land, Guangdong-Hong Kong-Macao Greater Bay Area, Polarization
How to cite this paper: Xu, Q. (2018) Bigger Is Better? An Empirical Analysis of Urban Compactness and Spatial Autocor-relation in Guangdong Province. Open Journal of Social Sciences, 6, 136-150.
https://doi.org/10.4236/jss.2018.69009
Received: August 21, 2018 Accepted: September 3, 2018 Published: September 6, 2018 Copyright © 2018 by author and Scientific Research Publishing Inc. This work is licensed under the Creative Commons Attribution International License (CC BY 4.0).
http://creativecommons.org/licenses/by/4.0/ Open Access
Effect, Diffusion Effect
1. Introduction
The basic trend of modern urban development is building a compact city. Urban sprawl caused serious social and environmental problems (e.g. waste of land re-source, inefficient pendulum commuting, the disappearance of agricultural land and open space, the hollowing out of urban) [1]. All these problems are reflected in the process of rapid urbanization in China. In 2016, China’s urbanization rate was 57.35%; at the same time, it was expected to reach 60% in 2020. Under the restriction of a Red Line for protecting farmland in mainland China, how to ab-sorb urbanized population becomes an urgent problem. Therefore, limiting the boundary of urban growth, improving the efficiency of land use, protecting the green space and renewing the development land have become a necessary means to solve the problem of urban sprawl. As a strong province for its economy and population, Guangdong province has a prominent contradiction between hu-man and land. Accordingly, it has the practical significance to study the way to build compact cities in Guangdong province.
The compact city was first proposed by Danzig and Satty. At present, there is no uniform standard for the definition of compact city. Some scholars believe that the connotation of the compact city is to promote the redevelopment of the city, to activate the center of the city, to protect the farmland, and to improve the urban density [2] [3], to promote the mixed use of land and transit-oriented de-velopment [4]. Some scholars assert that the compact city can provide more liv-ing space on the same land area, meanwhile meetliv-ing the higher life requirements of the citizens. On the premise of controlling the urban fringe not expanding outwards, the infill development of city can be realized, and the efficiency of city will be improved. To sum up, the characteristics of compact city includes com-pact urban form and comcom-pact urban function, which is highlighted as three as-pects: transit-oriented development, high density development and comprehen-sive utilization of land space.
At present, the measurement of urban compactness is mostly about the mor-phological compactness. Most of the research tools are GIS and remote sensing image interpretation. The indices are usually constructed from nine aspects (i.e. density, diversity, continuity, concentration, clustering, centrality, nuclearity, mixed use and proximity) [5] [6]. The measurement is based on the premise that the circle is the best shape of the city, which is the biggest drawback. In other words, if the shape of the city is closer to the circle, then the urban compactness becomes bigger. It is obviously contrary to the actual urban form. Actually, ur-ban morphology, which is affected by geography, geology, hydrology, transpor-tation lines, administrative boundaries, evolves into ribbon, cluster or satellite shaped form. Urban form is difficult to achieve circular shape; whereas, a non
circle city can’t be a compact city. At the same time, only considering the com-pactness of urban form and ignoring the comcom-pactness of city features are con-trary to the core connotation of compact city. Meanwhile, some scholars use en-tropy method, AHP method, principal component analysis method to calculate the urban compactness. The indexes selected are similar to the evaluation of land intensive. In addition, those indexes emphasize on the density so much that they ignore the mixing and coordination of city functions.
In view of the above problems, this paper chooses 20 indices from the two as-pects which are urban morphology and urban function. Then we establish 6 second level indexes which are the compactness of population, land use, func-tion of dwelling, funcfunc-tion of transportafunc-tion, funcfunc-tion of work and funcfunc-tion of recreation. Afterward, we apply catastrophe progression method to calculate the city compactness of Guangdong province with the data from 2000 to 2015, then use Arc GIS and GeoDa to operate the spatial econometrics in order to explore the spatial distribution characteristics of urban compactness, degree of balance, spatial autocorrelation etc.
The rest of the paper is organized as follows. We introduce the theoretical ba-sis of compact city in Section 2, followed by the evaluation of urban compactness in Guangdong province in Sections 3. Section 4 discusses the forming mechan-ism of temporal and spatial variation characteristics concerning urban com-pactness. Section 5 puts forward policy proposals. Section 6 concludes.
2. Theoretical Basis
The compact city is not equal to intensive use of land. From the connotation, the compact city pays more attention to the functional coordination and livability of the city. By contrast, the concept of the intensive use of land is too one-sided. The intensive use of land only emphasizes the improvement of land use intensi-ty. In other words, it stressed that increasing the output of unit land area, and saving land as much as possible, especially the arable land. However, land use intensity is not the higher the better, because it not only will bring serious pollu-tion, but also reduce the quality of living environment. Thus, there are serious limitations of only emphasis on the intensive use of land. In contrast, the com-pact city has more abundant meaning. Besides emphasizing as far as possible to revitalize the stock of land and reduce land increment, it also stresses that all kinds of urban functions should be coordinated organically. The city is conve-nient for people to work, live, transport and recreation. Therefore, we should at-tach importance to the difference between the compact city and intensive land use before we calculate the urban compactness.
From the key points of the compact city, it includes the compactness of urban morphology and functions. On the one hand, the essence of the city is popula-tion agglomerapopula-tion, thus the compactness of morphology should not only in-clude the compactness of land use, but also contains the compactness of popula-tion. On the other hand, according to The Athens Charter, the functions of
compact city can be divided into four items (i.e. dwelling, work, recreation and transportation). Specifically, the function of dwelling is not only reflected in the scale of residential land and the intensity of residential investment, but also re-flected in the basic educational resources and medical resources. The function of transportation is embodied in the accessibility of city public transportation since the compact city advocates transit oriented development (TOD). The function of work means that the community can provide sufficient jobs and handsome sala-ry. The function of recreation signifies that the district can provide sufficient leisure resources for the public (recreational facilities, catering service, park green space, art venues, libraries and other recreational facilities nearby the res-idence and work place etc.).
3. The Evaluation of Compactness
3.1. Study Area
[image:4.595.218.528.485.698.2]Guangdong province is located at 20˚13' - 5˚31'N, 109˚39' - 117˚19'E in the sou-thernmost part of mainland China, adjacent to Hong Kong and Macao. The provincial capital is Guangzhou. The land area of Guangdong is 179,770 km2. The resident population was 109,990,000 at the end of the year with the natural growth rate is 7.44‰. Since 1989, Guangdong province’s GDP continued to be the first in the country. It has become China’s largest economic province, which accounts for 1/8 of the total economy on China. In 2016, its GDP is RMB 79,512.05 billion which is increased by 7.5% over the previous year. It covers 21 prefecture level cities, including Guangzhou, Shenzhen, Foshan, Dongguan, Zhongshan, Zhuhai, Jiangmen, Zhaoqing, Huizhou, Chaozhou, Shantou, Jieyang, Shanwei; Zhanjiang, Maoming, Yangjiang, Shaoguan, Qingyuan, Yunfu, Meiz-hou, Heyuan (Figure 1).
Figure 1. The location of Guangdong Province in China.
3.2. Empirical Method
The catastrophe theory is an impactful tool to solve discontinuous sudden issues in the process of continuous change in dynamic system [7] [8]. In catastrophe theory, the dynamic system is considered as a potential function V(x), including state variable (x) and control variables (u). Namely, the equation is V = V(x, u). The balance curved surface can be described by equation V x
( )
′ =0, consisting of all critical points of the function. The singularity set of the balance curved surface is obtained from the equation V x( )
′′ =0. According to two equations,( )
0V x ′ = and V x
( )
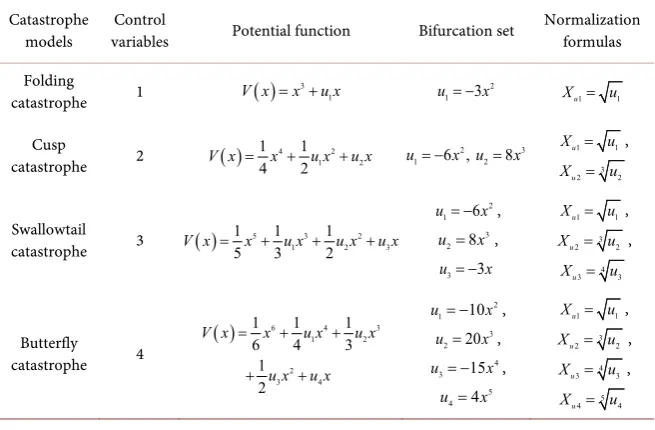
′′ =0, the normalization formulas can be calculated which reflects the relation between state variables (x) and control variables (u). The compactness of prefectural-level city in Guangdong would be evaluated by using catastrophe progression method in Table 1.Two intrinsic relations between state variables (x) and control variables (u) were needed to be defined in the catastrophe progression method. If the control variables and state variables are complementary, then we use the principle of complementarity (i.e. the average of each control variable is assigned to the state variable). Conversely, provided that the control variables and state variables are non-complementary, the assignment of state variables uses the mini-max rule. It is worth noting that the urban compactness calculated by catastrophe progres-sion is a relative number. Namely, the results reflect the urban compactness of one prefecture level cities compared to other 20 prefecture level cities in Guang-dong province.
Therefore, we pay more attention to changes in the relative ranking of urban compactness.
3.3. Indicators and Data Sources
[image:5.595.211.539.514.729.2]Based on the theory related to the compact city, 23 indicators are selected into
Table 1. The catastrophe models in common and their normalization formulas.
Catastrophe
models variables Control Potential function Bifurcation set Normalization formulas Folding
catastrophe 1
( )
3 1
V x =x u x+ 2
1 3
u = − x Xu1= u1
Cusp
catastrophe 2 ( ) 4 1 2 2
1 1
4 2
V x = x + u x u x+ 2 3
1 6 , 82
u = − x u = x Xu1= u1,
3 2 2 u
X = u
Swallowtail
catastrophe 3 ( ) 1 5 1 1 3 1 2 2 3
5 3 2
V x = x + u x + u x u x+
2
1 6
u = − x ,
3
2 8
u = x ,
3 3
u = − x
1 1 u
X = u ,
3 2 2 u
X = u ,
4 3 3 u
X = u
Butterfly catastrophe 4
( ) 6 4 3
1 2
2
3 4
1 1 1
6 4 3
1 2
V x x u x u x
u x u x
= + +
+ +
2
1 10
u = − x ,
3
2 20
u = x ,
4
3 15
u = − x ,
5
4 4
u = x
1 1 u
X = u ,
3 2 2 u
X = u ,
4 3 3 u
X = u ,
5 4 4 u
X = u
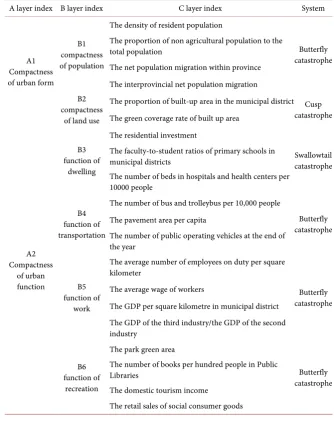
the indices system. By analysing the collinearity and correlation of the data, the two indexes (i.e. the area ratio of built-up area and the ratio of urban park green space) were excluded. Because only Guangzhou and Shenzhen have subway in Guangdong province, in order to make the data comparable, the index which is the length of metro line is eliminated. Therefore, the remaining 20 indicators are involved in the index system.
The indicator data should be normalized to a dimensionless value between 0 and 1 due to the non-uniform of the indicator’s dimension. Since the 20 indica-tors used are positive indicaindica-tors, the formula of standardization is:
(
min) (
max min)
i i
y = x x− x −x (1)
[image:6.595.205.540.304.733.2]where yi is the normalized value of each indicator; xi, xmax and xmin are the initial, maximum, and minimum value of each indicator in Table 2 respec-tively.
Table 2. The index system of urban compactness in Guangdong Province.
A layer index B layer index C layer index System
A1 Compactness of urban form
B1 compactness of population
The density of resident population
Butterfly catastrophe The proportion of non agricultural population to the
total population
The net population migration within province The interprovincial net population migration B2
compactness of land use
The proportion of built-up area in the municipal district Cusp catastrophe The green coverage rate of built up area
A2 Compactness of urban function B3 function of dwelling
The residential investment
Swallowtail catastrophe The faculty-to-student ratios of primary schools in
municipal districts
The number of beds in hospitals and health centers per 10000 people
B4 function of transportation
The number of bus and trolleybus per 10,000 people
Butterfly catastrophe The pavement area per capita
The number of public operating vehicles at the end of the year
B5 function of
work
The average number of employees on duty per square kilometer
Butterfly catastrophe The average wage of workers
The GDP per square kilometre in municipal district The GDP of the third industry/the GDP of the second industry
B6 function of
recreation
The park green area
Butterfly catastrophe The number of books per hundred people in Public
Libraries
The domestic tourism income
The retail sales of social consumer goods
The data sources are Statistical Yearbook of Guangdong Province and Ur-ban Statistical Yearbook of China from 2000 to 2016, Development Research Center of the State Council (DRCnet), China Statistical Yearbooks Database from CNKI. Concretely, indicators B1, B2 and B4 are from Statistical Yearbook of Guangdong Province. Indicators B3 is from Urban Statistical Yearbook of China. Indicators B5and B6 are from DRCnet and CNKI respectively.
3.4. Empirical Results
3.4.1. The Time Variation Characteristics of Urban Compactness
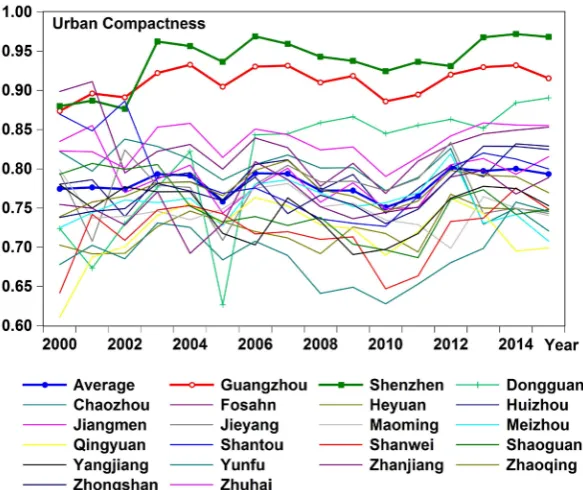
The average city compactness of Guangdong province have changed little from 2000 to 2015 which fluctuates in the range of 0.75 - 0.80. Since 2003, Shenzhen has been the highest degree of urban compactness in Guangdong province. Guangzhou and Shenzhen have been at the first gradient which urban compact-ness are far ahead. Dongguan caught up from behind since 2006 and ranks third over a long period of time. Heyuan, Yangjiang, Qingyuan and Yunfu have long been at the bottom (Figure 2 & Figure 5). In 2005, there was an obvious turning point in all the cities due to the significant changes in statistical calibre (i.e. city, town and urban population) in China.
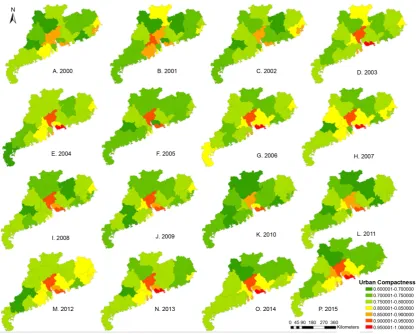
3.4.2. The Spatial Variation Characteristics of Urban Compactness Figure 2 is the spatial distribution of urban compactness in Guangdong prov-ince sprov-ince 2000. Specifically, green color means low urban compactness and redcolor means high compactness. Urban compactness are divided into seven classes by equal distance. According to the different colors of the legend, the dif-ference among 21 prefecture-level cities in Guangdong province can be seen, which are four main aspects following.
With the core of Guangdong, Hong Kong and Macao Bay Area, fan-shaped diffusion of city compactness and spatial distribution pattern is formed. In par-ticular, in the Guangdong, Hong Kong and Macao Bay Area, the urban com-pactness is highest, which displayed in red, orange and yellow color. Each city compactness shows strong unbalanced characteristics which are affected by the serious imbalance of regional economic development in Guangdong province (Figure 2).
Especially in the 2015, this feature is very obvious (Figure 2(P)). The average city compactness of Guangdong province is 0.7934, and is consistent with the median approximation in 2015. The highest degree of compactness was in Shenzhen which reached 0.9682, followed by Guangzhou which reached 0.9154. And the third is Dongguan which reached 0.8862. In contrast, the urban com-pactness of eastern Guangdong, western Guangdong and the northern part of Guangdong are lower.
Firstly, as the provincial capital, Guangzhou is not the head of the compact city. It’s not caused by the adjustment of Guangzhou District. In reality, Shenz-hen has been the city with the highest urban compactness in Guangdong prov-ince sprov-ince 2003. Specifically, Zengcheng county-level city and Conghua county-level
Figure 2. The urban compactness of Guangdong province from 2000 to 2015.
city become part of Guangzhou in 2014, thus the municipality area of Guang-zhou expanded from 3843.43 km2 to 7434.4 km2 (i.e. the administrative area of Guangzhou was nearly doubled). Guangzhou’s integrated compactness has de-creased especially in the compactness of urban morphology because the growth rate of urban physical area is far lower than the growth rate of administrative area. But even so, the impact of adjustment of administrative regions is only re-ducing the urban compactness in Guangzhou from 0.9320 in 2014 to 0.9154 in 2015. Shenzhen relies on scientific and technological innovation in recent years, thus its development speed of the economy is growing faster than Guangzhou.
Secondly, Shenzhen is the most compact city with great potential for promo-tion. Although the administrative area of Shenzhen is 1996.85 km2 which less than 1/3 of the administrative area of Guangzhou, it has many other advantages (e.g. large population, sufficient employment, large construction land area). In addition, Shenzhen became a special economic zone in 1980. Due to the best re-source supported by the whole country, its urban planning is more standardized and perfect. And its road network and land use layout are more reasonable. Moreover, Shenzhen has a package of talent introduction programs which at-tract a large number of migrant population. It has significantly improved the population concentration of Shenzhen.
Thirdly, the non-core prefecture level cities have individual advantages. For example, the ecological environment in Zhuhai and Yunfu is beyond compare. Their coverage rate of green land is highest. In the meantime, the urbanization level of Foshan reached its peak, so its population density is remarkably in-creased. The reason is that Foshan has abolished household categories (i.e. the agricultural and the non-agricultural registered permanent residence) from July 2004. All residents shall be registered as Foshan Registered Residents. Foshan is earlier than unified reform of the national household registration system which began in 2014. Hence, Foshan has achieved remarkable achievement 14 years ago when it began to change urban-rural dual structure.
Fourthly, the transportation function of eastern Guangdong, western Guang-dong and northern GuangGuang-dong are low. However, they have the natural advan-tages for the development of compact city as a result of their narrow built-up area, high degrees of comprehensive urban land. They can make the organic in-tegration of various urban functions (e.g. residence, employment, shopping, lei-sure and entertainment) in a small area. Meanwhile, they can provide more job opportunities in shorter commuting distance, thus they are more consistent with the pedestrian transportation system which is led by the compact city.
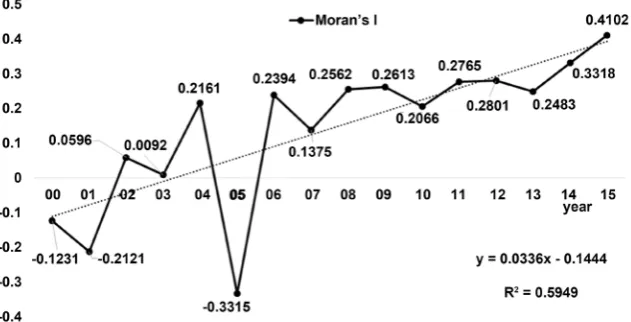
3.4.3. The Spatial Autocorrelation Analysis of Urban Compactness The global spatial autocorrelation in Guangdong changed from negative to posi-tive, which meant that urban compactness changed from spatial dispersion into spatial agglomeration from 2000 to 2015. Besides the abnormal value in 2005, the variation tendency of Global Moran’s I in other years is positive. Global Moran’s I evaluates whether the distribution of urban compactness is clustered, dispersed, or random. In Equation (2), we use linear regression model to fit the trend of original values. The coefficient of X is positive (i.e. 0.0336), once again verifies the increasing trend of Global Moran’s I year by year. In the meantime, the R2 is 0.5949 which represents a good model fitting effect.
0.0336 0.1444
y= x− (2) where y is Global Moran’s I, x is the year.
From 2000 to 2001, the Global Moran’s I is less than 0, representing negative spatial autocorrelation. For the geographic distribution of urban compactness in Guangdong province, high values tend to be geographic neighbors of low values, low values tend to be geographic neighbors of high values, and intermediate values tend to be geographic neighbors of intermediate values. In other words, dissimilar values are next to each other in 21 prefecture level cities (Figure 3).
In 2003, the Moran’s I is close to 0 typically indicating no autocorrelation. Af-ter 2006, Global Moran’s I is positive and keeping the growth trend, which demonstrates positive spatial autocorrelation. It means that high values tend to be geographic neighbors of high values, intermediate values tend to be geo-graphic neighbors of intermediate values, and low values tend to be geogeo-graphic neighbors of low values (Figure 3).
Figure 3. The Global Moran’s I from 2000 to 2015.
The whole change process shows that the urban compactness of Guangdong province has changed from scattered state to concentrated state. In the initial stage of development, the compactness of intercity gap is big. After that, the cit-ies in Guangdong province gradually form urban agglomerations, and the neighboring cities are becoming more and more similar.
3.4.4. The Balance Analysis of Urban Compactness
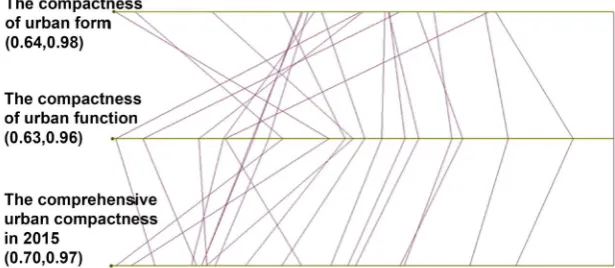
The compactness of 21 prefecture level cities in Guangdong province showed strong disequilibrium according to the large slope of broken lines (Figure 4). In the parallel coordinate plot (PCP), each index considered in a multivariate com-parison becomes a parallel axis in the graph. Each index has been rescaled, such that the mininum value is on the left end point, and the maximum on the right hand side. The observations are sorted by increasing magnitude from left to right. Similar city has similar polyline trend.
3.4.5. The Comparison between Morphology Compactness and Function Compactness
The compactness of urban function and the compactness of urban morphology are not uniformly distributed, especially in Qingyuan, Zhanjiang, Shaoguan, Maoming, Meizhou. In those cities, the compactness of urban function is greater than the compactness of urban morphology. The Guangdong provincial gov-ernment has insisted on Hand in Hand Aid, vigorously carrying out infrastruc-ture construction in poor prefecinfrastruc-ture level cities, and promoting industrial trans-fer over the years, hence the urban functions of less developed areas have been enhanced.
4. Mechanism Analysis
Karl Gunnar Myrdal put forward the polarization effect, expansion effect and return effect to analysis the concentration and dispersion of regional production in 1968. We used his analytical framework to interpret the changing mechanism of urban compactness from 2000 to 2015.
Figure 4. The parallel coordinate plot in 2015.
4.1. The Polarization Effect of Urban Compactness
The polarization effect of urban compactness means that the city can conti-nuously accumulate favorable resources (e.g. a large number of talents, funds, technology) to develop after the takeoff period. Accordingly, the compactness of cities with first-mover advantage will increase. By contrast, the economic base of backward areas is poor. And its talents and funds will be out of circulation, which is difficult to play a cluster effect and scale effect. In addition, its building density and plot ratio are small due to the low housing demand and land prices. Under the influence of market mechanism, the Matthew Effect appears in the urban compactness of developed areas and backward areas, namely the gap of urban compactness between developed and backward city will widen. The urban compactness of growth pole will accelerate.
High gradient cities, just like Guangzhou and Shenzhen, have great advantag-es (strong capital, concentrated market of consumer, perfect infrastructure and abundant human capital, convenient transportation and communication system etc.) in economic development to attract more and more people to live here. The essence of city is population accumulation. The population agglomeration re-quires the government to invest more capitals for infrastructure construction and public facilities construction, increasing employment opportunities. Then it will attract more immigrants to move in again. The cycle of Multiplier Effect will further promote the polarization of urban compactness and enhance the polari-zation effect. In Figure 5, it shows that Guangzhou and Shenzhen have always been the growth poles in 21 prefecture level cities from 2000 to 2015, especially after 2003.
4.2. The Diffusion Effect of Urban Compactness
When the urban compactness exceeds the reasonable threshold, the problems (e.g. high housing prices, environmental deterioration, serious pollution, in-creasing living costs, fierce competition among talented people), will induce some people to leave the big city. As a result, as the population spreads from large cities to medium-sized cities which are adjacent to large cities, the com-pactness of medium-sized cities will increase. This is the diffusion effect.
Figure 5. The polarization effect of urban compactness.
The diffusion effect of urban compactness is most evident in Dongguan which is adjacent to Guangzhou and Shenzhen. Since 2006, the urban compactness in Dongguan has increased rapidly which has remained third in Guangdong prov-ince in general (Figure 5). The reason why the diffusion effect was obvious after 2006 is closely related to the development of real estate market in China. To be specific, in 1998 China began the reform of the housing market, then the com-mercial housing market has developed. In the early stage, the gap of real estate price between the cities is small. However, the real estate price of the cities with first mover advantage rises faster than the housing prices of backward areas. Af-ter several years of development, the housing price in Guangzhou and Shenzhen reached high prices in the province. Meanwhile, urban diseases (large popula-tion growth, pollupopula-tion, traffic congespopula-tion, high housing price-to-income ratio etc.) in Guangzhou and Shenzhen are beginning to appear, more labor force gradually transferred to low gradient city which leads the compactness of Dongguan to aggrandize.
4.3. The Return Effect of Urban Compactness
The return effect is the opposite of the diffusion effect. Although part of the la-bor force was moved to small cities, the infrastructure and employment envi-ronment provided by small cities has no ability to retain all talents. Then small group of transferred labor force will return to the big city. Other factor mobility is accompanied by the flow of population, thus the outflow of elements will make cities uncompact.
Due to the market mechanism, the return effect always precedes and greater than the diffusion effect. More specifically, when the compactness of metropolis
is far above the average level in Guangdong province, the metropolis will receive continuous accumulation of competitive advantage. On the contrary, back-ward areas can only accumulate unfavorable factors. The widening gap of urban compactness caused by cumulative causal cycle. That’s why the surrounding ci-ties still can’t go beyond Guangzhou and Shenzhen from 2000 to 2015 (Figure 5).
5. Policy Proposals
5.1. Focus on the Development of Intercity Rail Transportation
Public transport oriented is a kind of land use pattern that Guangdong province must adhere to. In order to improve the compactness of regional traffic, rail transit should be developed. At present, only Guangzhou and Shenzhen have operated the subway in Guangdong Province. And the highway construction in the whole province is almost saturated, so the development of intercity rail transportation has greater potential. The number of public transport per capita and the density of bus routes in the backward city is low, which makes numer-ous citizens more dependent on private cars. According to the concept of the compact city, it’s necessary for Guangdong province to speed up the construc-tion of the subway and intercity light rail in order to improve the coverage of public transportation.
The Global Moran’s I of urban compactness in Guangdong province is posi-tive, which signifies that the adjacent city is becoming more and more similar. Consequently strengthening the connection among cities by public transport will consolidate the development in the urban agglomeration of Guangdong- Hong Kong-Macao Greater Bay Area.
5.2. Promote Three Old Transformation of Backward Area
Three Old Transformation is a unique mode of transformation in Guangdong Province, which refers to the renewal of old towns, old factories and old villages. At present, the implementation of Three Old Transformation in high gradient cities are very successful. However, the implementation in eastern Guangdong, western Guangdong and the northern Guangdong are insufficient. Accordingly, Guangdong province should intensify efforts to promote the Three Old Trans-formation project in the low gradient cities, in order to revitalize the stock land, improve the efficiency and livability of the city.
In the future, urban compactness of Guangdong province still needs gradient growth. Regional coordinated development is not the pursuit of the disappear-ance of the absolute difference in urban compactness among cities, but the pur-suit of club convergence.
6. Conclusions and Discussions
The compact city is a planning tool to curtail urban sprawl, to support greater uti-lisation of existing infrastructure and service in established areas and to improve
connectivity of employment and transit hubs. As far as China is concerned, land saving in the process of rapid urbanization is critical to the long-term sustaina-bility. Especially for big cities, urban diseases caused by urban sprawl and popu-lation agglomeration are becoming more and more serious. Therefore, the com-pact city is the only way for the development of megacities in China.
This paper selects Guangdong Province as a case study, whose GDP continued to be the first in China since 1989. It uses catastrophe progression method to calculate the urban compactness of Guangdong, then carries out the spatial analysis in order to analyze the time variation characteristics of urban compact-ness, the balance of urban compactness and the comparison between the com-pactness of urban morphology and urban function. The main results are as fol-lows. 1) The average city compactness of Guangdong province has changed little from 2000 to 2015 in the range of 0.75 - 0.80. And the city compactness of Shenzhen, Guangzhou and Dongguan are the top three cities in 2015. 2) With the core of Guangdong, Hong Kong and Macao Bay Area, fan-shaped distribu-tion of city compactness is formed. The urban compactness is strongly unba-lanced. 3) The functional compactness and morphological compactness of the cities in the less developed areas are quite different. 4) The Global Moran’s I of urban compactness in Guangdong changed from −0.3315 to 0.4102 during the period from 2000 to 2015, which means that spatial autocorrelation is conti-nuously enhanced. 5) The spatial difference of urban compactness in Guang-dong is mainly affected by polarization effect, diffusion effect and return effect. 6) Guangdong oughts to focus on the development of intercity rail transporta-tion to improve regional traffic compactness and the process of Three Old Transformation in the low gradient city.
The marginal contribution of the paper is to expand the application of catas-trophe progression method in the calculation of urban compactness. Besides, the paper uses the classical theory of regional economic to interpret the formation mechanism concerning the spatial and temporal variation characteristics in compact cities. The polarization effect, diffusion effect and return effect were used to explain the reasons why the spatial distribution of urban compactness is unbalanced in 21 prefecture level cities of Guangdong Province.
The future research could focus on the reasonable threshold of urban com-pactness. The existing literature, including this article, implies that “the higher the compactness of the city, the better”. However, that’s not the case because ex-cessive compactness will lower the quality of living. Hence, we can try to deter-mine the reasonable range of urban city compactness. Namely, when the com-pactness exceeds a range, the city should be evacuated organically. When the compact degree is lower than a certain range, the city should be infilled devel-oped within the existing boundaries.
Conflicts of Interest
The authors declare no conflicts of interest regarding the publication of this paper.
References
[1] Bunker, R. (2014) How Is the Compact City Faring in Australia? Planning Practice & Research, 29, 449-460. https://doi.org/10.1080/02697459.2014.945376
[2] Jim, C.Y. (2013) Sustainable Urban Greening Strategies for Compact Cities in De-veloping and Developed Economies. Urban Ecosystems, 16, 741-761.
https://doi.org/10.1007/s11252-012-0268-x
[3] Shanahan, D.F., Cox, D.T.C., Fuller, R.A., et al. (2017) Variation in Experiences of Nature across Gradients of Tree Cover in Compact and Sprawling Cities. Landscape & Urban Planning, 157, 231-238. https://doi.org/10.1016/j.landurbplan.2016.07.004
[4] Tan, P. Y., Feng, Y. and Hwang, Y.H. (2016) Deforestation in a Tropical Compact City (Part A): Understanding Its Socio-Ecological Impacts. Smart and Sustainable Built Environment, 5, 47-72. https://doi.org/10.1108/SASBE-08-2015-0022
[5] Tsai, Y.H. (2005) Quantifying Urban Form: Compactness versus Sprawl. Urban Studies, 42, 141-161. https://doi.org/10.1080/0042098042000309748
[6] Jabareen, Y.R. (2006) Sustainable Urban Forms Their Typologies, Models, and Concepts. Journal of Planning Education & Research, 26, 38-52.
https://doi.org/10.1177/0739456X05285119
[7] Huang, Y. and Iwamoto, S. (1995) Analysis of a Possible Reason for Oscillation Phenomena in a Diesel-Generator Set through Catastrophe Theory. IEEE Transac-tions on Energy Conversion, 10, 700-705. https://doi.org/10.1109/60.475842
[8] Schreiber, F.A., Baiguera, M., Bortolotto, G. and Caglioti, V. (1997) A Study of the Dynamic Behaviour of Some Workload Allocation Algorithms by Means of Catas-trophe Theory. Journal of Systems Architecture, 43, 605-624.
https://doi.org/10.1016/S1383-7621(96)00118-X