Identification of Paddy Planted Area Using ALOS
PALSAR Data
Rizatus Shofiyati1, Ishak Hanafiah Ismullah2, Dan Dudung Muhally Hakim2
1Indonesian Center for Agricultural Land Resources Research and Development (ICALRD),
Indonesian Ministry of Agriculture, Bogor, Indonesia
2Bandung Institute of Technology (ITB)
E-mail:[email protected]
Received June 23, 2011; revised August 2, 2011, accepted August 15,2011
Abstract
Agricultural land has a strategic function as the primary food provider for the people of Indonesia. Various methods of agricultural production estimation, particularly food crops, provide different information. It can be a source of error in decision making.Satellite data, provides information periodically, wide coverage area, can be used as a source of information on the condition of agricultural lands and even remote areas. The advantages of SAR data that does not depend on sunlight and can penetrate of clouds and fog can fill the lack of optical data.ALOS PALSAR data has been used for analysis and ALOS AVNIR-2 is for checking of land cover visually, with acquisition date on 10 May 2007. Sampling of each rice crop growth period used several of rice field conditions in each period, on one scene data. Results showed a possibility to use soil moisture conditions derived from ALOS PALSAR for estimating rice planting area. On a scatter diagram between backscatter of ALOS PALSAR and near infrared of ALOS AVNIR-2 showed a specific pattern for each growing period of paddy. The results of the analysis produce distribution maps of the rice planting area Subang area, West Java Province. However, validation of the method used remains to be done. Remote sensing results of this study are expected to provide better information and can contribute in the planning of higher quality agricultural land.
Keywords: Rice Planting Area, Moisture Content, ALOS PALSAR
1. Introduction
Paddy field has a strategic function, because it is a main food supplier for people in Indonesia. Current estimation methods of agricultural production provide various data and information, so its reliability is questionable. One source of error lies in information on acreage of paddy fields, which resulted in calculation of planting area and yields are not true. According to official data from Cen-ter Bureau Statistic, an area of rice fields in Indonesia is 8.1 million hectares [1], but there are several data sources provide different information of rice field area. Until now there is no uniformity in the data area of wet-land that is used by different parties is the main cause of differences in data collection methods and years of ex-pansion. It could be argued that the rate of change (transfer function) of wetland is much faster than the period of data collection statistics. According to refer-ence [2], alleged that the decline of the agricultural land
area in Indonesia reached 27,000 ha/year, which is generally in the form of wetland and dry land. The changes are so great, of course, very difficult to follow by the rate of data collection statistics.
Indonesia has very wide coverage area that consists of thousands of islands with a various geographic conditions. It causes difficulties to do field data collection activities. Cost for inventory, monitoring and updating of land use in the conventional way through a field survey is very high, so the method can not be implemented in a relatively short time. Remote sensing technology that record periodically earth surface can be used as an alternative to support of field research mainly to changes in land use, including the planting period in the paddy field. Hence, coverage of satellite data provides information of agricultural land condition even in remote area.
ness and wetness which is related to biomass, while SAR data can detect soil moisture, leaf water content, and plant height. SAR data has a larger wavelength has ability to penetrate clouds and atmospheric disturbances caused by dust, smoke and fog, is expected to fill weakness of multi spectral optical data which has shorter wavelengths. Combination of multi spectral optical and SAR data is expected to improve analysis quality. Main parameters can be observed is correlated with changes in of plants in different crop growth periods such as age, height, biomass, and that correlated with water conditions such as soil moisture and plant water content.
Advanced Land Observing Satellite (ALOS) is an earth observation satellite which not only has optical devices, but also equipped with a set of L-band Synthetic Aperture Radar [3-4]. It also has multi-polarization, that is effectively used to obtain information on global and regional vegetation, distinguishing appearance on the earth's surface, land use classification, and others [5]. With the acquisition period in every 46 days, large enough spatial resolution, wavelength L-band, and multi polarimetri, ALOS data will be used to identify the cropping pattern in paddy field.
Spatial resolution of ALOS can be applied to agricultural land in Indonesia, especially Java, which land ownership of less than 0.5 hectare [6-7]. In fact, the Java Island is center of national rice production. Although area of Java is 7% of total area of Indonesia, the island has contribution to national rice production that is estimated never less than 50% [8]. Productivity of paddy and dry fields in Java 1996-2000 year was an average 50.14 quintal per hectare compared to 43% higher outside Java productivity average of only 35.05 quintal per hectare [9]. Therefore, condition of agricultural land located in Java should be a consideration in selecting satellite data used. Use of remote sensing technology is expected to give more correct information and have contributed in planning of agricultural land, and more qualified agricul- tural development policies.
This paper explains results of study on soil moisture content condition in paddy fields using SAR data to identify paddy planted area.
2. Material and Methods
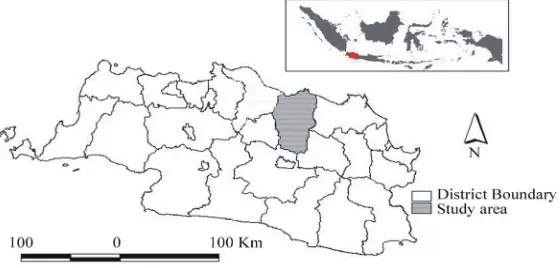
2.1. Study Area
Research has conducted on Subang area, West Java Province. The location is situated between coordinates 106˚22' - 107˚55' East Longitude dan 5˚55' - 6˚31' South Latitude. Map of research location is presented in Figure 1.
2.2. Data Used
ALOS PALSAR has been analyzed to get water content data and ALOS AVNIR-2 for visually comparation. The description of data used is in Table 1. Date of acquisition
of both data is 10 May, 2007. Other data used is Land Use Map of West Java Province produced by reference [10].
2.3. Research Method
Backscatter value of ALOS PALSAR data were obtained by using the following calculation [11]:
010*log
10DN2CF (1)
where: 0 = backscatter coefficient (dB);
DN = digital
number of PALSAR image; CF = factor calibration =
−83.0 dB (st.dev 0.64 dB).
To calculate soil water content of backscatter (dB) used a simple linear equation refers some research results [12-14] as follows:
VSM = a 0 + b (2)
[image:2.595.160.440.571.705.2]A study conducted by [15], on relatively plain lowland areas, value of a is 0.99 and b is 43.8, so the equation obtained is:
Table 1. Description of ALOS images used.
No. Scene ID Path Frame Mode Orbit Direction Off Nadir Resolution Polarization/ Cloud cover
1 ALPSRP068787060 432 7060 PLS Ascending 21,5˚ 25 m HH, HV, VV, VH
2 ALAV2A068713730 110 3730 OBS Descending 10 m 11% - 20%
VSM = 0.99 0 + 43.8 (3)
while for not flat area, value of a is 1.37 and b is 29.1, so equation used is as follows:
VSM = 1.37 ∆0 + 29.1 (4)
where: VSM = volume soil moisture (%); a and b = co-efficient that is depended on backscatter and polarization;
0 = backscatter coefficient; ∆0 = backscatter
coeffi-cient that has reduced by roughness effect.
The study site that is located in northern coastal area, has large lowland paddy fields. Assuming that the study site is flat area, Equation (3) is used for calculation of moisture content.
3. Results and Discussion
3.1. Backscatter
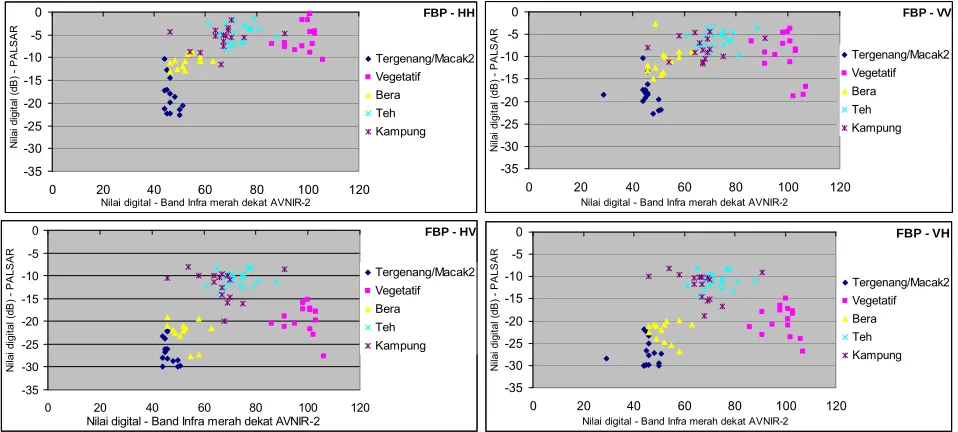
The result showed that L-band of HV polarization gives clearly pattern for different paddy growing period, i.e. flooded, vegetative, and bare. Similarly, in another land cover, such as tea plantation and village, has. According to reference [15], in period of maturity, HH polarization provides higher backscatter coefficient than VV. Back-scatter pattern of each growing period of paddy is presented in Figure 2.
3.2. Soil Mositure
According to reference [16], soil moisture conditions in paddy fields during paddy growing period, generally about 40%. While at the time of inundation or can be referred in water saturated conditions, soil moisture is 100%. Similarly, research results conducted by [12], volume of soil moisture (VSM) values on agricultural land of planting, growing, and harvesting ranges from 20 to 40%. Based on these conditions, equation 3 gives more prevalent calculation results compared to equation 4 which include influence of surface roughness. HH and VV polarization provides a more appropriate value of VMS in paddy fields. The diagram of VMS is presented in Figure 3.
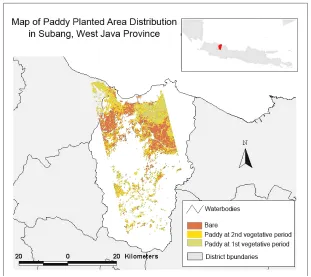
3.3. Paddy Planted Area
Soil or land moisture is calculated using ALOS PALSAR data backscatter. Analysis result produces a distribution map of rice planted area in Subang, West Java Province (Figure 4). Based on the value of VMS, it can be
estimated area of paddy as listed in Table 2.
Estimated paddy panted area at 2nd period of growing
stage at the next 2 months and vegetative 1 between 1 and 1.5 months (25 - 40 days). While the growth period
FBP - HH 0 -35 -30 -25 -20 -15 -10 -5
0 20 40 60 80 100 120
Nilai digital - Band Infra merah dekat AVNIR-2
Ni la i di gi tal (dB
) - P
A LS A R Tergenang/Macak2 Vegetatif Bera Teh Kampung
FBP - VV 0 -35 -30 -25 -20 -15 -10 -5
0 20 40 60 80 100 120
Nilai digital - Band Infra merah dekat AVNIR-2
N ila i d ig ita l ( dB ) - P A LS A R Tergenang/Macak2 Vegetatif Bera Teh Kampung
FBP - HV
0 -35 -30 -25 -20 -15 -10 -5
0 20 40 60 80 100 120
Nilai digital - Band Infra merah dekat AVNIR-2
N ila i d ig ita l ( dB ) PA LS AR Tergenang/Macak2 Vegetatif Bera Teh Kampung
FBP - VH
0 -35 -30 -25 -20 -15 -10 -5
0 20 40 60 80 100 120 Nilai digital - Band Infra merah dekat AVNIR-2
N ila i d ig ita l ( dB) PAL S AR Tergenang/Macak2 Vegetatif Bera Teh Kampung
[image:3.595.58.537.492.708.2]FBP - HH
26,74
5,49
38,49
21,75
33,70
15,12
0 10 20 30 40 50
0,99 σ˚ + 43,8 1,37 ∆σ˚ + 29,1
V
o
lu
me
k
e
le
mb
a
b
a
n
t
a
n
a
h
(
%
)
Tergenang/Macak2 Vegetatif Bera FBP - VV
25,75
4,12
34,20
15,81
33,03
14,20
0 10 20 30 40 50
0,99 σ˚ + 43,8 1,37 ∆σ˚ + 29,1
V
ol
um
e
k
e
le
m
ba
ba
n
t
a
na
h
(%
)
Tergenang/Macak2 Vegetatif Bera
FBP - HV
17,47
-7,34
24,14
1,90
21,84
-1,30
-20 -10 0 10 20 30 40 50
0,99 σ˚ + 43,8 1,37 ∆σ˚ + 29,1
V
o
lu
me kel
em
b
a
b
a
n
t
a
n
a
h
(
%
)
Tergenang/Macak2 Vegetatif Bera FBP - VH
16,80
-8,27
23,98
1,67
21,71
-1,47
-20 -10 0 10 20 30 40 50
0,99 σ˚ + 43,8 1,37 ∆σ˚ + 29,1
V
ol
u
m
e
k
e
le
m
ba
ba
n
ta
n
a
h (
%
)
[image:4.595.70.527.85.390.2]Tergenang/Macak2 Vegetatif Bera
Figure 3. Volume of soil moisture at period of inundated, vegetative, and bare.
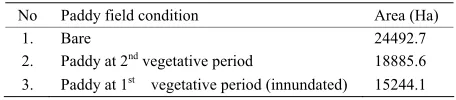
[image:4.595.141.452.422.699.2]Table 2. Paddy planted area in May 2007.
No Paddy field condition Area (Ha)
1. Bare 24492.7
2. Paddy at 2nd vegetative period 18885.6
3. Paddy at 1st vegetative period (innundated) 15244.1
of rice (lowlands) from planting to harvest about 105 days [17,18]. An estimated 2 months ahead of harvest area of about 18885.6 ha, and 3 months ahead 15244.1 ha. Assuming that productivity of paddy is 4.5/ha, referred to national productivity average [7,19], esti- mated that rice production in the study area at next 2 months is 84985, 2 tons and 68598.5 tons for next 3 months. Estimated conditions of rice plants is done by visually comparing of appearance of the ALOS satellite data AVNIR-2 and experience of researchers in analyzing satellite data for food crops, especially paddy.
4. Conclusions
By using ALOS Image AVNIR-2 to observe diffe- rences in land cover visually, indicating a specific pattern of light reflection from ALOS PALSAR satellite images and can be used to distinguish the condition of paddy field.
Water content estimation obtained from backscatter values of ALOS PALSAR has the possibility to be used to identify rice growing period. Hence, it can be used to create a distribution map of rice planting area.
5. Acknowledgements
The authors are grateful to the Indonesian Center of Ag-ricultural Land Resources Research and Development (ICALRD) of Indonesian Ministry of Agriculture, and Geodetic and Geoinformatic of Bandung Institute of Technology (ITB) for providing facilities, data, and en-couragement for this study. Authors are also thankful to the Directorate General of Higher Education (DIKTI), of Indonesian Ministry of National Education for providing funds for this research activity. Authors thanks also is conveyed to JAXA for allowing authors to use ALOS satellite data from Working Group of JAXA ALOS Project activities for this research.
6. References
[1] Central Bureau of Statistics, “Indonesian Statistics Year 2000 (Statistik Indonesia Tahun 2000),” Central Bureau of Statistics (Badan Pusat Statistik Indonesia), Jakarta, 2000.
[2] State Secretariat of Republic of Indonesia, Decreasing Area of Food Crops Need Caution (Penyusutan Luas
La-han Tanaman Pangan Perlu Diwaspadai), 2000. http://www.setneg.go.id/index2.php?option=com_content &do_pdf=1&id=4617
[3] L. Samarakoon, “Overview of Remote Sensing Technol-ogy for Disaster Risk Management,” MODIS Workshop, Bangkok, 15-16 January 2007, pp. 1-79.
[4] A. Rosenqvis, M. Shimada and M. Watanabe, “ALOS PALSAR: Technical Outline and Mission Concepts, Ja-pan Aerospace Exploration Agency,” Proceeding of 4th International Symposium on Retrieval of Bio- and Geo-physical Parameters from SAR Data for Land Applica-tions, Innsbruck, 16-19 November 2004, pp. 1-7. [5] Earth Remote Sensing Data Analysis Center—ERSDAC.
Earth Remote Sensing Data Analysis Center, “Overview of the ALOS, PALSAR User’s Guide,” PALSAR Data Service Section, Technical Department II, Earth Remote Sensing Data Analysis Center (ERSDAC), Tokyo, 2006, pp. 1-15.
[6] Central Bureau of Statistics, “Indonesian Statistics Year 2004 (Statistik Indonesia Tahun 2004),” Central Bureau of Statistics (Badan Pusat Statistik Indonesia), Jakarta. 2004.
[7] A. Abdurachman and W. Dan R. Shofiyati, “Biophysical Criteria in the Determination of the Main Paddy Field in Java (Kriteria Bio-Fisik Dalam Penetapan Lahan Sawah Abadi Di Pulau Jawa),” Journal of Agricultural Research and Development (Jurnal Penelitian dan Pengembangan. Pertanian), Vol. 24, No. 4, 2005, pp 131-136.
[8] Ashari, “Fenomena Konversi Lahan Sawah di Pulau Jawa,” Warta Penelitian dan Pengembangan Pertanian, Vol. 25, No. 2. 2003, pp. 1-2.
[9] Irawan. “Behavior of Indonesian Rice Supply and Its Implications for Increased Production (Perilaku Suplai Padi Indonesia dan Implikasinya terhadap Peningkatan Produksi),” Prosiding Perspektif Pembangunan Perta-nian dan Kehutanan tahun 2001 ke Depan, Pusat Peneli-tian dan Pengembangan Sosial Ekonomi Pertanian, Badan Penelitian dan Pengembangan Pertanian, 2001.
[10] Local Government of West Java Province, “Map of Land Use of West Java Province (Peta penggunaan lahan Provinsi Jawa Barat),” Local Government of West Java Province, Bandung, 2005.
[11] M. Shimada, N. Itoh, M. Watanabe, T. Moriyama and T. Tadono, “PALSAR Initial Calibration and Validation Results,” Proceeding SPIE, 20 December 2006, pp 6359-6367.
[12] R. Sonobe, H. Tani, X. Wang and M. Fukuda, “Estima-tion of Soil Moisture for Bare Soil Field Using ALOS/PALSAR HH Polarization Data,” Agricultural In-formation Research, Vol. 17, No. 14, 2008, pp. 171-177. doi:10.3173/air.17.171
[13] A. Oldak, T. J. Jackson and P. Starks, “Mapping near-Surface Soil Moisture on Regional Scale Using ERS-2 SAR Data,” International Journal of Remote Sensing, Vol. 20, No. 22. 2003, pp. 4579-4598.
doi:10.1080/0143116031000070463
“Soil Moisture Estimation with ERS-1 SAR Data in the East-German Loess Soil Area,” International Journal of Remote Sensing, Vol. 19, No. 2, 1998, pp. 237-243. doi:10.1080/014311698216224
[15] Y. Kim, S. Hong, J. Park, E. Lee and H. Lee, “Radar Backscattering Measurements of Paddy Rice Field using L, C, and X-band Polarimetric Scatterometer,” Proceed-ing of ISRS, 2007.
[16] J. L. Havlin, J. D. Beaton, S. L. Tisdake, Dan W. L. Nel-son, “Soil Fertility and Fertilizers: An Introduction to Nutrient Management,” 6th Edition, Prentise Hall, Upper Saddle River, 1999.
[17] C. Brouwer, K. Prins and M. Heibloem, “Irrigation Water Management: Irrigation Scheduling,” FAO Corporate Document Repository, 1989.
[18] Perum Jasa Tirta II. Surat Keputusan Direksi Perum Jasa Tirta II Nomor 1/474/KPTS/2006 Tentang Rencana Pokok Penyediaan dan Penggunaan Air Untuk Tanam Padi Rendeng MT 2006/2007, Tanam Padi Gadu MT 2007 dan Tanam Palawija MT 2007 Serta Kebutuhan Air Untuk Air Minum, Industri, Perkebunan, dan Penggelon-toran Kota Tahun 2006/2007. Perum Jasa Tirta II. 2006. [19] A. Abdurachman, Wahyunto and R. Shofiyati, “Gagasan