MASTER THESIS
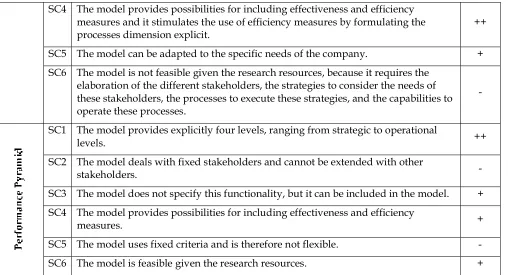
University of Twente
School of Management and Governance Enschede, The Netherlands
Tolga Tanaydin
Master program: Industrial Engineering and Management Specialization: Production and Logistic Management
Effective Performance Measurement: First Build Confidence, then Measure?
Period: February 2008 February 2009
Research commissioned by:
Thales Netherlands
Supervisor from Thales: Ton Disselhorst
1st Supervisor from the University:
Fredo Schotanus
2nd Supervisor from the University:
Management summary
Due to several global trends the pressure on purchasing to improve its performance has increased. The Purchasing Department of the Business unit Surface Radar in the Netherlands (SR Purchasing NL) recognizes its major role in coping with these business challenges and continuously seeks new ways to improve its performance. As a consequence of this and some signals for improvement, SR Purchasing NL identified the need to research the current Performance Measurement System (PMS) to see whether the PMS meets all the requirements in order to be well prepared for the future. The presented report describes this research. The objective is to develop a new PMS with a limited number of Key Performance Indicators (KPIs) to enable easy maintainability. The central question is therefore stated as follows:
What is a good PMS for SR Purchasing NL?
There are several reasons to doubt the performance of the current PMS. We identify that almost half of the KPIs are not providing new insights at all due to several reasons, and in doing so we show that the current PMS only measures the financial performance. We explained that it is dangerous to neglect non-financial measures, because it stimulates purchasers to use short-term strategies rather than investing in long-term strategies. We uncover several other weaknesses of the system, such as the lack of steering possibilities, the lack of confidence of people in the right measures, the lack of commitment of people to the system, and the wrong assumption of focusing on the material flows rather than assessing the overall purchasing performance. Based on these weaknesses, we explain that managers within Thales that are related to SR Purchasing NL do not have the required insights in the current performance of SR Purchasing NL, while the actual performance of SR Purchasing NL is very important for Thales.
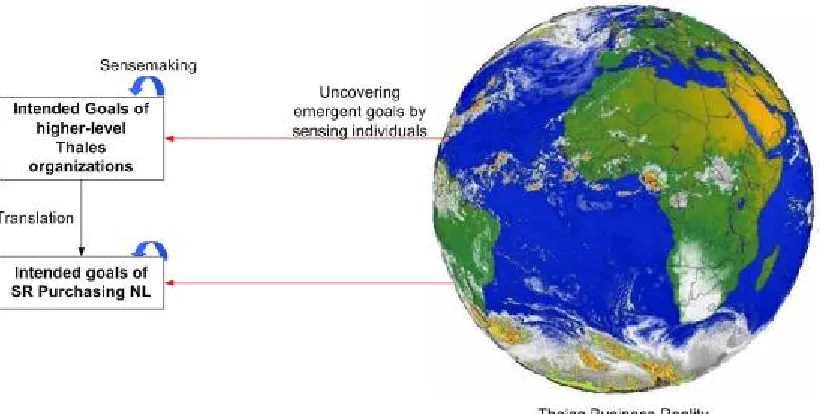
In order to (re)design the right KPIs and to keep them relevant over time, we show that it is essential for SR Purchasing NL to manage the different and changing perceptions of people on the right KPIs. After all, an appropriate KPI today can become not appropriate tomorrow due to new insights. We manage these perceptions by developing a new methodology, namely the so-called MAPP Action Cycle (shown in Figure 1 on Page iii). The actions taken in this cycle are based on the most recent perceptions of people on the Actual Performance Position (APP) of a company. Intended and emergent goals give sense to these perceptions. The organization can learn from emergent goals that are discovered, translated, and
communicated as intended goals. In order to make sense of these different perceptions, a simple performance model is needed. People have to believe that if they accept the performance model as the objective reality, it will add value to the company. After this sensemaking process, new knowledge can be created by developing, measuring, and assessing KPIs. This knowledge can be made more valuable by supporting it with
dashboards, trend-lines, and so on. The decision makers have to understand this valuable knowledge by including it in their mental models. In doing so, they will recreate their perceptions on the APP of a company. Given the scope of this research, we execute the following two steps of this cycle.
First, we evaluate different performance models and develop a customized performance model for SR Purchasing NL, the so-called Purchasing-Balanced Scorecard (P-BSC) (shown in Figure 2 on Page iv). The P-BSC shows the Key Performance Areas (KPAs) for SR
performance model with a higher validity, more adequate steering possibility, higher acceptability potential by people, and an alignment with the mission of SR Purchasing NL. Second, we evaluate all intended and emergent goals for each KPA of the P-BSC in order to formulate basic strategies. From these basic strategies, we develop the most promising alternative KPIs and evaluate them in order to select the new KPIs for SR Purchasing NL. This step results in sixteen new KPIs (see also in Figure 2), five of which are already collected as data by SR Purchasing NL or orther departments and thus make optimal use of existing data.
In order to effectively implement the new PMS, we make some suggestions. First of all, full support is needed from the MT of SR Purchasing NL and the purchasers, after which a project can be started and managed by a project leader. After the other steps of the MAPP Action Cycle have been followed, the implementation can be started and executed in two steps: organizational and technical implementation. Once the PMS is implemented, it must be kept relevant over time with the help of the MAPP Action Cycle. We suggest holding performance reviews four times a year. We estimate that the whole implementation will take five months.
Assessment Measuring KPIs Performance
Model
Support
Absolute Business Reality
Emergent Strategy Intended
Strategy
[image:7.595.170.435.86.531.2]Perceptions on the Actual Performance Position Actions
Preface
This research is the final work for my Masters degree in Industrial Engineering and Management with the specialization Production and Logistic Management at the faculty of Management & Governance of the University of Twente in Enschede, the Netherlands. First of all, I must gratefully acknowledge my Thales supervisor, Ton Disselhorst, for the opportunity he gave me to study one of my most interesting and exciting research topics in a highly professional company, where the speed of learning seemed almost unbelievable. Furthermore, I am very grateful for his guidance and experienced insights as a business professional throughout the research project.
I also thank my supervisors Fredo Schotanus and Marco Schutten from the University of Twente. Their systematic approach for supporting me ensured the final success of this thesis. They gave me direction during my, sometimes over-confident attempts to find the ultimate truth.
The research presented in this thesis would not have been possible without the help, advice, and encouragement of a large group of other people. Although this thesis does not explicitly mention their names, it is partially their work too: thank you very much!
Last but not least, I offer my family sincere thanks for their unconditional and invaluable support.
Tolga Tanaydin
Table of contents
MANAGEMENT SUMMARY...I
PREFACE...V
TABLE OF CONTENTS...VI
LIST OF ABBREVIATIONS AND ACRONYMS...VIII
CHAPTER1: INTRODUCTION... 1
1.1 Research background ... 1
1.2 Research objective... 1
1.3 Central question and research questions... 2
1.4 Research constraint ... 2
1.5 Plan of approach... 2
1.6 Structure of the report... 4
CHAPTER2: CURRENT SITUATION... 5
2.1 Introduction ... 5
2.2 Thales... 5
2.3 Business Unit Surface Radar ... 6
2.4 Thales Purchasing Organization ... 7
2.5 Thales Netherlands ... 7
2.6 Primary process at Thales Hengelo... 7
2.7 Surface Radar Purchasing Netherlands ... 9
2.8 Current PMS... 9
2.9 Conclusion... 13
CHAPTER3: AGOOD DESIGN METHODOLOGY... 14
3.1 Introduction ... 14
3.2 Requirements for a good methodology ... 14
3.3 Most suitable methodology... 15
3.4 Essence of the perceptions about the right KPIs... 15
3.5 Development of good KPIs from different perceptions... 16
3.6 (Re)Creation of the perceptions about the right KPIs ... 17
3.7 MAPP Action Cycle... 19
3.8 Conclusion... 21
CHAPTER4: GOOD PERFORMANCE MODEL... 22
4.1 Introduction ... 22
4.2 Good performance model category... 22
4.3 Development of a good performance model... 24
4.4 Conclusion... 36
CHAPTER5: THE NEWKPIS... 37
5.1 Introduction ... 37
5.2 Desired focus ... 37
5.3 Development of basic strategies... 43
5.4 Derivation of new KPIs... 57
5.5 Conclusion... 71
CHAPTER6: IMPLEMENTATION PLAN... 72
6.1 Introduction ... 72
6.2 Structure of the implementation plan ... 72
6.3 Prerequisites ... 72
6.4 Project start up... 72
6.5 Finishing other components of the MAPP Action Cycle ... 73
6.6 Organizational implementation... 73
6.7 Technical implementation ... 74
6.8 Operation... 74
6.9 Project planning and costs... 75
7.1 Conclusions ... 76 7.2 Recommendations ... 78
REFERENCES... I
APPENDIX... IV
List of abbreviations and acronyms
AT Article Team
APP Actual Performance Position
Ax Alternative Key Performance Indicator x
BSC Balanced Scorecard
BU-SR Business unit Surface Radar C-BSC Classical-Balanced Scorecard
CMMI Capability Maturity Model Integration
EFQM European Foundation for Quality Management
EOQ Economic Order Quantity
FRACAS Failure Reporting Analysis and Corrective Action System
KPA Key Performance Area
KPI Key Performance Indicator
MT Management Team
P-BSC Purchasing - Balanced Scorecard
PI Performance Indicator
PM Performance Measurement
PMS Performance Measurement System
PPM Product Purchasing Manager
Radar System Radar - and sensor System
RQ Research Question
RS Research Step
SR Purchasing NL The Purchasing Department of the Business unit Surface Radar in the Netherlands
TC Total Cost
TCO Total Cost of Ownership
VRS Vendor Rating System
EVRS Extended Vendor Rating System
QLC Model Model with the dimensions Quality, Logistic, and Cost
Chapter 1: Introduction
This chapter starts with a presentation of the research background (Section 1.1) and the research objective (Section 1.2). We derive the central question of this research from the objective and formulate research questions to find an answer to the central question in Section 1.3. Subsequently, we describe the research constraint and the research approach in Sections 1.4 and 1.5, respectively. Finally, we present an overview of the structure of the report in Section 1.6.
1.1 Research background
Increasing dynamics of global markets and the effects of global competition have increased the pressure on companies to improve their performance, because strong competition forces companies to offer more for less. The same holds for Thales, which faces threats from emerging market players and customers that have higher expectations than ever. In the defense market, where this research is based on, the customers are requesting highly integrated systems and turnkey solutions1 with full availability and support over the
20 to 30 year life cycle, while their budgets for defense projects are becoming increasingly smaller (Thales Supplier Portal, 2008a).
As Kraljic (1983) once suggested: Purchasing Must Become Supply Management, the management of purchasing activities is becoming more important. Companies are increasingly outsourcing non-core activities by procuring goods and services rather than producing them internally (Trent & Monczka, 2002). According to Jahns (2005), the value added in the products of many companies has decreased and
purchasing has a larger impact on a companys profit than ever. These developments are also visible within Thales. The value added in systems is decreasing due to the move towards prime contractor ship of
systems. This means that Thales increasingly uses subcontractors to perform parts of its projects. For example, Thales has recently outsourced a large part of the production in the Netherlands. Therefore, SR Purchasing NL, where we will do this research project, has become increasingly important.
SR Purchasing NL has recognized its major role in coping with these business challenges and wants to make real progress in achieving superior performance by continuously seeking new ways to improve its performance. There are several ways to improve performance in general. A recent series of case studies of the British Quality Foundation (Tanner and Davies, 2007), identified the key drivers of performance (see Appendix I) in high performing companies. This study found the use of a PMS to be one of the key drivers of performance, because of its criticality for enabling structural improvements in processes and the
achievement of the companies objectives.
The immediate reason for this research is the confidence of the MT of SR Purchasing NL that an effective PMS can make a serious contribution towards achieving superior performance. They identified the need to research the current PMS to see whether it meets all the requirements in order to be well prepared for the future.
1.2 Research objective
The previous section showed that an effective PMS is essential for SR Purchasing NL. Based on these observations, we formulate the following research objective: This research aims to develop a new PMS for SR
Purchasing NL.
1.3 Central question and research questions
We derive the following central question from the research objective: What is a good PMS for SR Purchasing NL?To find an answer to the central question it is necessary to formulate Research Questions (RQs). The answers to these questions will provide an answer to the central question. The first two RQs are needed to describe the context of this research:
RQ 1. What is the effect of the current PMS for Thales?
1.1. What is the position and function of SR Purchasing NL within Thales?
1.2.What is the function and the actual performance of the current PMS of SR Purchasing NL?
There are several ways to design a PMS and KPIs, which are usually based on a certain performance model. Therefore, we will first find a good design methodology for SR Purchasing NL based on their needs, followed by a good performance model. We will achieve these by answering the next questions:
RQ 2. What is a good methodology for designing KPIs for SR Purchasing NL?
2.1.What are the requirements for a good methodology for designing KPIs for SR Purchasing NL? 2.2. Which methodology for designing KPIs meets these requirements?
RQ 3. What is a good performance model for SR Purchasing NL?
In order to develop new KPIs for the PMS, we have to apply the performance model on SR Purchasing NL. A new KPI could be the same as one of the current KPIs, but this is not necessary. Finally, we have to ensure a possible implementation of the new PMS and KPIs. The following questions will help us to achieve these:
RQ 4. What are the new KPIs for SR Purchasing NL? RQ 5. How can the new PMS effectively be implemented?
1.4 Research constraint
The MT of SR Purchasing NL demanded the use of a limited number of KPIs to enable easy
maintainability. To quantify the number of KPIs, we conducted interviews with members of the team2 and
they indicated that they are satisfied with the use of around ten KPIs.
1.5 Plan of approach
This section describes the approach that we will follow in the excecution of this research. First, we will explore SR Purchasing NL to get insight in its activities. After that, we will answer the RQs by executing the following Research Steps (RSs):
RS 1. Current Situation (RQ 1.1 and 1.2)
organization structure better, we will combine several organization charts of different departments from the intranet to form an overall impression of the organization structure around the SR Purchasing NL.
We will describe the PMS function by interviewing the controllers of the system. Afterwards, we will try to find the performance model behind the current KPIs. While the exact rationale has not been found in a document, we will try to understand the rationale by interviewing purchasers, controllers of the PMS, and members from the MT and researching the rationale of a similar performance model of the ASML Company.
Then we will describe the current KPIs and present the outcomes of these KPIs over the past years with the help of performance reports on the intranet. This will enable us to evaluate the results of the KPIs over the past years. We will also pick up signals for possible improvements of the PMS with the help of interviews and our observations. Furthermore, we will try to identify the possible causes, effects, and solutions of these signals.
RS 2. A Good Design Methodology (RQ 2.1 and 2.2)
To answer RQ 2.1, we have to gain insights in the unique characteristics of SR Purchasing NL that will help us to define requirements for a good design methodology for SR Purchasing NL. We will achieve this by holding interviews and reading internal documents on the intranet, such as on the Thales Portal, Thales Netherlands Portal, and Thales Supplier Portal. Based on the requirements for a good methodology for designing KPIs for SR Purchasing NL, we will find the most suitable methodology by investigating different models.
RS 3. A Good Performance Model (RQ 3)
As mentioned in Section 1.3, we try to find a good performance model for SR Purchasing NL by following a two-step selection process: the selection of the best performance model category and the selection of the best performance model from the preferred category. We will carry out both selection processes in five phases as follows:
Alternatives: The determination and description of feasible alternatives.
Selection-criteria: The determination and description of appropriate selection-criteria.
Evaluation: The evaluation of the existing alternatives, a combination of alternatives, and a new alternative with the help of the selection- criteria.
Selection: The comparison of all the alternatives and the selection of the best alternative with the possible use of weights.
Improvement: The (possible) improvement of the best alternative.
In order to find a good performance category, we will first use a simple categorization from the literature that separates the main types of performance models and assesses their suitability for Performance Measurement (PM) in general. We will do this with the help of generic criteria, which are based on the main idea behind our design methodology about how an effective model should be.
We will critically review the existing and most influential performance models from the literature, a combination of these models, or a new model of the preferred category, with more purchasing-related criteria from the literatue and own observations. Next, we will assess their suitability for PM in purchasing. Finally, we select a good model and make it more explicit and more suitable for the use within SR Purchasing NL in the improvement phase.
RS 4. The new KPIs for SR Purchasing NL (RQ 4)
RS 5. Implementation Plan (RQ 5)
In order to describe how the new KPIs can be effectively implemented, we have to work out first which approach for writing an implementation plan is the most appropriate for SR Purchasing NL. We will achieve this by using the literature and interviewing a Thales employee that is familiar with implementations within SR Purchasing NL.
1.6 Structure of the report
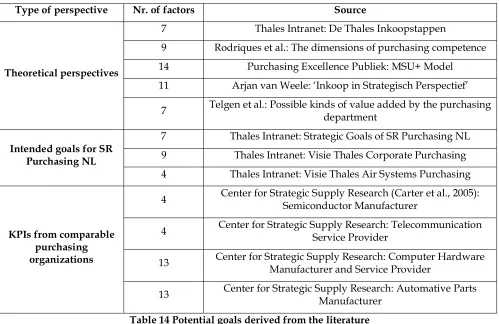
[image:16.595.53.545.272.418.2]Figure 3 graphically summarizes the structure of the report. The chapter numbers have been reflected with C# and the research steps with RS#. We will elaborate each RS per chapter, followed by the conclusions and recommendations in the last two chapters. Appendix II shows the list of interviewed persons in this research.
Chapter 2: Current situation
2.1 Introduction
The purpose of this chapter is to describe the effect of the current PMS for Thales. We will achieve this by giving an overview of the position and function of SR Purchasing NL within Thales and by describing the function and the actual performance of the current PMS of SR Purchasing NL. We describe the Thales organization in Section 2.2. As the name suggests, SR Purchasing NL, belongs to three parts of Thales. Therefore we also describe the BU-SR(Section 2.3), the Thales Purchasing Organization (Section 2.4), and ThalesNL (Section 2.5). Given that SR Purchasing NL is a purchasing department, which is responsible for the purchasing of parts for the primary process at Thales Hengelo, we also have to pay attention to this primary process (Section 2.6). Finally, we focus on SR Purchasing NL itself and its current PMS in Sections 2.7 and 2.8, respectively.
2.2 Thales
Thales is an international electronics company and primarily active in business areas (often also named as core businesses or just markets) dedicated to information systems. Each business area consists of
business lines. A business line (or division) is a set of business units that is responsible for a given market segment. Table 1 shows the business areas, lines, and the core products or services of Thales.
Thales
Business Area Aerospace Defense Security
Business Line Aerospace Air Systems Land & Joint Systems Naval Solutions & Security Services Impression Core products or services Equipment for aircrafts Airborne surveillance & mission systems
Air defense and missile systems
[image:17.595.46.550.380.610.2]Civil air traffic management systems Network centric systems Network-enabled equipments Warship prime contracting Systems for surface ships Underwater systems and naval services IT services Simulation-based training
Table 1 Business areas, lines, and the core products or services of Thales.
According to the Annual Report 2006, the main competitive advantages of Thales are an outstanding portfolio of innovative products and technologies, solid experience in the defense sector, and a positioning as a global player in security markets. The annual report further shows that Thales realized a net profit of 388 million and annual revenues of more than 10 billion with a total workforce of almost 57.000
2.3 Business Unit Surface Radar
The business unit Surface Radar (BU-SR) is part of the business line Air systems. This business unit generated, according to the annual report, 1.6 billion of the 10 billion revenues of Thales with a workforce of about 5900 employees. Table 2 shows the business units that are part of the business line Air systems.
Air Systems
Impres-sion Business
Unit OperationsAir Surface Radar WeaponSystems ElectronicsMissile CustomerServices Air Traffic Manage-ment Systems
Navigation Aids
Table 2 Business units of the business line Air System.
The BU-SR is a supplier of Radar Systems in three fields. Table 3 shows the division of the BU-SR and their locations. Note that in Thales Hengelo, the BU-SR only focuses on naval radars and sensors that can be used on board of a naval ship.
Surface Radar Impression
Division Ground
Radar NavalRadar Air Traffic ManagementRadar
Location Limours
(France)
Hengelo & Delft (The Netherlands)
Rouen (France)
Table 3 Divisions of the BU-SR
Radar Systems are delivered to system integrators or directly to end-users. System integrators are external companies or internal business units of the Thales Group that are capable of integrating these Radar Systems with other systems into a Combat Management System or an Air Traffic Management System. End-users are shipyards, navies or other government customers. The system integrators within the Thales Group (internal system integrators) are shown in Table 4.
Internal System Integrators
Business Line Naval Air Systems Land & Joint Systems
Business Unit(s) Above Water Systems Weapon Systems, Air Operations, and Air Traffic Management
Systems
Ground surveillance
2.4 Thales Purchasing Organization
The Thales Purchasing Organizations challenge is to optimize the purchasing function of Thales. It has the ambition to support every purchasing department within Thales to become, as they say, the preferred customer of its suppliers by developing strategies from different control levels, namely at corporate-, business line-, country-, and purchasing segment levels. According to Thales Supplier Portal (2008a), the intranet pages of the Thales Purchasing Organization, the 2006 global purchasing volume of Thales
(excluding intra-group trading) was 4 billion, which represents more than 50% of the Thales added value.
2.5 Thales Netherlands
Thales Netherlands, formerly Hollandse Signaalapparaten BV, belongs to Thales and generated 480 million revenues in 2006 with a total workforce of 2020 employees. It is the largest defense company in the Netherlands. The main competitive advantages are its presence all along the value chain, its dual-use of technology for military and civil markets, and its multi domestic presence. In the defense market it operates mainly in the naval sector (or market segment). Outside the defense sector, Thales develops several
services in the Netherlands, such as a nationwide public transport ticketing system.
Thales Netherlands consists of five establishments with its head office in Hengelo. Given that we carry out this research in Hengelo, we show the business lines and units of Thales Hengelo and their core products and services in Table 5.
Business Area Defense
Business Line Air Systems Naval -
Business Unit Surface Radar
Netherlands Above Water Systems Netherlands
Industrial and
Logistic Services Operations
Core products or services
Supplier of radar and sensors to system integrators
and end-users in naval field
Supplier and integrator of Naval
Combat Systems3
Subcontracting
Customer-, Logistic-, and Industrial Services
Supports the primary processes
within Thales Netherlands
Table 5 Thales Hengelo and its business lines, units, and its core products or services.
2.6 Primary process at Thales Hengelo
In this section we will describe the primary process and its management at Thales Hengelo, as reflected in Figure 4. The functional names of the departments are used here to clarify the departmental roles in the primary process. For the same reason we grouped departments which are closely related. Different
business units work heavily together in this primary process. Moreover, the departmental activities are not always sequentially carried out from the left to the right as reflected in this figure, and some activities could be skipped in practice.
Figure 4 (Management of the) Primary process at Thales Hengelo.
The primary process starts at the Marketing and Sales department, which is responsible for the capturing of customer orders and winning of bids by planning the right system characteristics that will provide the required operational capability of the customer against competitive conditions. It is also responsible for launching new systems without a customer order to meet anticipated demands of potential customers. After determining the system characteristics, the engineering department is responsible for converting these characteristics into a system design.
When the design is finished, the parts for manufacturing and assemblage can be purchased. These parts are called buy parts, because they are bought from suppliers. There are also make parts, which are produced from buy parts in one of the production lines. There are currently two groups of production lines, namely EPM and MPM. EPM stands for Electronic Parts Manufacturing and MPM stands for Mechanical Parts Manufacturing, the latter which will be outsourced to another company during this research. Therefore, this research will focus on the future status of Thales Hengelo, where it purchases mechanical make parts from an external (strategic) supplier. The production lines always produce on a unit production basis, because all the customer orders are customer specific. After the system is assembled, a system test is
performed. Note that parts (in contradiction with a system) are only tested, when there is a serious need for it with the aim to push this quality control more to the suppliers. Finally, the system is temporarily stored in a warehouse to be distributed to its customer.
2.7 Surface Radar Purchasing Netherlands
According to Ton Disselhorst, the Thales supervisor of this research and Purchasing Manager of Tactical Purchasers, SR Purchasing NL has an estimated purchasing turnover of around 100 million annually after the outsourcing of MPM. It is responsible for the purchasing of end-product parts (or modules and
subsystems) that are needed for the realization of Radar Systems.
The purchasing function within the Project- and Program Teams are managed by Product Purchasing Managers. The word product refers, in our terms, to a system. Every PPM is in close contact with Article Teams (ATs) that are responsible for the purchasing of groups of articles. According to the Thales
Netherlands Portal (2008a), there are currently about 28 article groups. A few examples are: RF-Electronics, Mechanics, and Electro-Optical Systems. An AT consists of one tactical purchaser, one operational
purchaser, and one specialist. The main responsibility of a specialist is the technical specification of the corresponding article. Figure 5 reflects the main tasks of tactical- and operational purchasers of SR Purchasing NL.
Operational purchasing Tactical purchasing
Analyses of needs
Specification of needs
Selection of
supplier Contracting Ordering
Monitoring supplier performance
Support after delivery
Figure 5 Main tasks of purchasers
These tasks are well-structured and are performed successively. This process always starts with a need that has to be fulfilled. We will give a brief explanation of these tasks:
Analyses of needs: Determining the purchasing needs Specification of needs: Specifying the purchasing needs Selection of supplier: Searching and selecting suppliers
Contracting: Negotiating the most attractive contracts with suppliers Ordering: Ordering against agreed conditions
Monitoring supplier performance: Checking orders and monitoring contracts Support after delivery: Evaluating the completion of this process and its end-result
Finally, in order to obtain a good picture of the complete organization structure of Thales and its relation with SR Purchasing NL, we combined several organization charts from different departments. Appendix III shows the result.
2.8 Current PMS
The current PMS of SR Purchasing NL is called the Management Control System Purchasing and is presented in the form of a management dashboard every quarter. According to the controllers4, the
purpose of the system is to provide different managers from Thales Hengelo with insight in the current performance of SR Purchasing NL in a univocal manner. Figure 6 displays the current management dashboard. The colors reflect the actual performance of the parts of the PMS.
Figure 6 Management Control System of SR Purchasing NL
The overall performance of purchasing is measured in three dimensions, namely Logistic, Financial, and Quality. However, we do not know the exact rationale of this performance model, because the designer of the system has left the company for years and we did not find this rationale documented.
This performance model is very similar to the well-known Value Sourcing Concept of ASML (2007) and used by several other companies. The rationale of Value Sourcing is as follows:
Delivering the right parts (Quality dimension), at the right time (Logistic dimension), and at the lowest cost (Cost
dimension) with the required technology (Technology dimension) to ASML.
We refer to this model as the QLCT model. In line with this interpretation, we formulate the following possible rationale for the performance model of SR Purchasing NL:
Delivering the right parts (quality dimension), at the right time (logistic dimension), and at the lowest cost (cost
dimension) to the internal customers.
We call this model the QLC Model. We confirmed this rationale by talking with purchasers, the controllers of the system, and members of the Management Team. The difference is that ASML uses an additional Technology dimension and measures the performance of the suppliers instead of the purchasing performance.
These differences are unfavorable for two reasons. First, Technology has a great impact on the performance of SR Purchasing NL, such as the miniaturization of parts. Therefore it must be incorporated. Second, both models focus on the material flows. These flows can be seen as the output of the suppliers or the
purchasing department. We find the focus for assessing the performance of purchasing disputable, because we find it important to focus also on, for example, processes that support these material flows (e.g. supplier management and supplier relations management). In assessing supplier performance, we find it more appropriate to hold suppliers responsible for their own output. Both models also have a common
Figure 6 shows further that the dashboard is capable of showing the actual performance of a KPI for the current quarter (larger part) and the previous quarter (smaller part). It shows also that the PMS consists of four KPIs per dimension. According to Ben Geertsema, a member of the MT of SR Purchasing NL, this fixed amount of KPIs per dimension is not a conscious choice. Figure 6 does not show the original KPIs and for ease of understanding we display them in Table 6. Extra Performance Indicators (PIs) are added each year from new purchasing objectives of a certain year. For example, the MT has introduced a new PI for assessing the purchasing spent in dollars for the year 2008 based on the current weak dollar. PIs can not be displayed by this dashboard. Note the difference between a KPI and a PI: a KPI is a fixed number of
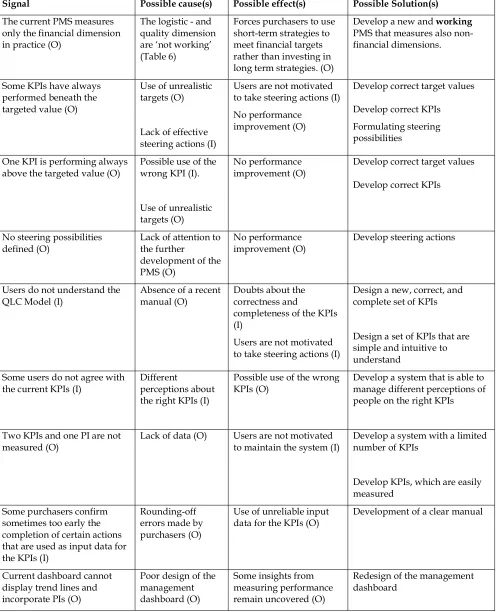
distinct indicators that together are able to indicate the overall purchasing performance, while a PI could be an isolated measure. Table 6 displays the current KPIs and PI. With the help of all the available reports on the intranet (Performance Reports, Q3/2004 Q1/2008), we investigated the results of the KPIs over time and added some important shortcomings in Table 6.
(Key) Performance Indicators Important Shortcomings
Logistic dimension Performed always beneath the norm
Ability to meet operations schedule Is not measured anymore & Performed always beneath the norm
Supplier delivery reliability Is not measured anymore
Supplier cycle times Performed always above the norm
Needed time for placing purchase order
Financial dimension
Program cost reduction against budgeted price Program budgeted price
Integral cost reduction of purchasing department Program cost reduction in negotiations
Quality dimension Performed always beneath the norm
Quality of purchase file
Supplier performance Performed always beneath the norm
Supplier reduction
Spend with preferred suppliers Performed always beneath the norm
Extra PI: Spend in dollars Is not measured yet
Table 6 Current KPIs and their shortcomings
Signal Possible cause(s) Possible effect(s) Possible Solution(s)
The current PMS measures only the financial dimension in practice (O)
The logistic - and quality dimension
are not working
(Table 6)
Forces purchasers to use short-term strategies to meet financial targets rather than investing in long term strategies. (O)
Develop a new and working
PMS that measures also non-financial dimensions.
Some KPIs have always performed beneath the targeted value (O)
Use of unrealistic targets (O)
Lack of effective steering actions (I)
Users are not motivated to take steering actions (I) No performance
improvement (O)
Develop correct target values
Develop correct KPIs Formulating steering possibilities
One KPI is performing always above the targeted value (O)
Possible use of the wrong KPI (I).
Use of unrealistic targets (O)
No performance improvement (O)
Develop correct target values
Develop correct KPIs
No steering possibilities
defined (O) Lack of attention to the further
development of the PMS (O)
No performance
improvement (O) Develop steering actions
Users do not understand the QLC Model (I)
Absence of a recent manual (O)
Doubts about the correctness and
completeness of the KPIs (I)
Users are not motivated to take steering actions (I)
Design a new, correct, and complete set of KPIs
Design a set of KPIs that are simple and intuitive to understand
Some users do not agree with the current KPIs (I)
Different
perceptions about the right KPIs (I)
Possible use of the wrong KPIs (O)
Develop a system that is able to manage different perceptions of people on the right KPIs
Two KPIs and one PI are not measured (O)
Lack of data (O) Users are not motivated
to maintain the system (I)
Develop a system with a limited number of KPIs
Develop KPIs, which are easily measured
Some purchasers confirm sometimes too early the completion of certain actions that are used as input data for the KPIs (I)
Rounding-off errors made by purchasers (O)
Use of unreliable input data for the KPIs (O)
Development of a clear manual
Current dashboard cannot display trend lines and incorporate PIs (O)
Poor design of the management dashboard (O)
Some insights from measuring performance remain uncovered (O)
[image:24.595.50.546.106.718.2]Redesign of the management dashboard
Based on this table, we conclude that the following parts of the current PMS need extra attention: the KPIs, the performance model, the target values, the management dashboard and the steering actions.
2.9 Conclusion
In this chapter we described the effect of the current PMS for Thales. First, we showed that SR Purchasing NL is heavily involved with different business functions from different business units of Thales for the delivery of Radar Systems and are supported by the Thales Purchasing Organization. Second, we described the function and the actual performance of the current PMS of SR Purchasing NL. The current PMS of SR Purchasing NL should measure the overall performance of SR Purchasing NL and provide different managers within Thales with new insights so that corrective actions can be taken. However, we showed that there are enough reasons to doubt the performance of the current PMS:
The current performance model only measures the financial performance in practice
The current performance model, the QLC model, focuses only on the material flow from suppliers to the internal customers and has the following disadvantages:
o The model does not consider the technological expectations of internal customers
o The model does not consider the other purposes of purchasing apart from controlling the
material flow
o The model does not consider the support processes that are needed for controlling the
material flow
The users do not understand the QLC model and do not agree with the current KPIs
o There are no steering possibilities defined
o The users of the PMS are not motivated to use the PMS
o The management dashboard cannot incorporate trend lines and PIs
Chapter 3: A good design methodology
3.1 Introduction
This chapter describes the process of finding a good methodology for desiging KPIs for SR Purchasing NL. We provide the requirements that the new methodology must meet in Section 3.2. Based on these
requirements, we present new questions that have to be answered in order to create the most suitable methodology in Section 3.3. We answer these questions in the Section 3.4, 3.5, and 3.6. Finally, we present the most suitable methodology in Section 3.7.
3.2 Requirements for a good methodology
In order to gain insights in the characteristics of SR Purchasing NL, we first investigated many internal documents on the intranet, such as on the Thales Portal, Thales Netherlands Portal, and Thales Supplier Portal. We then interviewed several purchasers and determined that the SR Purchasing NL has the following unique characteristics:
Faces complex problems, such as:
o The relationship between a purchaser and a supplier is not an easy task. Each company
wants to maximize their profits and in order for a successful partnership to be established, a balance must be found. This balance is also needed, because the success of one partner can help the success of the other. The management of these relationships can therefore be seen as a complex problem.
o SR Purchasing NL has to deal with the needs and expectations of different business
functions from different BUs. For example, Marketing and Sales wishes that SR Purchasing NL selects suppliers in promising countries in order to stimulate new orders or meet future offset obligations from those countries.
Faces a fast changing environment, such as:
o SR Purchasing NL sources globally, which means that exchange rates can influence the
selection of suppliers by selecting suppliers in a cheap-currency country.
o The rate of technological change and number of new technologies is increasing all the time,
such as the miniaturization of parts. These parts could lead to the innovation of Radar Systems from the suppliers of SR Purchasing NL.
Companies that face complex issues in a fast changing environment, have to incorporate new gained insights in investigating their best practices and the changes in their environment to remain efficient and effective. New insights are also gained in PM research. For example, PM research has mostly focused on single companies in the past years. However, in the last few years, new models emerge that incorporate the optimization of supply chains (see for example Gunasekaran et al., 2004) or focus on a specific department within a company, such as for purchasing (see for example Wagner & Kaufmann, 2004).
Figure 7 Required design methodology for SR Purchasing NL
3.3 Most suitable methodology
Based on the requirement of Section 3.2, we try to find the most suitable methodology now. Such a design methodology was not found in literature and we are required to develop a new one, based on the
literature. In order to manage different and changing perceptions of people about the right KPIs, the additional questions shown below have to be answered, after which the findings will be combined and result in the presentation of a new methodology in Section 3.7:
What is the essence of the perceptions (Section 3.4)?
We have to know exactly what these perceptions are really about in order to focus on the essence of these perceptions.
How can we develop good KPIs from these perceptions (Section 3.5)?
Given that there are different perceptions, we have to understand how we can cope with them and develop good KPIs.
How are these perceptions (re)created (Section 3.6)?
We have to understand how these perceptions are (re)created. This will enable us to become aware of the factors that influence these perceptions of people.
3.4 Essence of the perceptions about the right KPIs
In order to uncover the essence of perceptions of people about the right KPIs, we first investigate two definitions in the literature for the term PM:
The acquisition and analysis of information about the actual attainment of company objectives and plans and about factors that may influence that attainment (Kerssens-van Drongelen & Bilderbeek, 1994).
The process of determining how successful organizations or individuals have been in attaining their objectives (Sinclair & Zairi, 1995).
These definitions make clear that PM is about measuring performance and determining in which direction a company wants to improve. This is the same as understanding the Actual Performance Position (APP) of a company. Note that PM is just one way to understand the APP and other ways also exist, such as educating people. Based on this, we formulate and use the following interpretation for a PMS:
We find that a company should take actions in the right direction, based on its most recent understanding of its APP. These actions are taken on physical activities, which we name as the absolute business reality of a company. This is the link of PM with Performance Management as depicted in these definitions from the literature:
The process by which a company manages its performance. It should be in line with its corporate and functional strategies and objectives (Bititci et al., 1997).
PM as the process of quantifying the efficiency and effectiveness of action (Neely et al., 1995). In line with our interpretation of PM, our interpretation for Performance Management becomes:
A mechanism for better decision-making on the basis of the most recent understanding of the APP of a company to
take actions on the absolute business reality of the company.
The essence of the perceptions about the right KPIs is thus the understanding of the APP of a company.
3.5 Development of good KPIs from different perceptions
The APP of a company can be seen as a very complex reality, because there is not a one best perception. In order to deal with these different perceptions, we simplify the APP of a company into a reality. By
answering the following questions, we should be able to answer the main question of this section, namely: How to develop good KPIs from different perceptions?:
What is a reality?
According to Dummett (1978), there are two main opposite ways of thinking about reality: Realism and Antirealism. Realists claim that there is an objective world in contrast with the Antirealists view that an objective world does not exist independently of the human mind and thus claiming the existence of only a subjective world. Given that it is not proven, both groups agree that reality changes all the time, due to experience or just due to time.
How is reality observed?
Humans also have a limited view of reality, because they have a limited set of senses and cannot observe things that cannot be seen, smelled, touched, heard or tasted. Some technologies help to sense more indirectly, but this is only recently and limited. An example is a radar system that allows to see the whole electromagnetic spectrum. There are many other known non-human senses and perhaps other unknowable things in the world by which people are most likely observing just a very small part of all that exists.
How is reality understood?
Perceptions could be shared in groups and therefore we are not living in different worlds. For example, in companies (as a social unit) and in businesses (as a group companies) there are shared perceptions.
How is a complex reality managed?
To deal with these different perceptions in a complex reality, a sensemaking process could be very helpful. According to Weick (1995), sensemaking is an attempt to make sense of a complex (or ambiguous and uncertain) reality in order to make decisions. It is a collaborative process of creating shared awareness and understanding out of different individuals perspectives and varied interests. This often holds for managerial situations, because they operate in complex situations, where nearly solid facts exist. In a simple reality, analysis and evaluations are made based on reality itself to take decisions. In groups (or in companies), reality is always socially constructed and accepted as the objective world if they believe that it will lead to better decisions although they do not share
completely the same perceptions. Figure 8 and Figure 9 show the decision making for a simple and complex reality, respectively.
Simple Reality =
Reality with facts Analysis and evaluations Decision
Figure 8 Decision making for a simple reality
Complex Reality = Reality
with perceptions Sensemaking Constructed reality Analysis and evaluations Decision
Figure 9 Decision making for a complex reality
A model is a way of (not) seeing things and can thus be used to (re)construct reality that is simple to understand. When it is also made explicit, conceptual, written and unambiguous, it becomes an excellent way of constructing a reality that can be easily communicated.
We are now able to answer the main question of this section. We can deal with different perceptions on the APP of a company by creating a simple performance model, in which all people believe that if they accept it as the objective reality, it will add value to the company.
3.6 (Re)Creation of the perceptions about the right KPIs
In this section, we will show the perceptions on the APP are (re)created. Within PM, we find that there are two main flows of knowledge that (re)create these perceptions:
The goals of a company
perform unsatisfactory tomorrow. According to Mintzberg (1994), a company moves with the help of two types of goals: intended and emergent goals.
An intended strategy is planned, formulated, and based on deliberate rational choices and contains an intentional pattern of actions. It is based on a strategic fit between a companys goals and values, resources, capabilities, structure and systems, and aspirations in a particular industry environment (customers, suppliers, and competitors). In other words, it is based on the fit between reality and vision. Intended strategy is often also called Deliberate Strategy, Strategy as Design, and Formal Strategic Planning by others. Many goals are formalized in companies, such as in the vision, mission, strategies, business plans, and core values of a company. The definitions of these terms can vary, overlap, and not be clear in practice.
An emergent strategy is a pattern of actions that turns into a consistent pattern of behavior,
absolute business reality of a company. It arises from practical experience and day-to-day incidents and implies that a company is learning what works in practice. Emergent strategy is also known as strategy as process and strategy as stretch, because it allows stretch between reality and vision. Note that an emergent strategy can become an intended strategy when it is discovered by the management and translated and communicated as an intended strategy. We will call this
organizational learning. This knowledge gives sense. We will therefore denote the effect of these goals on the perceptions of people as sense-giving. It gives sense with little or no effort from the receiver.
Measuring Performance
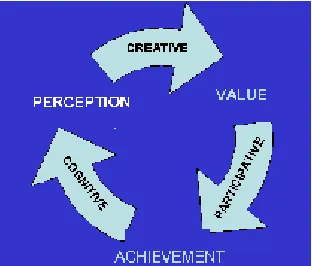
By measuring, a company is capable of objectively determining the actual performance of a factor. This results in new knowledge and recreates the perceptions of people on the APP of a company. This knowledge uncovers weak performing factors. Companies usually take actions on weak performing and strategic factors. This knowledge is more complicated than the effect of the goals of a company on the APP. It has to be created by measuring. Therefore we searched for applicable models from the literature and found one model of Oral (2007). This model consists of three
functions. We describe these three functions in more detail below and depict the model in Figure 10:
o the cognitive function constructs a business reality for the purpose of identifying managerial
issues that need to be dealt with
o the creative function builds a critical analysis and decisional system leading to a creative
generation of innovative ideas and knowledge related to the identified managerial issues
o the participative function develops channels of communication and delivery systems in
[image:30.595.229.385.583.716.2]order to have business offerings valued, favored and accepted by the intended actors of the business environment of interest
We apply this model to performance measurement. The cognitive function constructs a
performance model for the purpose of identifying the APP of a company. The creative function creates new knowledge by developing and measuring KPIs and assessing their values with certain target values. The participative function turns new knowledge into more valuable knowledge with the help of reports, discussion, dashboards, trend lines, and so on. It can help uncover
opportunities, recognize trends, identify data anomalies, and create widely accessible reports, and so on. In this research we will call this the support function
3.7 MAPP Action Cycle
Figure 11 on Page - 20 - shows the good design methodology for SR Purchasing NL, which is based on the findings of the previous sections of this chapter. We will call this methodology the MAPP Action Cycle, in which MAPP stands for Measuring Actual Performance Position. It is called an action cycle, because performance measurement is useless if it does not lead to actions. The actions taken in this cycle are always based on the most recent perceptions of people on the APP of a company. Intended and emergent goals give sense to these perceptions. The organization can learn from emergent goals that are discovered, translated, and communicated as intended goals. In order to make sense of these different perceptions, a simple performance model is needed. People have to believe that if they accept the performance model as the objective reality, it will add value to the company. After this sensemaking process, new knowledge can be created by developing, measuring, and assessing KPIs. This knowledge can be made more valuable by supporting it with dashboards, trend-lines and so on. Next, the decision makers have to understand this valuable knowledge by including it in their mental models. In doing so, they will recreate their perceptions on the APP of a company. As previously mentioned, all sources of knowledge are used in practice to recreate these perceptions and not only performance measurement. We can summarize the main idea behind this methodology as follows:
First Build Confidence (Build confidence in a good performance model and KPIs) Then Measure (Create new knowledge)
Following Support (Create more valuable knowledge)
Figure 11 MAPP Action Cycle
Many factors can be investigated in the MAPP Action Cycle. Based on the Research Objective (Section 1.2) we will focus only on the first part of the methodology, namely the First Build Confidence part of the methodology, since this part will result in the required new KPIs for SR Purchasing NL. Based on the MAPP Action Cycle, we will carry out the research as follows:
Build confidence in a good performance model (Chapter 4)
As expected in the design phase (see Chapter 1.3), we need to find a performance model for SR Purchasing NL. According to the MAPP Action Cycle, we have to build confidence in a simple performance model. Therefore, we will use simplicity as a creation in the evaluation of different models.
Build confidence in good KPIs (Chapter 5)
We will develop new KPIs from the good performance model for SR Purchasing NL with the help of the following sections:
projecting the intended and emergent goals of SR Purchasing NL into the performance model. In doing so, we will gain insights in the perceptions of the management of SR Purchasing NL and other people about the most important KPAs of the performance model.
o Development of basic strategies (Section 5.3)
We will evaluate all possible intended and emergent goals with the help of relevant literature and the main ideas behind the current KPIs to formulate basic strategies that capture the main idea behind the KPAs of the performance model. Basic strategies are needed, because we are allowed to use a limited set of KPIs (see Section 1.4).
o Development of new KPIs (Section 5.4)
We will derive the KPIs from the strategies formulated in Section 5.3. We will achieve this with the help of relevant literature and key persons that are related to the concerning KPA. We will ask them to formulate alternatives in a brain storm session in order to generate the most promising alternative KPIs and we will evaluate these alternatives. The brainstorm sessions are a good method, because it stimulates creativity and thus the generation of multiple promising alternatives.
3.8 Conclusion
In this chapter we have developed a methodology for designing KPIs for SR Purchasing NL. First, we determined that SR Purchasing NL needs a methodology that is able to manage different and changing perceptions of people about the right KPIs. Second, we showed that such a methodology does not exist in literature and thus we developed the MAPP Action Cycle. The purpose of this cycle is to take actions according to the latest perceptions of people about the APP of a company. The MAPP Action provides more insights in the way to carry out the next RSs. It seems necessary to develop a simple performance model and develop new KPIs based on this model by developing:
Basic strategies from the intended and emergent goals of SR Purchasing NL for each KPA of the performance model
Chapter 4: Good performance model
4.1 Introduction
In this chapter, we will find a good performance model for SR Purchasing NL in two steps. First, we evaluate the different categories of performance models with generic criteria and assessed for their suitability in measuring performance in general (Section 4.2). This enables us to focus on the most promising models in more detail in the next step (Section 4.3), where we evaluate the most influential performance models with purchasing-specific criteria and assessed for their suitability for PM in purchasing. Finally, we select a good model and improve it to fit SR Purchasing NL.
4.2 Good performance model category
4.2.1 Alternatives
According to Bourne and Neely (2003), a categorization can be made based upon the distinct procedures that can be discerned in the design process, namely the audit led, model led, and needs led procedures:
The audit led procedure is a bottom up procedure that starts with evaluating the existing performance measures to improve these measures. Examples are the procedures of Dixon et al. (1991), and Ghalayini et al. (1997).
The model led procedure uses a prescribed theoretical model of the organization for designing the performance measures. This means that such models do not change over time (are fixed). A few examples are the MSU+ model (2005), and the procedures of Bitton (1990), and Krause and Mertins (1999).
The needs led procedure is a top down procedure that uses the needs of all stakeholders as a basis for the development of performance measures. For example, the excellence model of the European Foundation for Quality Management (EFQM Model, 1992) and the BSC are such procedures. A combined model will also be used as an alternative. The only feasible combined model is the model led procedure incorporated in a needs led procedure, because the model led procedure results in a fixed model that can be incorporated in a changing model that is the result of a needs led procedure. An audit led procedure cannot be combined with the other models, because it focuses only on the existing KPIs. The needs led procedure cannot be incorporated in other models, because the other models are fixed and can not consider the changing needs of stakeholders. A new procedure cannot be developed, because these three procedures and the combined procedures include all possible procedures and combinations.
4.2.2 Selection-criteria
A model is a way of (not) showing things, as mentioned earlier in Chapter 3, and this provides the basis for the next two generic criteria: the correctness and completeness of a model. Based on the findings of Chapter 3, a good performance model for SR Purchasing NL should be simple and thus the simplicity of a model is also used as a criterion.
4.2.3 Evaluation
Sign Score
-- Very Low
- Low
+/- Reasonable
+ High
++ Very High
Table 8 Signs and the corresponding scores for evaluating alternatives
Cate-gory
SC Evaluation Score
Simple A model is equal to the set of KPIs +
Correct The existing KPIs are improved. +
Complete If a model seems incomplete, the model cannot be extended. - Simple The use of a prescribed model to represent the overall performance of
purchasing seems very complex, because (among others) all the purchasing processes have to be modeled.
-Correct The KPIs are based on prescribed models that are usually based on planned, formulated, and deliberate rational choices.
However, new insights cannot be incorporated, because the KPIs are prescribed.
+/-Complete It seems almost impossible to model every factor that has an impact on the
purchasing performance.
-Simple The models are top down approaches. Therefore it is likely to develop a quite
simple model on for example one A4 paper.
+/-Correct This approach can deliver correct KPIs for some cases, but not for complex
issues, where a bottom-up approach is more desired.
+/-Complete It focuses on the right things to consider the real needs and expectations of
stakeholders. +
Simple The model becomes seems a bit more complex than the needs-led model, because prescribed models are used for complex issues. However, the prescribed models are lying behind the needs-led model and can be left out in the daily use.
+/-Correct The model will have a higher correctness with respect to the needs led
approach, because models are incorporated for complex issues. + Complete The completeness remains unchanged with respect to the needs led
approach. +
4.2.4 Selection
Table 10 summarizes the scores for all categories on each criterion. We will use the same weights for the criteria, because they all are perceived equally important. This is also confirmed by the Thales supervisor of this research. The audit led procedure and the models led procedure are no options, because they score very low on completeness. From the remaining models, the combined model is the best alternative. Therefore, we selected it as the best alternative.
Audit led Model led Needs led Combined model
Simplicity + - +/-
+/-Correctness + +/- +/- +
Completeness - - + +
Table 10 Comparison of alternatives for a good performance model category
4.3 Development of a good performance model
4.3.1 Alternatives
We will now analyze needs led performance models from the selected category, a model led procedure incorporated in a needs led procedure, of Section 4.2. Lardenoije et al. (2005) reviewed influential needs led models that have the potential to be used in purchasing with purchasing related criteria. He described the following models: EFQM Excellence Model, Productivity Measurement and Enhancement System
(Pritchard, 1990), Balanced Scorecard (Kaplan & Norton, 1992), Performance Prism (Neely & Adams, 2000), Tableau de Bord (Fitzgerald et al., 1991), and Performance Pyramid (Lynch & Cross, 1991). We dropped the following two of the above models as alternatives:
Tableau de Bord
This model is a nested structure of setting indicators for the top management level and translates these indicators to lower levels, such as divisions, functions, and regions. As such, it results in one Tableau de Bord for each unit. Given that the scope of the research is to design a PMS for only SR Purchasing NL, we will drop this model as an alternative.
Productivity Measurement and Enhancement System
This is a step-by-step formal process of identifying objectives, measuring the attainment of these objectives, and communicating the actual performance to people. Since this is a formal process and not a (conceptual) performance model as we have met in Section 3.5, it will also be dropped for evaluation.
The other models are interesting performance models. A combination of the models is not possible, because the models are fundamentally different. New models will not be developed, because the existing models have been reviewed many times and are used by many companies. We will (briefly) describe the
alternatives:
EFQM Excellence Model
Figure 12 EFQM model
Balanced Scorecard
A well-known PMS is the BSC developed by Kaplan and Norton (1992). The BSC provides a view of an organizations overall performance with the help of questions derived from four perspectives:
o Financial Perspective: To succeed financially, how should we appear to our shareholders? o Customer Perspective: To achieve our vision, how should we appear to our customers? o Internal Processes: To satisfy our shareholders and customers, what business processes
must we excel at?
o Learning and Growth: To achieve our vision, how will we sustain our ability to change and
improve?
These perspectives are also ordered. The BSC translates the mission of a company to measures in these different dimensions. This is depicted in Figure 13.
The Performance Prism
This model is a three-dimensional model that has five facets (see Figure 14) (or dimensions) that answer particular questions:
o Stakeholder Satisfaction: Who are the most influential stakeholders and what do they
need?
o Strategies: What strategies should we adopt to satisfy the needs of these stakeholders? o Processes: Which processes are needed to execute these strategies?
o Capabilities: What capabilities are needed to operate these processes?
o Stakeholder contribution: What contributions are required from the stakeholders, if we are
to develop these capabilities?
Figure 14 Performance Prism
The Performance Pyramid
Figure 15 Performance Pyramid
4.3.2 Selection-criteria
This section evaluates the suitability of the models for PM in purchasing with the use of more purchasing-related criteria. Lardenoije (2005) used purchasing-purchasing-related criteria in his analyses to compare performance models, which are reviewed below:
Coverage of both strategic and operational aspects of purchasing
We agree with this criterion, because we are interested in the overall purchasing performance, which includes the full coverage of possible aspects.
Possibility to include performance towards all three principal stakeholders in purchasing: internal customers, suppliers, and top management
We partly agree with this criterion. We understand the necessity of multiple stakeholders, because in purchasing more stakeholders exist than (internal) customers. However, we do not agree with the three stakeholders. SR Purchasing NL has to deal with other business functions at Thales NL as well. Therefore we will relax this criterion for the time being into: Possibility to include
performance towards multiple stakeholders and determine the exact stakeholders later. Inclusion of lead and lag indicators for purchasing
The lead and lag indicators will make the performance model considerably more valuable, because it will show interrelations between KPAs. As this enables a better understanding of the model, we use this criterion and for ease of understanding name it: the inclusion of cause and effect relationships.
Usefulness for individual-level PM
Mastenbroek & Wijchers (2007) argued that the purpose of the use of indicators should be overall performance improvement and not controlling people, which is also the purpose of this research (see Section 1.1.). Talks with purchasers confirm that such a criterion is not preferred in a
department where the expectations exist that people take their own responsibilities. Inclusion of both effectiveness and efficiency measures of purchasing