Abstract -
We have proposed a new technique for human identification using spectral acquisition of skin tissue. We have collected database containing 500 samples of 25 different people. We have applied supervised machine learning techniques to explore individual features of the collected spectrums. We have tested different spectrum resolutions ranging from several wavelengths to maximum allowed by the collected samples. The results achieved are satisfactory. For the multilayer perceptron classifier the identification efficiency is above 93%. To verify the improvement of the results using spectral space instead of color space, we have transformed spectra into RGB space by regression techniques and applied supervised classification once again. Identification based on the RGB colors of the human skin tissue is much less effective. The obtained classifier accuracy is only at the level of 51%.I. INTRODUCTION
There are numerous areas in which human identification is used. We can enumerate crime, civil and consumer identification, authorization and access control, work time registration, monitoring and supervision of public places, border control and many others. There are various techniques for human recognition. The best known are fingerprinting, iris, ECG signal, identification based on human movement, face and voice recognition; the way of typing or DNA profile matching. However, each technique has some limitations and shortcomings. Face recognition seems to be a promising technique. On the other hand, it requires a lot of computation power and good quality of human face photographs. DNA profile matching is very strong, but the DNA samples have to be taken from the body, which requires a direct contact with identified human. We have decided to evaluate spectroscopy for the human identification based on the earlier research. During the investigation of the multispectral imaging in skin cancer detection [9],[14] we have executed large number of different tests in which we have used database of multispectral images for the patients with a prior cancer diagnosis. For each patient we have captured two multispectral photographs. The first one represented the cancerous tissues and the second one healthy tissue. The cancer detection was based on the spectral signatures of the image pixels. To divide spectral signatures into train and Manuscript received July 29, 2011; revised August 10, 2011. This work was financed from the Polish Ministry of Science and Higher Education resources in 2009-2012 years as a research project and supported by the European Union from the European Social Fund
Adam Switonski is with the Polish-Japanese Institute of Information Technology, Aleja Legionów 2, 41-902 Bytom, Poland and Silesian University of Technology, ul. Akademicka 16, 41-100 Gliwice, Poland; (e-mail: [email protected], adam.switonski@polsl,pl).
Lukasz Janik is with Silesian University of Technology, ul. Akademicka 16, 41-100 Gliwice, Poland; (e-mail: lukasz,janik@polsl,pl).
Karol Jedrasiak is with Silesian University of Technology, ul. Akademicka 16, 41-100 Gliwice, Poland; (e-mail: karol.jedrasiak@polsl,pl).
test parts we have used cross validation method. When cross validation groups contained only pixels of a single image we have obtained efficiency much below 50%. It is surprising,
especially from the point of view of two class problem in which if we do nothing, we should achieve 50% detection accuracy by a simple random class selection. The only reasonable explanation of this fact are individual spectral features of the tissues which are stronger than common features of the cancerous tissues. Thus, we have decided to verify the discovered and stated hypothesis.
Moreover, the proposed method is non-invasive, can be applied without the awareness of the identified human, does not require high-cost specialized devices and has low computational complexity. It means that satisfactory results could have direct practical applications.
II. SKIN SPECTRAL CHARACTERISTIC
Spectroscopy is a non-invasive method which allows to capture physiological and biochemical data of the tissue. Photons stream directed on the skin by a light source can be scattered, absorbed, reflected or transmitted.
Skin contains various chromophores and rough surface. Thus, light directed on skin tissue is affected by all above mentioned phenomena. Each person has a different structure of skin, its thickness, distribution and capacity of various chromophores. Therefore, input light directed on the skin is transformed in different ways for each person. Chromophores present in the skin, which have a major contribution to the light transformation, are haemoglobin, melanin, betacarotene and bilirubin [1]. Each of them causes distinctive effects, which varies depending on the wavelength. The chromophores mainly absorb or scatter the incident light, while for water, lipids, and proteins, especially collagen, absorption is low and scatters high. Melanin, which accumulates in basal layer of epidermis, is produced by melanocytes and is the sole pigment which affects the transmittance of human epidermis. Melanin absorbs waves in spectrum between 250 and 1200 mm. The absorption intensity heightens towards shorter wavelengths and it is irregular. Consequently, most of short wavelengths opposite to the long ones are absorbed or retransmitted in epidermis and do not reach deeper skin layers.
Dermis optic features differ more from of epidermis. The optics properties are determined by blood-borne chromophores - haemoglobin, betacarotene and bilirubin. Haemoglobin transports oxygen from lungs to the remaining tissues through blood vessels and returns carbon dioxide to lungs. The absorption of haemoglobin is present in spectral range of 390 nm to 1000 mm and has a few peaks depending whether the oxygen is transported. There are two peaks for haemoglobin without oxygen with maxima at 550 nm and 760 nm, and two with oxygen with maxima are at 548 nm and 576 nm [2]. Bilirubin has absorption peaks
Individual Features of the Skin Spectra
ranging from 480 to 510 nm, while betacarotene has two peaks at 450 and 480 nm. Water absorption starts from wavelengths of 600 nm and increases for longer ones. Pathways of the incident light in skin are presented in Fig. 1
[image:2.595.51.286.150.325.2]Summarizing, such a complex process of reflecting, scattering and absorbing of the electromagnetic radiation delivered by a light source, should affect the individual features of the skin spectra.
Fig. 1. Optical pathways in human skin [3]
III. RELATED WORK
The authors of [4] analyzed human skin illumination and proposed its layered model, based on optical properties of its each major constituents. The model is simplified and consists of three layers: Sebum, Epidermis, Inner Dermis with layers thickness 0.1 cm, 0.1 cm, and 0.25 cm respectively. The authors performed Monte Carlo simulation and deducted that Sebum layer is important contributor to the overall skin reflection. Comprehensive analysis and description of skin optic features can be found in [3], [1] and [6]. In [3] the authors defined three layers, which exhibit significantly different light propagations. In the following step, those are further divided into five, two and single sublayers respectively. Sebum is not considered as a layer. In comparison to the model proposed in [4] an internal Subcutis layer is added and it lies beneath Inner Dermis. [1] contains detailed study on optical pathways in Epidermis and Dermis for in vitro and in vivo experiments. Both layers were investigated in the range between 300nm and 2400nm in order to extract absorption, transmittance, remittance and scattering capabilities. The authors found melanin as the major absorber in Epidermis, particularly for shorter wavelengths, and proposed to consider Dermis as turbid tissue matrix, where optical scattering is the inverse function of wavelength. A layered skin model is presented in [6]. The author developed two mathematical skin models based on diffusion theory. The first one considers skin as one layer and the second one distinguishes three layers. Several medical diagnosis techniques based on spectrometry were proposed. There are more pieces of work where spectroscopy is applied for medical diagnosis, e.g. [7], [8] and [9].
Example spectroscopy application for recognition has been performed at [5]. The multispectral images of faces have
been collected from 200 people. Images have been taken in near-infrared range using CCD camera with tuneable (FWHM) filter at spectral resolution of 31 bands. The recognition algorithm has been developed, which takes small squared regions extracted from filtered image. Regions are selected depending on face orientation. In the next step spectral vector is calculated by average value assigned to each pixel and scaled by tissue type factor. Vectors are then used to calculate distance matrix, which is afterwards used for subject classification. The algorithm gives cumulative match score from 0.5 to 0.98. The best result is achieved for the frontal view and decreases significantly to 0.5 for f 90 degrees view. The authors conclude that hyperspectral face recognition is problematic due to head rotation.
IV. COLLECTED DATABASE
[image:2.595.318.531.313.424.2]We have built a system for capturing spectral data from human skin. The system consists of Ocean Optics High-Resolution HR4000 Spectrometer [10], a laptop, optical fiber, two sources of ambient light, and measuring surface.
Fig. 2. System used for collection of spectral data from skin
Two identical sources of ambient light illuminate the entire measured surface equally. A photons stream from light sources which is spectrally reflected on the surface of the skin or scattered multiple times and then re-emerged from skin is further captured by optical fiber as presented in Fig. 2. The optical fiber transmits photons to spectrometer,
[image:2.595.312.543.607.726.2]where it disperses onto linear CCD array detector. The detector determines the intensity of incident light for each wavelength. Afterwards, those signals are converted into digital form and sent to computer. Gathered data is then processed.
Fig. 3. The measured points
hand and thumb. In order to avoid distortion each measurement has been repeated five times, so 500 measurements have been done. After each trial, the hand has been taken back and then returned to the measuring surface. The spectral measurement has been performed in visible and near-infrared range from 373.23 to 826.82 wavelengths with 0.14 intervals. Integration time has been set to 100 ms for the experiment.
a) b)
[image:3.595.42.288.161.377.2] [image:3.595.305.544.557.632.2]c) d)
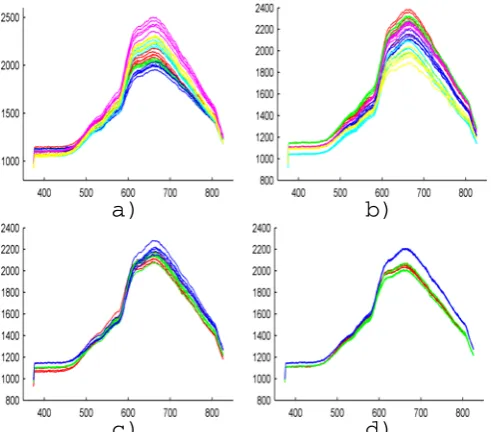
Fig. 4. Example spectra of the collected database. a) right hand of
six different persons b) left thumb of six different persons, c), d) left and right hand and thumb for randomly selected per.
In Fig. 4 we have visualized example spectra of the
collected database. The first and the second charts in the upper row present spectra of the right hand and left thumb respectively for six randomly selected people labelled by different colors. Each of the charts in the lower row presents spectra of the single randomly chosen persons. The red, green, blue and cyan represent right hand, left hand, right thumb and left thumb respectively.
The human skin is of the red and pink hue, which explains much greater intensities of wavelengths above 600 nm. We are able to notice slight differences among people. Unfortunately, there are visible absolute and, what is more important, relative differences among persons for the hand and thumb. Thus, we cannot state general rules for recognizing spectrum of the presented persons.
V. SPECTRAL IDENTIFICATION
The problem of the individual spectral distinction is not trivial. The boundaries between the human spectra even for only six people are not strict and depend on the analyzed
body part. The resolution of the acquired spectra is very high, which makes such a space much more difficult to explore. That is reason for choosing supervised machine learning techniques to analyze the spectral space and find distinctive individual features to classify them as belonging to the given person.
We have decided to use three filters in the preprocessing stage. To reduce the noise of the high resolution spectra representations and to reduce dimensionality of the classified signatures we have applied the spectral resolution resizing filter. It transforms the original collected spectrum into lower valued ones by dividing spectral dimension into the given number of equal size windows and calculating an average intensity of the window wavelengths. To evaluate the spectral ranges and discover the most informative ones we have applied extra reduction by spectral selections. The selection was based on the continuous ranges of the spectral domain with different sizes and locations. We have tested a lot of spectral resolutions starting from one valued to the complete resolution. For the low valued resolutions we have applied arithmetic progression and starting from twenty valued spectra we have used geometric progression. The last preprocessing filter separated spectra of different body parts into the disjoint subsets. Thus, identification was based only on the spectra of the given body parts: left hand, right hand, left and right hand, left thumb and the remaining possible combinations.
We have iterated experiments for every combination of the preprocessing filters and their parameters. It gives a large number of iterations. That is why in the introductory stage we had to use low computational costs classifiers. We have chosen Naive Bayes [13] and k-nearest neighbour [12] classifiers. For the Naive Bayes we have applied normal distribution and distribution estimated by kernel based methods and number of analyzed nearest neighbours of kNN classifier is in the range one to ten.
In the introductory stage we have executed 40 000 separate experiments, generated by all possible combinations of the classifiers and preprocessing filters. We have calculated the efficiency of the classifiers – the percentage of correctly identified persons. In order to split the database into the train and test parts we have used cross validation method [11].
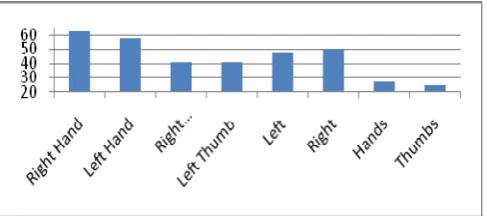
Fig. 5. Identification results for different body parts
Best result of the introductory stage is 91.73%. It has been achieved for the right hand spectra at the resolution of 200 values by the nearest neighbour classifier. As we can notice in Fig. 5 there are only slight differences between the body
parts. They do not exceed 3% and we can treat them as the experiment errors. Using all body parts in training and testing does not worsen the identification accuracy. In Fig 6 we have visualized classification results obtained
[image:3.595.47.279.622.745.2]but to obtain efficiency over 82% we can track only the narrow spectral range 370-500nm. Much more individual data is stored for shorter and the middle sized wavelengths. The analysis of the range 600-800 gives only 63%.
Fig. 6. Classification results obtained by the spectra of
[image:4.595.50.290.261.337.2]different wavelenghts
Fig. 7. The impact of the number of the spectra components
on the results
The impact of the number of the spectra components on the classification accuracy is visualized in Fig.7. Single valued
spectrum gives only 19% efficiency, five valued has 85% and ten valued over 89%. The best results have been obtained for 200 valued, but complete resolution spectrum with 3648 values is only 1% worse. The influence of the possible noise of the high resolution spectra is almost invisible.
We have done one more experiment. To evaluate the spectral variations between the body parts we have trained and tested classifiers by the spectra of different body parts.. The results, presented in Fig. 8, are much worse. In the best
[image:4.595.310.547.486.570.2]case we have obtained only 63% classifier efficiency. The spectra differences between body parts are remarkable, which results in a such huge decrease in the identification accuracy. Those differences are greater between hands and thumbs in comparison to the left and right sides.
Fig. 8. Identification based on the trainset without data of
the given body part
To improve the results more, for the most promising combination of the preprocessing filters we have tested functional classifier multilayer perceptron [11]. We have
made iterations for different complexities of the network structure, number of learning cycles and learning rates. We have obtained a slight improvement. The classification accuracy has increased to 93.8%.
VI. SKIN COLOR IDENTIFICATION
To evaluate the improvements of the skin spectral representation on the identification quality, in comparison to the typical color representation, we have transformed collected spectra into the RGB space and repeated the classification experiments. If we know the spectra to transform and the spectra of calculated red, green and blue colors we can make transformation directly. However, the problem is not as simple as it looks to be. The response of the spectrometer is given in the scale of the device and what is even important, the captured spectrum depends on the light source and its distance to the captured surface. The whole process requires some kind of calibration, which determines the normalization factors. The linear model is usually sufficient and because the RGB values are also linear combinations of the spectra intensities, finally we have to find global linear transformation from the given spectral space to the RGB colorspace.
[image:4.595.49.293.594.702.2]If we have some training samples we can apply regression techniques - supervised learning with numeric predicted class values. The training set has been prepared on the basis of the captured spectra of the X-Rite ColorChecker Classic [15] with known RGB values of the colors. We have used standard least-square regression, Simple Linear Regression and Least Median Square Regression [11]. Simple Linear Regression builds a linear regression model based on the single attribute with the smallest squared error. The least Median Square Regression iterates the standard linear regression for the subsamples and chooses the one with minimal median squared error.
Fig. 9. Mean absolute error of the spectra transformation to the RGB colorspace
The mean absolute errors of the regression are shown in Fig.
9. The regression transforms spectra properly into the RGB
color space. For the best classifier the standard linear regression, the mean absolute error is less than 10, which is only 4% of the global 8 bit scale.
VII. SUMMARY AND CONCLUSIONS
We have evaluated biometric features of the human skin spectra. To accomplish the task we have collected human spectra database containing 500 samples of 25 people and represented four different body parts. We have proposed the preprocessing stage to remove the acquisition noise, reduce spectral resolution and to discover most individual spectral ranges. To identify spectra we have applied supervised learning. The results are promising – 93.8% identification accuracy surely does not deny and even seems to confirm the stated hypothesis of the individual spectral features of the human skin. The skin of different people also has common color features, but the identification based only on the color data is much less effective in comparison to even low resolution spectra. 50% accuracy is undoubtedly inacceptable from the point of view of possible deployments. There are strong spectral differences between body parts, which cause the loss of individual features among them and could decrease the identification efficiency. Thus, effective method requires to compare the spectra of the same body parts.
The proposed method strongly relies on the validity of the spectra used in the training phase. It could be some kind of limitation, because biological processes of the skin tissues have impact on the reflected spectra. At the current stage we have not investigated the influence of the temporal spectra properties on the identification accuracy. It is possible that variations are not remarkable and do not have a great impact on the proposed method. It is also possible that in spite of the variations, the spectra have some common individual features which would be discovered by supervised learning or other applied techniques. However, even if the long term validity of the spectra would cause the remarkable loss of efficiency the method could still have a practical meaning. For instance, it could be used in an access control during the public events – the train samples can be captured at the entry and they are obviously valid for a few hours.
Future improvements could be obtained by the application of the hyper or multispectral imaging. It would allow us to analyze the whole skin surfaces rather than their single points. It is quite possible that variations of the spectral skin properties are also individual
REFERENCES
[1] R.R. Anderson and J. a Parrish, “The Optics of Human Skin.,” Journal of Investigative Dermatology, vol. 77, Jul. 1981, pp. 13-19.
[2] A.B. -and O.W. van A. W.G. Zijlstra, Visible and Near Infrared Absorption Spectra of Human and Animal Haemoglobin determination and application, 2000.
[3] T. Igarashi, K. Nishino, and S.K. Nayar, “The Appearance of Human Skin,” Science, 2005.
[4] C.S.-ling Ng and L. Li, “A Multi-Layered Reflection Model of Natural Human Skin,” Computer Engineering, 2001, pp. 249-256.
[5] G. Healey, M. Prasad, and B. Tromberg, “Face recognition in hyperspectral images,” IEEE Transactions on Pattern Analysis and Machine Intelligence, vol. 25, Dec. 2003, pp. 1552-1560
[6] L.L. Randeberg, “Diagnostic applications of diffuse reflectance spectroscopy,” Compare A Journal Of Comparative Education, 2005.
[7] N. Baheri, M. Miranbaygi, and R. Malekfar, “Improved skin xerosis detection by combining extracted features from Raman spectra,” 2009 2nd International Symposium on Applied Sciences in Biomedical and Communication Technologies, Nov. 2009, pp. 1-6.
[8] N.E.I.L. V K Hughes, P S Ellis, T Burt, “The practical application of reflectance spectrophotometry for the demonstration of haemoglobin and its degradation in bruisesThe practical application of reflectance spectrophotometry for the demonstration of haemoglobin and its degradation in bruises,” Clinical pathology, vol. 57, 2004, pp. 335-359.
[9] Świtoński A., Michalak M., Josiński H., Wojciechowski K.: Detection of Tumor Tissue Based on the Multispectral Imaging, in Computer Vision and Graphics, Lecture Notes in Computer Science, Part 2, p. 325-333, S-pringer 2010. [10]Ocean Optics Spectrometers http://www.oceanoptics.com [11]Witten I., Frank E.: Data Mining: Practical Machine Learning
Tools and Techniques, Morgan Kaufmann, 2005
[12]Aha D., Kibler D.. Instance-based learning algorithms. Machine Learning. 6:37-66, 1991.
[13]John G., Langley P.: Estimating Continuous Distributions in Bayesian Classifiers. In: Eleventh Conference on Uncertainty in Artificial Intelligence, San Mateo, 338-345, 1995.
![Fig. 1. Optical pathways in human skin [3]](https://thumb-us.123doks.com/thumbv2/123dok_us/1285972.657416/2.595.51.286.150.325/fig-optical-pathways-human-skin.webp)