Compression Method for High Dynamic Range
Intensity to Improve SAR Image Visibility
Satoshi Hisanaga, Koji Wakimoto and Koji Okamura
Abstract—It is possible to interpret the shape of buildings based on synthetic aperture radar (SAR) images acquired using airborne SAR systems. However, the pixel values of SAR images have high dynamic range intensity, and SAR images are not displayable without dynamic range intensity compression. We therefore have developed a dynamic range intensity compression method suitable for SAR image features. Using our method, the visibility of SARs images has been improved.
Index Terms—synthetic aperture radar, visualization, dy-namic range intensity compression.
I. INTRODUCTION
Since synthetic aperture radar (SAR) works under all weather conditions, SAR images are used to observe the shape of ground structures after a disaster for damage as-sessment. The intensities of backscattered microwave pulses, which are reflected from the ground, are expressed in SAR images as pixel values. Pixel values lower over flat ground. In some instances, however, pixel values increase due to backscattering from metal objects. This indicates that the pixel values of SAR images have a high dynamic range. The conventional method used to display SAR images contains a drawback: without compression of intensity with dynamic range, SAR images cannot be displayed with adequate con-trast. Furthermore, the pixel values of SAR images contain speckle noise. This means that the intensity of SAR images partially changes at random. Although studies have looked into both multi look methods and backscattering estimation methods as a means to address this issue, there seems to be no established method to erase speckle noise[1], [2].
If we regard an SAR image as a high dynamic range image (HDRI), we investigated studies to improve visibility of HDRI. A study on a HDRI display system was conducted by Seetzen[3]. The study was also used to investigate the distinctive threshold of the human visual system; It was found that 1,200 is the maximum number of distinguishable steps in brightness that humans can perceive on a display[4], [5]. It follows from this restriction that the dynamic range of intensity has to be compressed to within 1,200 steps, while at the same time maintaining a sufficient difference in intensity for artificial objects to remain interpretable. Lambers et al. applied several intensity compression methods designed for optical images toward the evaluation of SAR images[6]. Their evaluation results demonstrated the need to develop
Manuscript received December 28, 2010.
S. Hisanaga is with Electric Systems Group, Mitsubishi Electric Corpo-ration, Tokyo 100–8310, Japan, and is a student at the Graduate School of Information Science and Electrical Engineering, KYUSHU UNIVERSITY, Fukuoka 812–0395, Japan.
K. Wakimoto is with Information Technology R&D Center, Mitsubishi Electric Corporation, Kanagawa 247–8501, Japan.
K. Okamura is an associate professor at the Graduate School of Informa-tion Science and Electrical Engineering, KYUSHU UNIVERSITY, Fukuoka 812–0395, Japan.
methods tailored to multiplicative speckle and the presence of high peaks with small spatial extensions. An edge-preserving filter has also been investigated for use in displaying images with high dynamic range intensity[7]. However, the edge-preserving filter smoothes out areas without edges, and it is therefore not suitable for SAR images in which the edges are not clear.
Therefore, we have developed a dynamic range intensity compression method that is suitable for SAR image features. The main aspect of our method is that it adopts a different level compression for each area. Using our method, the visibility of SAR images has been improved.
II. SAR IMAGE
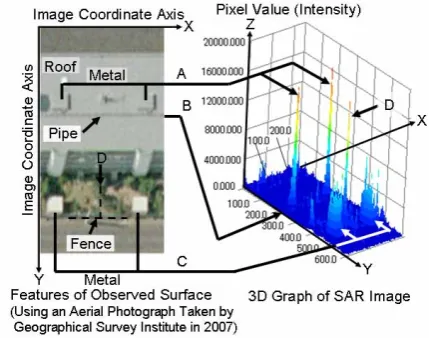
[image:1.595.317.532.407.576.2]Fig. 1 shows an example of a SAR image. The left side of the figure is an aerial photograph taken by the Geographical Survey Institute of Japan in 2007. The right side of the figure is a graph illustrating the pixel values of the SAR image in the z axis. According to the aerial photograph, the upper part
Fig. 1. Example of SAR Image
of this SAR image seems to show the flat roof of a building. Additionally, there are four square metal regions and a metal pipe on the roof. One-third of the SAR image seems to show plants on the ground. There are also two sections with metal materials. The A and C arrows in Fig. 1 show the intensities of these metal materials. Fig. 1 indicates that the intensity graph of square region is expressed as a mountain shape with a high peak in SAR image. The D arrow in Fig. 1 shows the intensity of a metal fence. The intensity is not flat along the fence. In addition, there are a few differences in the intensity of the pipe (Arrow B) and flat roof.
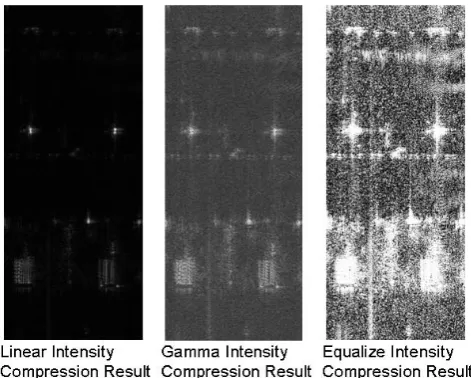
compression using general methods. In Fig. 2, the left image is the result of using the linear compression method, while the middle figure is the result from the gamma compression method. As can be seen, these images are unclear. However, the right figure, which is the result from using the histogram equalization method, is clear. Formula 1 details the linear compression method. Imax is the maximum intensity of an SAR image and Imin is the minimum intensity. Tmax is the number of intensity steps used to obtain an intensity com-pressed image. Formula 2 illustrates the gamma compression method. In the equalized intensity compression method, the numbers of pixels belonging to each histogram bin become equal.
Fig. 2. Intensity Compression Results by General Methods
T(I) =Tmax
I−Imin Imax−Imin
(1)
T(I) =Tmax( I Tmax
)1/γ (2)
In Fig. 2, the square objects can be interpreted using the results from the equalized compression method. However, other objects cannot be distinguished from image noise. Since the results obtained using the gamma compression method are unclear due to a high peak, the A arrow in Fig. 1 and B arrow in Fig. 2 are also not clearly displayed.
III. INTENSITYCOMPRESSIONMETHOD
We focused on the fact that large changes in pixel values gather around regions with artificial materials. However, pixel values representing artificial materials are not similar to speckles and high peaks. For this reason, we used an approach to cluster the changing pixel values by area for the purpose of detecting areas with artificial materials . We also applied a intensity compression method at different level for each area (See Fig. 3).
A. Clustering Method
The problems inherent in the use of clustering for SAR images are as follows.
[image:2.595.51.287.220.409.2]• Speckle noise appears on SAR images. • High peak noise appears on SAR images. • The intensity of artificial objects is uncertain.
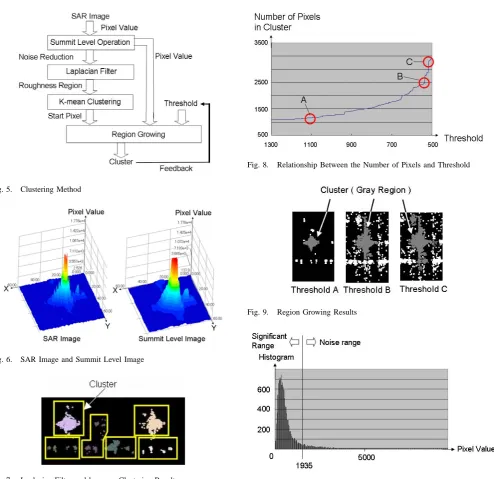
Fig. 3. Fllow of Intensity Compression Method
Fig. 4. Region Growing Method
Based on these problems, there is a difference in the intensities of artificial objects and neighborhoods without a clear edge. Because the intensities of artificial objects are unclear, applying a clustering method using a threshold level is not suitable.
We adopted an approach to cluster pixels together that show little difference in their intensities. Fig. 4 shows a region growing method. Using this method, the system clusters artificial objects within an area.
Fig. 5 shows the clustering method. First, in order to reduce a small gap in the pixel values, the system pro-cesses summit levels operating in an SAR image. Formula 3 illustrates this summit levels operation. In formula, I is the intensity, and N is the neighborhood. The summit level operation replaces the small gap in pixel values with the maximum intensity of the neighborhood. Fig. 6 shows an example of the summit level operation. The left section of Fig. 6 is a SAR image. In the image, there are gaps in the intensity of the pixel values because the pixels alternately take large and small values. The right section of Fig. 6 shows the results of a summit level operation in which there are no gaps in intensity in order to prevent the occurrence of clustering.
I(X, Y) =M ax{I(X0, Y0)|(X0, Y0)∈N(X, Y)} (3)
[image:2.595.322.529.240.341.2]Fig. 5. Clustering Method
[image:3.595.306.542.53.194.2]Fig. 6. SAR Image and Summit Level Image
Fig. 7. Laplacian Filter and k-means Clustering Result
Since the operation for stopping a growing region at a threshold of intensity is not fixed, we attempted to fix the threshold of intensity using the number of the pixels in the cluster. Fig. 8 shows the relationship between the number of pixels in a cluster and the threshold of intensity. The number of pixels in a cluster increases with a decrease in the threshold level. We considered that an increase of pixels in a cluster results from a connection of areas with artificial metal with other areas. In Fig. 8, the area with artificial metal is fixed using threshold B. For threshold A, the number of pixels is not sufficient. On the contrary, for threshold C, the cluster includes unnecessary pixels (See Fig. 9).
B. Intensity Compression Method
For a SAR image, the general intensity compression method for electro-optical images is not suitable. We used two approaches for SAR image intensity compression.
The first approach is a histogram equalization method for increasing contrast. The second approach uses both
Fig. 8. Relationship Between the Number of Pixels and Threshold
Fig. 9. Region Growing Results
Fig. 10. Histogram of Region
an estimation method for image noise levels and a linear intensity compression method. In this way, we assume image noise as a small region with high peak intensity. Fig. 10 shows a histogram of the artificial metal area shown in Fig. 9. The system determines a pixel value as the threshold of noise, where the incline of the histogram for the pixel level becomes more than the determined value. In the example shown in Fig. 10, the threshold becomes 1,935 pixels. The system compresses the intensity in the area of the artificial metal using the equalization method with an intensity of less than 1,935 pixels.
[image:3.595.291.548.88.522.2] [image:3.595.307.551.297.511.2] [image:3.595.97.243.421.509.2]noise throughout the entire image. Both the results from histogram equalization and intensity-limited linear equaliza-tion are clearer than the results achieved using histogram equalization. Moreover, the results from intensity-limited linear equalization are the clearest.
Fig. 11. Effect of Low Pass Filter
Fig. 12. Intensity Compression Results
IV. EXPERIMENTRESULT
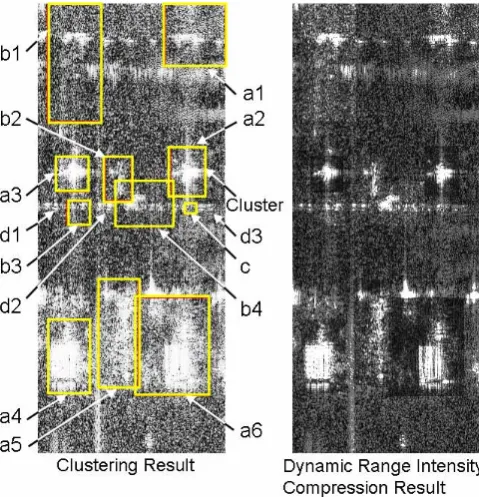
The left-side images of Fig. 13 show detected artificial material area. The experimental results are as follows: Of the eleven artificial material clusters detected on the SAR image, two clusters ((a6) and (b1) in Fig. 13) were larger than the size of the artificial materials, and one cluster ((c) in Fig. 13) was smaller. The area in a6 of Fig. 13 grew to a large size because the region growing method did not stop due to the small differences in intensity around the objects. For b1, the minimum bounding rectangle grew to a large size since both the height and width of the area are long. For c, on the other hand, as a high peak pixel was the starting pixel of the region of growth, c stopped with a high pixel value. A small region of artificial material was not detected ((d1), (d2) and (d3) in Fig. 13) because the areas of high intensity are small and separately located.
The right figure shows the results of high dynamic range intensity compression. The edges of the artificial material are displayed more clearly than in the intensity compression image (shown in Fig. 2) using the general methods.
For a1-a6 in Fig. 13, the amount of noise decreased and the contrast increased. In particular, the edge of the artificial metal objects became clearer at around a4 and a6. For a1, a2, a3, and a5, the edges of the artificial metal objects were not
[image:4.595.308.548.162.411.2]very clear due to the noise on the SAR image. However, the location of the metal objects did become clear as the intensity of the area without metal objects was reduced. For b1-b4, the noise decreased. However, the contrast did not sufficiently increase. For this reason, at a low contrast, the intensity of the metal objects does not have a high value compared with the neighboring areas around b1-b4. The system equalized intensity of the area without detected artificial metal.
Fig. 13. Experimental Result by Our Method
V. CONCLUSION
We developed a dynamic range intensity compression method suitable for SAR image features. The main aspect of our method is that the system adopts a different level compression ratio for each area. Using our method, the visibility of SAR images has been improved. However, two problems remain when using a clustering method: over detection and under detection. For future work, more research is required on the clustering of artificial metal objects on SAR images to further improve visibility.
REFERENCES
[1] M.R. Azimi-Sadjadi and S. Bannour:“Two-dimensional adaptive block Kalman filtering of SAR imagery”, IEEE Transactions on Geoscience and Remote Sensing, vol. 29, pp. 742-753, 1991
[2] J. S. Lee:“Digital image enhancement and noise filtering by use of local statistics”, Pattern Analysis and Machine Intelligence, vol. PAMI-2, pp. 165-168, 1980
[3] Helge Seetzen, Wolfgang Heidrich, Wolfgang Stuerzlinger, Greg Ward, Lorne Whitehead, Matthew Trentacoste, Abhijeet Ghosh, Andrejs Vorozcovs:“High Dynamic Range Display Systems”, Proc. ACM SIGGRAPH 2004, pp. 760-768, 2004
[4] Peter G. J. Barten:“Physical model for the contrast sensitivity of the human eye”, Proc. SPIE Human Vision, Visual Processing, and Digital Display III, vol. 1666, pp. 57-72, 1992
[5] Peter G. J. Barten:“Spatio-temporal model for the contrast sensitivity of the human eye and its temporal aspects”, Proc. SPIE Human Vision, Visual Processing, and Digital Display IV, vol. 1913, pp. 2-14, 1993 [6] M. Lambers, H. Nies, A. Kolb:“Interactive Dynamic Range Reduction
[7] Fredo Durand, Julie Dorsey:“Fast bilateral filtering for the display of high-dynamic-range images”, ACM Transactions on Graphics (TOG), Vol. 21 Issue 3 , pp. 844-847, July 2002