STATISTICAL AND SOCIAL INQUIRY SOCIETY
OF IRELAND.
PRELIMINARY NOTES ON THE CENSUS OF POPULATION IN NORTHERN IRELAND, 1937.
By JAMES MEENAN, M.A., B.L., Barrington Lecturer.
(Read on Friday, 28th May, 1937.)
The second Census of the Six Counties of Northern Ireland was taken on February 28th, 1937. The preliminary figures of that Census have now been published, and it will be of some interest to discover how far they disclose trends of population change which have been noted in the Census taken for the Free State area in 1936.
Such an enquiry may be of greater interest since even the elementary statistics of the Six Counties are little known. Not so long ago one of the first things taught at school was the population of Ireland : it is doubtful if it is now known to any.but the most Macaulayesque of schoolboys. The change; if not for the better, is perhaps inevitable. Before partition the statistics for the country were easily available. Since then they have, in one sense, become even more complete. Since partition the material for the statistical study of the Free State area, and, to a necessarily lesser extent on account of the difference in political status, of the Six Counties has increased enormously. When one con-siders the output of our own Statistics Branch, one cannot imagine what smallest branch of life has been left unsurveyed. But at the same time, as the study of the parts has increased, the study of the whole has declined, and, apart from the valuable collation of the more important figures in a couple of directories, there is no publication which will give the figures necessary for any study of the country as a whole. Sug-gestions are far cheaper than their adoption, but is it impossible that we should have some publication, however unambitious, which would give the figures for Ireland of population, migration, trade and finance ? In another sense the progress of population in the Six County area must be of interest. The demographic history of Ireland has always beefn of the greatest interest to students on account of the meteoric rise
70 Census of Population in Northern Irelctnd.
Counties were such as to redress, in part at least, the exaggerations of the other Twenty-Six. These exaggerations have remained with us, and, in view of the Preliminary Report of our Census of 1936, it is not too much to say that there does not appear to be any immediate prospect of their disappearance. It is therefore of some importance to enquire what has been the trend in the Six Counties, whether it has tended towards the norm or whether it retains the exceptional characteristics which marked the statistics of united Ireland, and, lastly, if there is any divergence from the phenomena of the Twenty-Six Counties, whether that divergence is to be found over all the Six Counties, or whether within that small area there exists marked divergence on one side or the other.
The first Census of the Six Counties was taken on the night of the 18th-19th April, 1926, on the same night as that for the Free State area—a collaboration which one hopes it will be found possible to renew. The second was taken, as has been said, on the night of the 28th February, 1937, thus covering a space of time slightly longer than the normal. It disclosed that in that period the population of the area had increased by 22,616, or by a rate of 1-8 per cent. It is of interest to set together the populations, in 1926 and 1937, of the divisions of Ireland.1
It will be borne in mind that both the Free State and Northern Ireland figures are preliminary and subject to revision. The definitive figures are not likely to be appreciably different—certainly not to a degree which would affect the deductions in this paper.
TABLE I.—POPULATION OF IRELAND, FREE STATE AND NORTHERN IRELAND, AND THE PROVINCES, 1926 AND 1937.
Leinster Munster
Con-nacht Ulster Ireland StateFree NorthernIreland
1926 1936-7
1,149,092
1,219,501 969,902 941,392
552,907 524,847
1,556,652 1,559,291
4,228,553
4,245,031
2,971,992
2,965,854
1,256,561 1,279,177
It is the first Census year since 1841 in which an increase of population has been reported. Against the increase of 22,616 in the Six Counties must be placed the decrease of 6,138 in the Free State ; movements small enough in themselves, but provoking the hope that the larger area may soon attain the position of the smaller. Of the provinces it will be noticed that Ulster maintains that primacy in number of popu-lation which it has kept since the first Census was taken in 1821, although the margin between it and Leinster has shrunk since the preceding Census of 1926. In fact, it will be seen that the difference of population between the two provinces is largely the measure of migration to Dublin and Belfast respectively. It is only since 1891 that Leinster has occupied second place among the provinces being formerly surpassed by Munster. The only provinces to show an increase are again Leinster and Ulster. The increase in the former is the second in its post-Famine history, the first being in the decade 1901-11, but it is greater than the increase in Ulster, which is due wholly to the increase in the Six County area. The three Free State counties showed a decrease of 19,977.
By James Meenmv, MA, B L, Barnngton Lectwer 71
The percentage changes in the population of the provinces are better contrasted over a longer period
TABLE I I — P E R C E N T A G E CHANGES IN THE POPULATION o r IRELAND , F R E E STATE, AND NORTHERN IRELAND AND THE PROVINCES,
1821-1937 1821-31 1831-41 1841-51 1851-61 1861-71 1871-81 1881-91 1891-01 1901-11 1911-26 1926-36-7 Lemster + 87 + 40 —15 1 —13 3 —, 8 1 — 4 5 — 7 1 — 3 3
+ 08
— 1 ]
+ 6 1
Minister
+ 15 1
4 - 8 2 —22 5 —18 9 - ^ 7 9 — 4 4 —11 9 — 8 3 — 3 8 - ^ 6 2 — 2 9
Connacht
+ 21 0 + 5 1
—28 7 — 9 8 — 7 4 —^ 2 9 —11 8 —10 1 — 5 6 — 9 5 — 5 1
Ulster
+ 144 + 45
—15 7 — 4 9 — 4 2 — 4 9 — 7 0 — 2 3 —* 0 1 — 1 6
+ 02
Ireland
+ 14 2 + 55
—19 8 —11 8 — 6 7 _ 4 4 — 9 1
— 52
— 1 5 — 3 7
+ 0 4
Free State + 14-2 + 5 7
—21 6 —14 2 — 7 9 — 4-5 —10 4 — 7-1 — 2-5 — 5 3 — 0-2
Northern Ireland
+ 14 0 + 4-8 —12 6 ^ - 3 2 — 2 7 — 4 0 — 5 3 + 0 1 + 1 1 + 05 + 18
It is noticeable that not only the Six County area but also Ulster as a whole not only increased in population before the Famine at a rate comparable with that of the other provinces but have since decreased, if at all, at a markedly lower rate than that of the other provinces
The population of the Six County area has increased, if only shghtly, ever since 1891, while it is only in the last decade that the change in Ireland as a whole has been upwards for the first time since 1841 The percentage change m Leinster is the greatest increase marked anywhere since the same year, and the decrease m Munster is the lowest ever recorded
The changes in the counties of Northern Ireland are as follows —
TABLE I I I —INTERCENSAL CHANGES OF THE SIX COUNTIES OF NORTHERN IRELAND, 1926-37
NORTHERN IRELAND
Antrim Armagh Belfast C B Down Fermanagh Derry (excluding
County Borough) Derry C B
Tyrone 1926 1,256,561 191,643 110,070 415,151 209,228 57,984 94,534 45,159 132,792 1937 1,279,177 197,284 108,936 437,824 210,274 54,560 94,883 47,857 127,559 Change ( + Increase, —Decrease) +22,616 +5,641 —1,134 +22,673 +1,046 —3,424 +349 +2,698 —5,233
72 Census of Population m Northern Ireland
areas showing increases in Northern Ireland were Belfast and the contiguous counties of Antrim and Down with the County Borough of Derry , the comparable areas in the Free State were Dublin City and County and Counties Louth and Wicklow, and the Cities of Cork, Limerick and Galway (The list is not complete, however)
[image:4.401.53.351.258.493.2]In the Six Counties the chief decreases were m Tyrone and Fermanagh, and the least increase m County Derry , m the Free State the chief decreases were in Leitnm, Roscoinmon, Cavan and Donegal When one remembers that the next greatest decrease was found m Donegal, Mayo and Monaghan, one may well think that the area of depopulation appears to have shifted m the last half century Nevertheless, the counties with the largest population continue, though with changes of place since 1926, to be Dublin (City and County), 587,000 , Belfast County Borough, 437,000 , Cork (City and County), 355,000 , Down, 209,000 , Antrim, 191,000 , Galway, 168,000 , Mayo, 161,000 , Donegal, 142,000 , Tipperary, 141,000 , Limerick, 141,000 , Kerry, 139,000, Tyrone, 127,000 , and Armagh, 110,000 The percentage changes are as follows, and they illustrate the point just made —
TABLE IV —PERCENTAGE CHANGES IN THE THIRTY-TWO COUNTIES,
1926-36/7 1 2 3 4. 5 6 7 8 9. 10 11 12 13 14 15 16 17
Dubhn + 16 1 BELFAST C B + 5 6
DERRY C B ANTRIM Louth Wicklow DOWN Limerick DERRY Carlow Tipperary N Kildare Galway ARMAGH Waterford Wexford Offaly +4 0 +3 3 +2 5 + 15 +0 5 +0 5 +0 4
— 0 2 — 0 4 — 0 5 — 0 7 — 1 0 — 1 2
—1 8
— 2 5
18 19 20 21 22 23 24 25 26 27 28 29 30 31 32 33 34 35 Meath Cork Leix Kilkenny Tipperary S Westmeath TYRONE Longford Clare Shgo —2 5.
— 2 8 — 3 1 — 3 4 — 3 7 — 3 8 — 3 9 — 5 4 — 5 6 — 5 8
FERMANAGH—5 9 Monaghan Kerry Mayo Donegal Cavan Roscommon Leitnm
— 5 9
—6 3.
— 6 7 — 6 8 — 7 1
— 9 0
By James Meencm, MA, B L, Barnngton Lecturer 73
TABLE V—NUMBER OF MALES AND FEMALES IN POPULATION OF FREE STATE, SIX COUNTIES AND IRELAND, 1901-1937
1901
1911
1926
1936-7 1,
1,
1,
1, Free
M
610,085
589,509
506,889
518,807 State
F
1,611,738
1,550,179
1,465,103
1,447,047
Six
M
589,955
602,539
608,088
623,050 Counties
F .
646,997
647,992
648,473
656,127
Ireland
M
2,200,040
2,192,048
2,114,977
2,141,857 F
2,258,735
2,198,171
2,113,576
2,103,174
From this table it would seem that the excess of males m the popula-tion of the Free State has been sufficient to overbalance the excess of females in Northern Ireland In fact, the extent of that excess m Northern Ireland has shrunk since the 1926 Census In that year there were 40,385 more females than males in Northern Ireland , in 1937 that excess had fallen to 33,077
In the same way the ration of females per 1,000 males has fallen m both territories
TABLE VI—RATIO OF FEMALES PER 1,000 MALES AND NORTHERN IRELAND, 1901 TO 1937
FREE STATE
Free State Northern Ireland
1901 1911 1926 1936-7
1,001 975 972 953
1,097 1,075 1,066 1,053
The position of the Free State is, of course, abnormal even in com-parison with the newer countries overseas, but the fall in Northern Ireland is well marked In the latter area an increase is shown only m Belfast County Borough, and it is instructive to note that the sole increases shown in the Free State are in the County Boroughs of Dubhn, Cork, Limerick and Waterford and in the County of Dubhn Over the rest of the Six Counties the rates vary and curiously follow very nearly the same order as the change of population Derry County Borough has a ratio of 1,139 (surpassed m the whole country only by 1,290 in Dun Laogharre Borough) against the 1,125 of Belfast The other ratios are Antrim, 1,054 , Down, 1,053 , Armagh, 1,000 , County Derry, 979 , Tyrone, 942, and Fermanagh, 890 Even the latter figure is much in excess of the Free State counties with the lowest ratios Kildare, 810 , Leix, 847 , Offaly, 863 , and Leitrim, 864
In this respect it may be of some interest to compare the figures for Belfast and Dubhn (including Dun Laogharre) County Boroughs
74 Census of Population in Northern In eland
female increase of 12,725 This gives a total increase of 22,673 On the other hand the population of Dublin County Borough and County increased by 81,3461 Of this increase the Preliminary Report attributes
46,982 to the natural increase, and 34,364 to immigration It is notice-able that in this migration females predominate, their number being 21,914 against 12,450 males 2 In Belfast, on the other hand, it would
[image:6.397.53.355.193.319.2] [image:6.397.54.354.433.551.2]appear, that the tide must be flowing m theother direction, since the natural increase of the population during the decade would have resulted, if retained, m a greater expansion of population In the following table I have taken the natural increase for the years 1926 to 1935 from the published Eeports of the Registrar General for Northern Ireland, and have estimated the figure for 1936 on the average of the years 1931-35
TABLE VII —CENSUS POPULATION OF BELFAST IN 1926 AND AND NATURAL INCREASE 1926-36 (INCLUSIVE)
1936
Total Males Females
A—1926 Census
B —Estimated Natural Increase, 1926-36 C—Sum A + B
D.—Census 1937
E —Deficiency C—D (net emigration)
415,151 35,763 450,914 437,824 13,090
195,539 20,177 215,716 205,487 10,229
219,612 15,586 235,198 232,337 2,761
It is clear then that there must be some degree of migration from Belfast though not upon a scale to prevent, even if it diminishes, ex-pansion of population It is noticeable also that that migration appears to be much greater amongst the male than amongst the female popula-tion Such migrapopula-tion necessarily includes " migrapopula-tion " to the suburbs outside the city boundaries
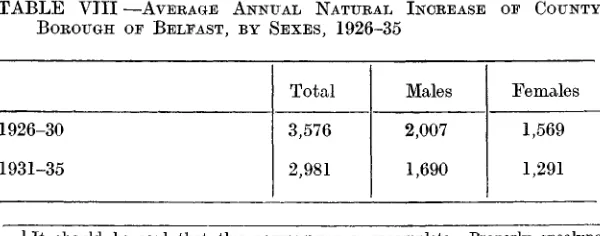
Lastly, it may be noted that the natural increase of the County Borough showed a marked diminution during the ten years between 1926 and 1935
TABLE VIII —AVERAGE ANNUAL NATURAL INCREASE OF COUNTY BOROUGH OF BELFAST, BY SEXES, 1926-35
1926-30
1931-35
Total
3,576
2,981
Males
2,007
1,690
Females
1,569
1,291
1 It should be said that this compansion is incomplete Properly speaking
certain areas around Belfast and in the Counties of Antrim and Down should be added
2 Net migration
3 It is probable that the figure thus found is lower than the actual figure
By James Meenan, MIA, B L, Bctrrington Lecturer 75
Lastly, we may turn to the statistics for the area as a whole While the population rose by 22,616 it fell far short of the level of the natural increase which m the period was 82,9121 The table bearing upon this
[image:7.406.43.345.126.228.2]matter will show the same characteristics as that dealing with Belfast
TABLE IX —CENSUS FIGURES OF NORTHERN IRELAND, 1926 AND 1937,
AND ESTIMATED NATURAL INCREASE 1926-36 (INCLUSIVE)
A—1926 Census
B —Estimated Natural Increase 1926-36 C—Sum A + B
D—Census 1937
E —Deficiency C—D (net emigiation)
Total
1,256,561 82,912 1,339,473 1,279,177 60,296
Males
608,088 48,053 656,141 623,050 33,091
Females
648,473 34,859 683,332 656,127 27,205
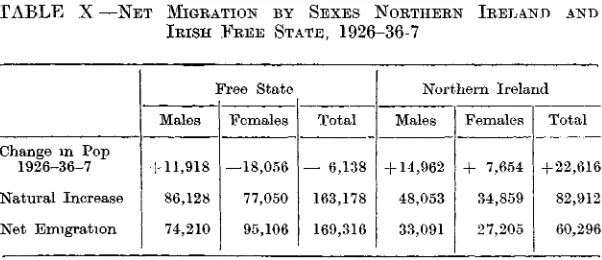
While, as has been said, these figures reproduce the tendencies already noticed m the returns for the County Borough of Belfast, they differ considerably from the returns for the Free State
TABLE X — N E T MIGRATION BY SEXES NORTHERN IRELAND AND
IRISH FREE STATE, 1926-36-7
Change m Pop 1926-36-7 Natural Increase Net Emigration
Free State
Males
+ 11,918 86,128
74,210
Females
—18,056
77,050 95,106
Total
— 6,138
163,178 169,316
Northern Ireland
Males
+ 14,962
48,053 33,091
Females
+ 7,654 34,859
27,205 Total
+ 22,616 82,912
60,296
Arising from this table are two points which deserve to be noticed First, that while the total rate of net emigration per annum was some-what greater m the Free State, the rate of male emigration was practically identical at 4 9 per thousand population per annum m the two areas Secondly, the Prehmmary Report of the 1936 Census estimated that during the decade 1926-36 there was a balance of emigration across the Border to the extent of 37,795 It would seem that this emigration passed through the Six Counties to other destinations unless indeed, and there appears to be little reason to suppose, the original inhabitants of the Six Counties are emigrating and leaving their place to immigrants from the South—a truly apocalyptic possibility One must await more detailed statistics before this matter can be fully cleared up In the meantime the information which we possess does not allow of further conclusions and we can only lepeat those points which have been already noted
1 Here I have been able to use to the Registrar-General's return for 1936. 2 The average annual natural increase in the Six County area also showed a
[image:7.406.45.346.274.404.2]76 Census of Population m Northern Ireland
1 That the population of all Ireland has shown an increase of 14,478, the first increase to be noted at any Census since 1841
2 That thi* increase is wholly due to an increase m the population of Northern Ireland
3 That Ulster continues to contain the largest population of any province
4 That the shift of population m the Six Counties follows the same hnes as that in the Free State, viz , the ubran areas show the greatest increase and the general movement is from west to east 5 That the ratio of females per 1,000 males has fallen m the Six
Counties as m the Free State
6 That there is evidence of a loss by migration from Belfast County Borough This migration is more marked among males than among females
7 That there is also a loss by migration from the Six Counties as a whole, and that this migration is also greater among males than among females In this respect the Six Counties differ from the Free State where females preponderate m emigration
77
DISCUSSION.
Mr. Lyon, proposing a vote of thanks, said Mr Meenan's paper was a worthy contribution to the records of the Society It did not leave much room for criticism, since the facts which had been given were not controvertible Mr Meenan referred to the " preliminary figures" of the Census , it might have been more correct to say they were his own preliminary figures, smce it was understood that the Preliminary Report itself would be published in July—that was to say, the advance figures These might be changed in the Preliminary Report, and changed again m the Final Report
Mr Meenan had said that, apart from a couple of Directories, there was no publication which gave the figures necessary for a study of the country as a whole That was the reason why it was to such bodies as the Statistical Society that one had to look for papers m which the official figures of other countries were brought together
Reference had been made to the date at which the Census m Northern Ireland had been taken In 1936 he (the speaker) had done his best to induce his vis-a-vis in Northern Ireland to have the Census m that part of the country taken at the same date as it was being taken m the Free State But other powers, superior to his, had decided other-wise
The Census taken m Northern Ireland with which Mr Meenan dealt had made no inquiries as to the occupation or mdustry of the people He believed they would not be able to get much more from it than a counting of heads by ages This would lead to the inference that the Census authorities in Northern Ireland were waiting to get into step with Great Britain and other countries m 1941
It was only with a great deal of reserve that the figures of the Free State Census of 1936 and that of Northern Ireland in 1937 should be compared In the case of Table I given by Mr Meenan, he doubted whether it was fair to compare Ulster and Lemster, or Munster and Connacht, when they represented different years and different economic conditions Except for these reservations with regard to compara-bility, he thought that the paper rested on incontrovertible facts
Professor Duncan, seconding the vote of thanks, said that the first point he would like to draw attention to was a purely arithmetical one in relation to Mr Meenan's statement on page 70 that " I t is the first census year smce 1841 in which an mcrease of population has been reported " It was possible that if they had the figures of the Free State at a date in 1937 corresponding with the date of the Northern Ireland Census there would not be an increase in population
From a general point of view, the most interesting thing the paper showed was the co-existence in one small area of two distinct population trends, and the clear differences that appeared under an apparent, or superficial, homogeneity The kind of area which was bemg denuded of population was not so important in Ulster as a whole as m the Free State There was nothing m Ulster comparable to the running sore of, say, Roscommon, Eastern Mayo and part of Leitrim and Cavan
78
than in the Free State The statistics did not give full weight to that urban increase m Northern Ireland largely because of the increases in population shown in Antrim and Down County Antrim showed an increase of 5,600, but the greater part of the actual mcrease was to be found in the suburbs of Belfast, while the county population had been decreasing For the purposes of demographic statistics, there was a great deal to be said for some kind of publication that would give the populations of the actual—and not merely the legal—cities In Dublin and Belfast the legal boundaries of the cities were practically meanmgless
One point of semi-political interest that he hoped would emerge from the present Census m Northern Ireland when the results came to be published was the question of birthplace A considerable section Of right-wing opinion in the North believed that there was a considerable migration of people from the Free State into Northern Ireland This migration to rural areas was, in the North, supposed to be of some considerable importance. A study of birthplaces would be of interest to confirm or deny this widely-held view
There had been a very marked change in the last thirty years in both the Free State and Northern Ireland m the sex ratio, and it might be worthy of the attention of some human biologist
Professor O'Brien said there were several pomts on the paper, and some off it, that he would like to speak about In connection with the last point raised by Professor Duncan, he thought it likely that the difference in sex ratios was the result of differential emigration A recent book on the national income of Great Britain had dealt with the problem of the future demand for the employment of labour Unless something unexpected happened, there was going to be a falling popula-tion m Great Britain, and one of the results of this would be an increase in the demand for female labour, and equalisation of wages If there was a great increase m the demand for female labour, and the present mobility prevailed, there would be a decrease m the female labour available in the Free State, and the sex ratios here would alter still more
The thing that struck him about the figures presented was not so much the unhkeness b'etween the two areas as their likeness The mam movements were the same—the movement to the urban areas and the movement from west to east The only difference was that the rate of depopulation of the rural areas m Northern Ireland was less than m the Free State As far as the South was concerned, the towns of Ireland were m the United States The mobility of the Irish was extreme, and, m the second half of the nineteenth century, was abnormal No popula-tion m the world had increased its standard of living so much in recent years as the population of Ireland That factor was going to play an important part in the future of Irish history If there had been a high degree of mobility fifty years ago, when transport expenses were high, the mobility now towards Great Britain was going to be much increased Between Great Britain and the Free State, owing to penal tariffs and high protection, a low degree of mobility of capital was found, but at the same time complete mobility of factors of production—an excep-tional circumstance of internaexcep-tional trade Real wages were lower m Ireland, too, on account of the high cost of living, and that led to a considerable drift to Great Britain m response to the demand for labour
79
might be a decrease, too, m the nett reproduction rate, which, if a sufficiently large number of Irishwomen went away, must go down cumulatively
The economic results of this decrease must be serious, smce schools, houses, roads and factories were bemg built on the assumption that the population would, at any rate, not decrease Unless something unforeseen occurred—an increase in the English birthrate or a diminution m the demand for labour (and there was no sign of either)—-then, failing a phenomenal increase in the birthrate here, Ireland was doomed to a falling population This was the central and outstanding fact of public life, and it was a fact that nobody took any interest in The whole of Ireland was suffering m the same way,
Dr. Jacobsson said that Professor Duncan had pomted out with regard to Table 2 that there had been for a number of years a difference between the populations of Northern Ireland and the Free State, and had given the explanation that the northern area contains relatively less of the rural area in which the declme in population had taken place He thought the industrial character of Belfast was another explanation Where, as in Belfast, there was an export industry, an expanding popula-tion could be expected
With regard to Table 4, it might be natural to ask whether the economic war with Great Britain might not have had some influence on the difference m population movements m the North and South All employ-ment depended on a correct relation between cost and price In the South, in the second half of 1932, the relation between imports and exports was 20% to the disadvantage of exports The immediate effect of the economic war was that export prices went down in relation to import prices The same thing had happened in agriculture where there was a fall in prices and no fall in wages With all the new industries set up in the Free State and the increased opportunities for employment, an expanding population might be expected Yet there was a decrease. In the North, in spite of the distress in shipbuilding, the tendency was the opposite, and he wondered whether the explanation, this agricultural country, was not the economic war
Mr. Geary said he did not agree with Dr Jacobsson that the difference in the trends between the two areas was so very marked The increase m the population m the North was extremely small The decrease m population in the Free State was small, and a very minor error in the enumeration would easily turn the figure into a plus He gave due regard to what Professor Duncan had said about the possibility that if an enumeration had been taken in the middle of 1937 the population of the Free State might be 10,000 less, but still thought that the essential changes were small, and that the trends, North and South—including emigration—were very similar
80
Professor O'Brien asked whether the social services m Northern Ireland were higher than in the Free State If they were, they might prove to be the differential
Mr. Geary said that the rates of unemployment assistance were lower in the South than in the North , national health insurance was about the same On Dr Jacobsson's point, he should say that he was not thinking only of the last intercensal decade The trends m Northern Ireland and in the province of Leinster, were rather similar, as might be expected In essence the aggregate population changes had been small; in the South there had been a greater increase in urbanisation and a greater decrease in the agricultural population That was logical, given the economic policies of the two areas The internal economic factor, however, was not the only one to be considered, and over-riding was the pull of the population, both North and South, to England
The President, conveying the vote of thanks to Mr Meenan, said that he would like to ask whether anything was known of the fluctuation m the figures of the military population in Ireland The personnel of the British Army located m Ireland at different dates might be a factor havmg some bearing on the figures they had been discussing It would affect, for mstance, the proportion of males to females Table 10 seemed to confirm what Professor O'Brien had said to the effect that emigration figures were probably a strong influence m producing the disproportion of males and females
An interesting point that emerged from the discussion was that m considering the probabilities of the future, they must follow not merely what was happening within the boundaries of the Free State, but also-what was happening in areas likely to affect the movement of our population
Mr. Meenan, returning thanks, stressed the fact that the figures were merely preliminary, and it was for that reason that he had been unable to give a satisfactory figure for Belfast The increases m Antrim and Down were undoubtedly due to the increase in Belfast County Borough. It would be of great interest to see what the exact figures of migration to the Six Counties were The figures as worked out showed a loss by emigration from the Six Counties, but they must await what the official figures would reveal
So far as rural affairs were concerned, the last five years had been dominated by the economic war, and they must wait until this was settled, and normal conditions restored, before it could be said whether the rural population was going to maintain itself