Author Age Prediction from Text using Linear Regression
Dong Nguyen Noah A. Smith Carolyn P. Ros´e
Language Technologies Institute Carnegie Mellon University Pittsburgh, PA 15213, USA
{dongn,nasmith,cprose}@cs.cmu.edu
Abstract
While the study of the connection between discourse patterns and personal identification is decades old, the study of these patterns us-ing language technologies is relatively recent. In that more recent tradition we frame author age prediction from text as a regression prob-lem. We explore the same task using three very different genres of data simultaneously: blogs, telephone conversations, and online fo-rum posts. We employ a technique from do-main adaptation that allows us to train a joint model involving all three corpora together as well as separately and analyze differences in predictive features across joint and corpus-specific aspects of the model. Effective fea-tures include both stylistic ones (such as POS patterns) as well as content oriented ones. Us-ing a linear regression model based on shallow text features, we obtain correlations up to 0.74 and mean absolute errors between 4.1 and 6.8 years.
1 Introduction
A major thrust of research in sociolinguistics is to understand the connection between the way peo-ple use language and their community membership, where community membership can be construed along a variety of dimensions, including age, gen-der, socioeconomic status and political affiliation. A person is a member of a multiplicity of communi-ties, and thus the person’s identity and language are influenced by many factors.
In this paper we focus on the relationship between age and language use. Recently, machine learning
methods have been applied to determine the age of persons based on the language that they utter. Stud-ies of the stylistic and content-based features that predict age or other personal characteristics yield new insights into the connection between discourse and identity. However, that connection is known to be highly contextual, such as whether the data were collected synchronously or asynchronously, through typed or spoken interaction, or whether participants can see one another or not. Recent work in the area of domain adaptation raises awareness about the ef-fect of contextual factors on the generality of text prediction models.
Our first contribution to this literature is an in-vestigation of age prediction using a multi-corpus approach. We present results and analysis across three very different corpora: a blog corpus (Schler et al., 2006), a transcribed telephone speech corpus (Cieri et al., 2004) and posts from an online forum on breast cancer. By using the domain adaptation approach of Daum´e III (2007), we train a model on all these corpora together and separate the global features from corpus-specific features that are asso-ciated with age.
A second contribution is the investigation of age prediction with age modeled as a continuous vari-able rather than as a categorical varivari-able. Most prior research on age prediction has framed this as a two-class or three-class classification problem (e.g., Schler et al., 2006 and Garera and Yarowsky, 2009). In our work, modeling age as a continuous variable is interesting not only as a more realistic representa-tion of age, but also for practical benefits of joint modeling of age across corpora since the
aries for discretizing age into a categorical variable in prior work have been chosen heuristically and in a corpus-dependent way, making it hard to compare performance across different kinds of data.
In the remainder of the paper, we first discuss re-lated work and present and compare the different datasets. We then outline our approach and results. We conclude with discussion and future work.
2 Related work
Time is an important factor in sociolinguistic analy-sis of language variation. While a thorough review of this work is beyond the scope of this paper, Eckert (1996) gives an overview of the literature on age as a sociolinguistic variable. Linguistic variation can occur as an individual moves through life, or as a re-sult of changes in the community itself as it moves through time. As an added complexity, Argamon et al. (2007) found connections between language vari-ation and age and gender. Features that were used with increasing age were also used more by males for any age. Features that were used with decreas-ing age were used more by females. In other work, the same features that distinguish male and female writing also distinguish non-fiction and fiction (Arg-amon et al., 2003). Thus, the separate effects of age, time period, gender, topic, and genre may be diffi-cult to tease apart in naturalistic data where many of these variables are unknown.
Recently, machine learning approaches have been explored to estimate the age of an author or speaker using text uttered or written by the person. This has been modeled as a classification problem, in a similar spirit to sociolinguistic work where age has been investigated in terms of differences in distri-butions of characteristics between cohorts. In the sociolinguistic literature, cohorts such as these are determined either etically (arbitrary, but equal age spans such as decades) or emically (related to life stage, such as adolescence etc.). In machine learn-ing research, these cohorts have typically been deter-mined for practical reasons relating to distribution of age groups within a corpus, although the boundaries sometimes have also made sense from a life stage perspective. For example, researchers have mod-eled age as a two-class classification problem with boundaries at age 40 (Garera and Yarowsky, 2009)
or 30 (Rao et al., 2010). Another line of work has looked at modeling age estimation as a three-class classification problem (Schler et al., 2006; Goswami et al., 2009), with age groups of 13-17, 23-27 and 33-42. In addition to machine learning experiments, other researchers have published statistical analyses of differences in distribution related to age and lan-guage and have found similar patterns.
As an example of one of these studies, Pen-nebaker and Stone (2003) analyzed the relationship between language use and aging by collecting data from a large number of previous studies. They used LIWC (Pennebaker et al., 2001) for analysis. They found that with increasing age, people tend to use more positive and fewer negative affect words, more future-tense and less past-tense, and fewer self-references. Furthermore, a general pattern of increasing cognitive complexity was seen. Barbieri (2008) uses key word analysis to analyze language and age. Two groups (15–25 and 35–60) were com-pared. Analysis showed that younger speakers’ talk is characterized by slang and swear words, indica-tors of speaker stance and emotional involvement, while older people tend to use more modals.
Age classification experiments have been con-ducted on a wide range of types of data, in-cluding blogs (Schler et al., 2006; Goswami et al., 2009), telephone conversations (Garera and Yarowsky, 2009), and recently Twitter (Rao et al., 2010). Effective features were both content fea-tures (such as unigrams, bigrams and word classes) as well as stylistic features (such as part-of-speech, slang words and average sentence length). These separate published studies present some common-alities of findings. However, based on these re-sults from experiments conducted on very different datasets, it is not possible to determine how gener-alizable the models are. Thus, there is a need for an investigation of generalizability specifically in the modeling of linguistic variation related to age, which we present in this paper.
clas-sification. As far as we are aware, we are the first to publish results from a regression model that directly predicts age using textual features.
3 Data description
We explore three datasets with different characteris-tics. The data was divided into a training, develop-ment and test set. Statistics are listed in Table 1.
3.1 Blog corpus
In August 2004 Schler et al. (2006) crawled blogs from blogger.com. Information such as gen-der and age were provided by the users in their re-spective profiles. Users were divided into three age groups, and each group had an equal number of fe-male and fe-male bloggers. In our experiments, ev-ery document consists of all posts from a particular blogger.
3.2 Fisher telephone corpus
The Fisher corpus (Cieri et al., 2004) contains tscripts of telephone conversations. People were ran-domly assigned to pairs, and for (almost) every per-son, characteristics such as gender and age were recorded. Furthermore, for each conversation a topic was assigned. The data was collected beginning De-cember 2002 and continued for nearly one year. In our experiments, we aggregate the data for each per-son.
3.3 Breast cancer forum
We drew data from one of the most active online fo-rums for persons with breast cancer.1 All posts and user profiles of the forum were crawled in January 2011. Only a small proportion of users had indicated their age in their profile. We manually annotated the age of approximately 200 additional users with less common ages by looking manually at their posts. An author’s age can often be annotated because users tend to make references to their age when they intro-duce themselves or when telling their treatment his-tory (e.g., I was diagnosed 2 years ago when I was just 38). Combining this with the date of the specific post, a birth year can be estimated. Because a per-son’s data can span multiple years, we aggregate all the data per year for each person. Each person was
[image:3.612.321.543.81.251.2]1http://community.breastcancer.org
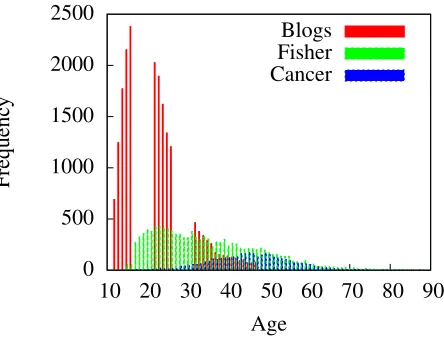
Figure 1: Comparison of age frequency in datasets.
0 500 1000 1500 2000 2500
10 20 30 40 50 60 70 80 90
Frequenc
y
Age Blogs Fisher Cancer
assigned randomly to one of the data splits, to make sure all documents representing the same person ap-peared in only one split. The dataset contains posts from October 2002 until January 2011.
3.4 Dataset comparison and statistics
The datasets differ in several respects: specificity (general topics versus breast cancer), modality of in-teraction (telephone conversations versus online fo-rum versus blog post), age distribution, and amount of data per person. The blog and Fisher dataset con-tain approximately equal amounts of males and fe-males, while the breast cancer dataset is heavily bi-ased towards women.
A comparison of the age distributions of the three corpora is given in Figure 1. The Fisher dataset has the most uniform distribution across the ages, while the blog data has a lot of young persons and the breast cancer forum has a lot of older people. The youngest person in our dataset is 13 years old and the oldest is 88. Note that our blog corpus con-tains gaps between different age categories, which is an artifact of the experimental approach used by the people who released this dataset (Schler et al., 2006).
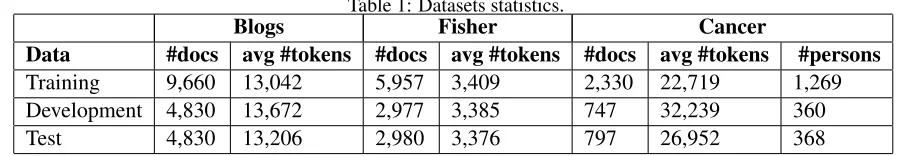
Table 1: Datasets statistics.
Blogs Fisher Cancer
Data #docs avg #tokens #docs avg #tokens #docs avg #tokens #persons
Training 9,660 13,042 5,957 3,409 2,330 22,719 1,269 Development 4,830 13,672 2,977 3,385 747 32,239 360 Test 4,830 13,206 2,980 3,376 797 26,952 368
4 Experimental setup
4.1 Linear regression
Given an input vectorx ∈ Rm, where x1, . . . , xm
represent features (also called independent variables or predictors), we find a predictionyˆ∈Rfor the age of a persony ∈ Rusing a linear regression model:
ˆ
y = β0 +x>β where β0 and β are the parame-ters to estimate. Usually, the parameparame-ters are learned by minimizing the sum of squared errors. In order to strive for a model with high explanatory value, we use a linear regression model with Lasso (also called L1) regularization (Tibshirani, 1996). This
minimizes the sum of squared errors, but in addition adds a penalty termλPm
j=1|βj|.λis a constant and
can be found by optimizing over the development data. As a result, this method delivers sparse mod-els. We use OWLQN to optimize the regularized empirical risk (Andrew and Gao, 2007; Gao et al., 2007). We evaluate the models by reporting the cor-relation and mean absolute error (MAE).
4.2 Joint model
To discover which features are important across datasets and which are corpus-specific, we train a model on the data of all corpora using the feature representation proposed by Daum´e III (2007). Using this model, the original feature space is augmented by representing each individual feature as 4 new tures: a global feature and three corpus-specific fea-tures, specifically one for each dataset. Thus for ev-ery featuref, we now havefglobal, fblogs, ffisher and
fcancer. For every instance, only the global and the
one specific corpus feature are set. For example for a particular feature valuexj for the blog dataset we
would have hxj, xj,0,0i. If it would appear in the
cancer dataset we would havehxj,0,0, xji. Because
the resulting model usingL1regression only selects
a small subset of the features, some features may only appear either as global features or as
corpus-specific features in the final model.
4.3 Overview different models
Besides experimenting with the joint model, we are also interested in the performance using only the dis-covered global features. This can be achieved by ap-plying the weights for the global features directly as learned by the joint model, or retraining the model on the individual datasets using only the global fea-tures. In summary, we have the following models:
• INDIV: Models trained on the three corpora in-dividually.
• JOINT: Model trained on all three corpora with features represented as in Daum´e III (2007).
• JOINT-Global: Using the learned JOINT model but only keeping the global features.
• JOINT-Global-Retrained: Using the discov-ered global features by the JOINT model, but
retrainedon each specific dataset.
4.4 Features
4.4.1 Textual features
We explore the following textual features; all fea-tures are frequency counts normalized by the length (number of tokens) of the document.
• Unigrams.
• POS unigramsandbigrams. Text is tagged us-ing the Stanford POS tagger (Toutanova et al., 2003).
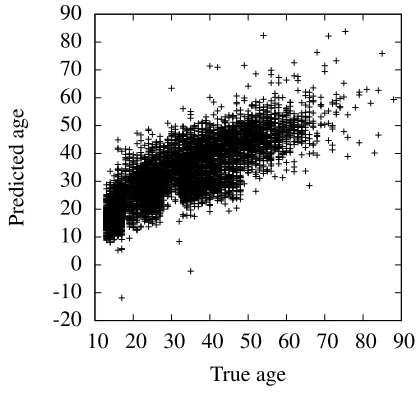
Figure 2: Scatterplot of true and predicted age.
-20 -10 0 10 20 30 40 50 60 70 80 90
10 20 30 40 50 60 70 80 90
Predicted
age
True age
4.4.2 Gender
Because the gender of a person also influences how age is reflected in a person’s text or speech (e.g. Argamon et al. (2007) ), we add a binary feature for the gender of the person (Male = 1, Female = 0). This feature is only known for the blog and Fisher dataset. For the breast cancer dataset the gender is not known, but we assume they are all women.
5 Results and discussion
As discussed, we experiment with four different models. We explore three different feature sets: only unigrams, only POS, and the full feature set. The re-sults are presented in Table 2. The most important features using the JOINT model with the full feature set (condition 10) are presented in Table 3.
5.1 Quantitative analysis
Overall, similar performance is obtained on the Fisher and blog datasets. The highest correlations were achieved on the Fisher dataset, with a best cor-relation of r = 0.742. This gives an r2 value of 0.551, indicating that 55% of the variance can be explained by the model. However, a higher mean absolute error (MAE) was observed compared to the blog dataset. This may be caused by the larger spread in distribution of ages in the Fisher dataset. The lowest correlations were observed on the cancer dataset. This is probably caused by the small amount
of training instances, the noisy text, and the fact that the ages lie very close to each other.
Overall, the joint model using all features per-formed best (condition 10). In Figure 2 a plot is presented that relates the true and predicted ages for this condition. We find that for the high ages there are more instances with high errors, probably caused by the small amount of training data for the extreme ages.
We find the correlation metric to be very sensitive to the amount of data. For example, when comput-ing the correlation over the aggregated results of all corpora, we get a much higher correlation (0.830), but the MAE (5.345) is closer to that computed over the individual datasets. However, the MAE is de-pendent on the age distributions in the corpus, which can be observed by contrasting the MAE on the runs of the Fisher and cancer dataset. This thus suggests that these two measures are complementary and both are useful as evaluation metrics for this task.
For most experiments the joint models show im-provement over the individual models. Returning to our question of generality, we can make several observations. First, performance decreases signif-icantly when only using the global features (com-paring JOINT and JOINT-Global-retrained), con-firming that corpus-specific features are important. Second, learned weights of global features are rea-sonably generalizable. When using the full feature set, retraining the global features on the corpora di-rectly only gives a slight improvement (e.g. com-pare conditions 11 and 12). Third, the bias term (β0) is very corpus-specific and has a big influence
on the MAE. For example, when comparing condi-tions 11 and 12, the correlacondi-tions are very similar but the MAEs are much lower when the model is re-trained. This is a result of adjusting the bias term to the specific dataset. For example the bias term of the model trained on only the blog dataset is 22.45, compared to the bias of 46.11 when trained on the cancer dataset.
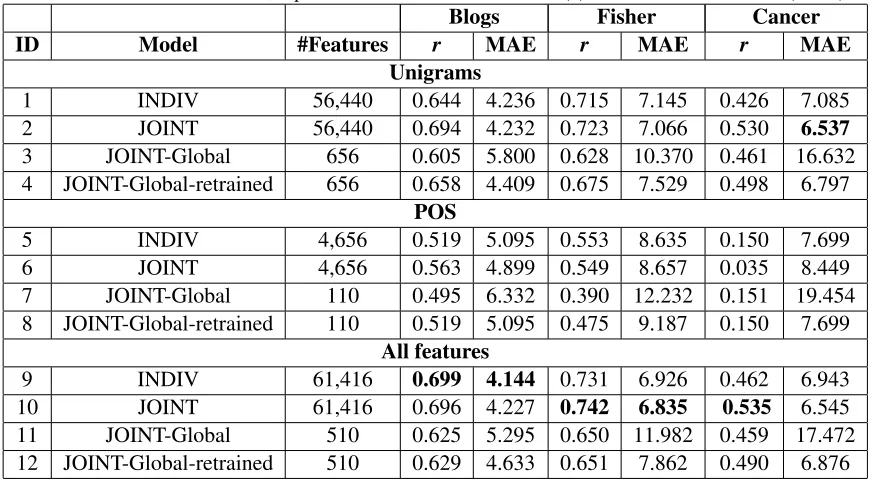
Table 2: Results on the test set, reported with Pearson’s correlation (r) and mean absolute error (MAE).
Blogs Fisher Cancer
ID Model #Features r MAE r MAE r MAE
Unigrams
1 INDIV 56,440 0.644 4.236 0.715 7.145 0.426 7.085 2 JOINT 56,440 0.694 4.232 0.723 7.066 0.530 6.537
3 JOINT-Global 656 0.605 5.800 0.628 10.370 0.461 16.632 4 JOINT-Global-retrained 656 0.658 4.409 0.675 7.529 0.498 6.797
POS
5 INDIV 4,656 0.519 5.095 0.553 8.635 0.150 7.699 6 JOINT 4,656 0.563 4.899 0.549 8.657 0.035 8.449 7 JOINT-Global 110 0.495 6.332 0.390 12.232 0.151 19.454 8 JOINT-Global-retrained 110 0.519 5.095 0.475 9.187 0.150 7.699
All features
9 INDIV 61,416 0.699 4.144 0.731 6.926 0.462 6.943 10 JOINT 61,416 0.696 4.227 0.742 6.835 0.535 6.545 11 JOINT-Global 510 0.625 5.295 0.650 11.982 0.459 17.472 12 JOINT-Global-retrained 510 0.629 4.633 0.651 7.862 0.490 6.876
5.2 Feature analysis
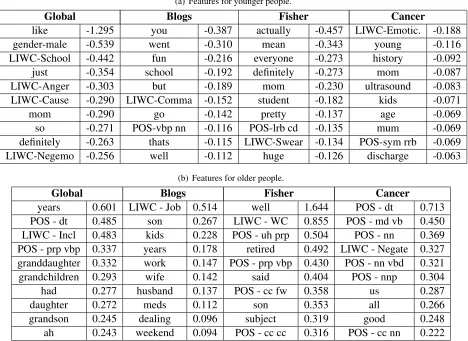
The most important features using the JOINT model with the full feature set (condition 10) are presented in Table 3. Features associated with a young age have a negative weight, while features associated with old age have a positive weight. For almost all runs and evaluation metrics the full feature set gives the best performance. However, looking at the per-formance increase, we observe that the unigram only baseline gives strong results. Overall, both stylistic as well as content features are important. For con-tent features, we see that references to family (e.g., “granddaughter” versus “son”) as well as to daily life (e.g., “school” versus “job”) are very predictive. Although the performance using only POS tags is lower, reasonable correlations are obtained using only POS tags. In Table 3 we see many POS features associated with old age. This is confirmed when an-alyzing the whole feature set selected by the JOINT model (condition 10). In this model 510 features are nonzero, 161 of which are POS patterns. Of these, 43 have a negative weight, and 118 have a positive weight. This thus again suggests that old age is char-acterized more by syntactic effects than young age.
Most important features are consistent with obser-vations from previous research. For example, in the Fisher dataset, similar to findings from classification
experiments by Garera and Yarowsky (2009), the word “well” is most predictive of older age. “Like” has the highest association with younger age. This agrees with observations by Barbieri (2008). As was also observed by others, “just” is highly associ-ated with young persons. Consistent with literature that males generally “sound older” than they truly are (Argamon et al., 2007, and others), our male speaker feature has a high negative weight. And, in agreement with previous observations, younger peo-ple use more swear words and negative emotions.
The differences between the corpora are reflected in the features that have the most weight. The effec-tive features in the Fisher dataset are more typical of conversational settings and effective features in the cancer dataset are about being pregnant and hav-ing kids. Features associated with the blog dataset are typical of the story telling nature of many blog posts.
Table 3: Most important features in the JOINT model with all features (condition 10).
(a) Features for younger people.
Global Blogs Fisher Cancer
like -1.295 you -0.387 actually -0.457 LIWC-Emotic. -0.188 gender-male -0.539 went -0.310 mean -0.343 young -0.116 LIWC-School -0.442 fun -0.216 everyone -0.273 history -0.092 just -0.354 school -0.192 definitely -0.273 mom -0.087 LIWC-Anger -0.303 but -0.189 mom -0.230 ultrasound -0.083 LIWC-Cause -0.290 LIWC-Comma -0.152 student -0.182 kids -0.071 mom -0.290 go -0.142 pretty -0.137 age -0.069 so -0.271 POS-vbp nn -0.116 POS-lrb cd -0.135 mum -0.069 definitely -0.263 thats -0.115 LIWC-Swear -0.134 POS-sym rrb -0.069 LIWC-Negemo -0.256 well -0.112 huge -0.126 discharge -0.063
(b) Features for older people.
Global Blogs Fisher Cancer
years 0.601 LIWC - Job 0.514 well 1.644 POS - dt 0.713 POS - dt 0.485 son 0.267 LIWC - WC 0.855 POS - md vb 0.450 LIWC - Incl 0.483 kids 0.228 POS - uh prp 0.504 POS - nn 0.369 POS - prp vbp 0.337 years 0.178 retired 0.492 LIWC - Negate 0.327 granddaughter 0.332 work 0.147 POS - prp vbp 0.430 POS - nn vbd 0.321 grandchildren 0.293 wife 0.142 said 0.404 POS - nnp 0.304 had 0.277 husband 0.137 POS - cc fw 0.358 us 0.287 daughter 0.272 meds 0.112 son 0.353 all 0.266 grandson 0.245 dealing 0.096 subject 0.319 good 0.248 ah 0.243 weekend 0.094 POS - cc cc 0.316 POS - cc nn 0.222
mom, mum, really,LIWC - Family,LIWC - Humans, thank, and she. The difference in age distribution is reflected in the feature weights. In the JOINT model, the bias term is 24.866. Because most of the persons in the cancer dataset are older, the features associ-ated with young age in the cancer dataset have much lower weights compared to the other datasets.
Because our goal is to compare features across the corpora, we have not exploited corpus-specific features. For example, thread or subforum features could be used for the breast cancer corpus, and for the Fisher dataset, one could add features that ex-ploit the conversational setting of the data.
5.3 Examples
We present examples of text of younger and older persons and connect them to the learned model. The examples are manually selected to illustrate strengths and weaknesses of the model.
5.3.1 Younger people
We first present some examples of text by young persons. The following is an example of a 17-year old in the blog dataset, the system predicted this to be from a 16.48-year-old:
I can’t sleep, but this time I have school tommorow, so I have to try I guess. My parents got all pissed at me today because I forgot how to do the homework [...]. Re-ally mad, I ended it pissing off my mom and [...] NOTHING! Damn, when I’m at my cousin’s I have no urge to use the com-puter like I do here, [...].
The following are selected turns (T) by a 19-year old (system prediction: 17.37 years) in a conversa-tion in the Fisher dataset.
T: yeah it’s too i just just freaked out [...] T: that kinda sucks for them
T: they were they were like going crazy [...]
T: it’s like against some law to like
The text has many informal words such as “kinda” and well as many occurrences of the word “like.”
This example is from a 19-year old from the can-cer dataset. The system’s prediction was far off, es-timating an age of 35.48.
Im very young and an athlete and I really do not want to look disfigured, especially when I work so hard to be fit. I know it sounds shallow, but Im young and hope to [...] my husband one day :) [...] My grandmother died of breast cancer at 51, and my mother is currently dealing with a cancerous tumor on her ovaries.
Besides explicit references to being “very young,” the text is much more formal than typical texts, mak-ing it a hard example.
5.3.2 Older people
The following is a snippet from a 47-year-old (system prediction: 34.42 years) in the blog dataset.
[...]In the weeks leading up to this meet-ing certain of the managers repeatedly as-serted strong positions. [...] their previous (irresponsible yet non-negotiable) opin-ions[...] Well, today’s my first Father’s day [...]. Bringing a child into this world is quite a responsibility especially with all the fears and challenges we face. [...]
This matches some important features such as ref-erences to jobs, as well as having kids. The many references to the word “father” in the whole text might have confused the model. The following are selected turns (T) by a 73-year old (system predic-tion: 73.26 years) in a conversation in the Fisher dataset.
T: ah thoughts i’m retired right now T: i i really can’t ah think of anyth- think of i would ah ah change considerably ah i’m i’m very i’ve been very happily mar-ried and i have ah three children and six grandchildren
T: yeah that’s right well i i think i would do things more differently fair- fairly recently than a long time ago
This example contains references to being retired and having grandchildren, as well as many usages of “ah”. The following is an example of a 70-year old (system prediction: 71.53 years) in the cancer dataset.
[...] I was a little bit fearful of having surgery on both sides at once (reduction and lift on the right, tissue expander on the left) [...] On the good side, my son and family live near the plastic surgeon’s office and the hospital, [...], at least from my son and my granddaughter [...]
6 Conclusion
We presented linear regression experiments to pre-dict the age of a text’s author. As evaluation metrics, we found correlation as well as mean absolute er-ror to be complementary and useful measures. We obtained correlations up to 0.74 and mean absolute errors between 4.1 and 6.8 years. In three different corpora, we found both content features and stylis-tic features to be strong indicators of a person’s age. Even a unigram only baseline already gives strong performance and many POS patterns are strong in-dicators of old age. By learning jointly from all of the corpora, we were able to separate generally ef-fective features from corpus-dependent ones.
Acknowledgments
References
Galen Andrew and Jianfeng Gao. 2007. Scalable train-ing of l1-regularized log-linear models. In Proc. of ICML.
Shlomo Argamon, Moshe Koppel, Jonathan Fine, and Anat R. Shimoni. 2003. Gender, genre, and writing style in formal written texts.Text, 23(3):321–346. Shlomo Argamon, Moshe Koppel, James Pennebaker,
and Jonathan Schler. 2007. Mining the blogosphere: age, gender, and the varieties of self-expression. Federica Barbieri. 2008. Patterns of age-based linguistic
variation in American English. Journal of Sociolin-guistics, 12(1):58–88.
Christopher Cieri, David Miller, and Kevin Walker. 2004. The Fisher corpus: a resource for the next gen-erations of speech-to-text. In Proc. of LREC, pages 69–71.
Hal Daum´e III. 2007. Frustratingly easy domain adapta-tion. InProc. of ACL.
Penelope Eckert. 1996. Age as a sociolinguistic variable. InThe Handbook of Sociolinguistics. Oxford: Black-well.
Jianfeng Gao, Galen Andrew, Mark Johnson, and Kristina Toutanova. 2007. A comparative study of pa-rameter estimation methods for statistical natural lan-guage processing. InProc. of ACL.
Nikesh Garera and David Yarowsky. 2009. Modeling la-tent biographic attributes in conversational genres. In
Proc. of ACL-IJCNLP.
Sumit Goswami, Sudeshna Sarkar, and Mayur Rustagi. 2009. Stylometric analysis of bloggers’ age and gen-der. InProc. of ICWSM.
James W. Pennebaker and Lori D. Stone. 2003. Words of wisdom: Language use over the lifespan. Journal of Personality and Social Psychology, 85:291–301. James W. Pennebaker, Roger J. Booth, and Martha E.
Francis, 2001. Linguistic Inquiry and Word Count (LIWC): A Computerized Text Analysis Program. Delip Rao, David Yarowsky, Abhishek Shreevats, and
Manaswi Gupta. 2010. Classifying latent user at-tributes in Twitter. InProc. of SMUC.
Jonathan Schler, Moshe Koppel, Shlomo Argamon, and James Pennebaker. 2006. Effects of age and gender on blogging. InProceedings of the AAAI Spring Sym-posia on Computational Approaches to Analyzing We-blogs.
Werner Spiegl, Georg Stemmer, Eva Lasarcyk, Varada Kolhatkar, Andrew Cassidy, Blaise Potard, Stephen Shum, Young Chol Song, Puyang Xu, Peter Beyer-lein, James Harnsberger, and Elmar N¨oth. 2009. Ana-lyzing features for automatic age estimation on cross-sectional data. InProc. of INTERSPEECH.
Robert Tibshirani. 1996. Regression shrinkage and se-lection via the lasso. Journal of the Royal Statistical Society Series B (Methodological), 58(1):267–288. Kristina Toutanova, Dan Klein, Christopher D. Manning,
and Yoram Singer. 2003. Feature-rich part-of-speech tagging with a cyclic dependency network. InProc. of NAACL-HLT.