University of Kentucky University of Kentucky
UKnowledge
UKnowledge
Theses and Dissertations--Business
Administration Business Administration
2015
MODELING LARGE-SCALE CROSS EFFECT IN CO-PURCHASE
MODELING LARGE-SCALE CROSS EFFECT IN CO-PURCHASE
INCIDENCE: COMPARING ARTIFICIAL NEURAL NETWORK
INCIDENCE: COMPARING ARTIFICIAL NEURAL NETWORK
TECHNIQUES AND MULTIVARIATE PROBIT MODELING
TECHNIQUES AND MULTIVARIATE PROBIT MODELING
Zhiguo Yang
University of Kentucky, [email protected]
Right click to open a feedback form in a new tab to let us know how this document benefits you. Right click to open a feedback form in a new tab to let us know how this document benefits you.
Recommended Citation Recommended Citation
Yang, Zhiguo, "MODELING LARGE-SCALE CROSS EFFECT IN CO-PURCHASE INCIDENCE: COMPARING ARTIFICIAL NEURAL NETWORK TECHNIQUES AND MULTIVARIATE PROBIT MODELING" (2015). Theses and Dissertations--Business Administration. 6.
https://uknowledge.uky.edu/busadmin_etds/6
This Doctoral Dissertation is brought to you for free and open access by the Business Administration at UKnowledge. It has been accepted for inclusion in Theses and Dissertations--Business Administration by an authorized
STUDENT AGREEMENT: STUDENT AGREEMENT:
I represent that my thesis or dissertation and abstract are my original work. Proper attribution has been given to all outside sources. I understand that I am solely responsible for obtaining any needed copyright permissions. I have obtained needed written permission statement(s) from the owner(s) of each third-party copyrighted matter to be included in my work, allowing electronic distribution (if such use is not permitted by the fair use doctrine) which will be submitted to UKnowledge as Additional File.
I hereby grant to The University of Kentucky and its agents the irrevocable, non-exclusive, and royalty-free license to archive and make accessible my work in whole or in part in all forms of media, now or hereafter known. I agree that the document mentioned above may be made available immediately for worldwide access unless an embargo applies.
I retain all other ownership rights to the copyright of my work. I also retain the right to use in future works (such as articles or books) all or part of my work. I understand that I am free to register the copyright to my work.
REVIEW, APPROVAL AND ACCEPTANCE REVIEW, APPROVAL AND ACCEPTANCE
The document mentioned above has been reviewed and accepted by the student’s advisor, on behalf of the advisory committee, and by the Director of Graduate Studies (DGS), on behalf of the program; we verify that this is the final, approved version of the student’s thesis including all changes required by the advisory committee. The undersigned agree to abide by the statements above.
MODELING LARGE-SCALE CROSS EFFECT IN CO-PURCHASE INCIDENCE: COMPARING ARTIFICIAL NEURAL NETWORK TECHNIQUES AND
MULTIVARIATE PROBIT MODELING
DISSERTATION
A dissertation submitted in partial fulfillment of the
requirements for the degree of Doctor of Philosophy in the
College of Business and Economics
at the University of Kentucky
By
Zhiguo Yang
Lexington, Kentucky
Co-Directors: Dr. Devanathan Sudharshan, James and Diane Stuckert BS/MBA Endowed Chair and Professor of Marketing
and : Dr. Clyde Holsapple, Rosenthal Endowed Chair and Professor in Management Information Systems
Lexington, Kentucky
2015
ABSTRACT OF DISSERTATION
MODELING LARGE-SCALE CROSS EFFECT IN CO-PURCHASE INCIDENCE: COMPARING ARTIFICIAL NEURAL NETWORK TECHNIQUES
AND MULTIVARIATE PROBIT MODELING
discussion of conclusions and limitations, the dissertation concludes with a discussion of open questions for future research.
KEYWORDS: Cross category, Co-purchase, Large scale analysis, Multivariate probit model, Artificial neural network.
Zhiguo Yang g
Student’s signature e
11/19/2015 g
MODELING LARGE-SCALE CROSS EFFECT IN CO-PURCHASE INCIDENCE: COMPARING ARTIFICIAL NEURAL NETWORK TECHNIQUES
AND MULTIVARIATE PROBIT MODELING
By
Zhiguo Yang
Dr. Devanathan Sudharshan n Co-Director of Dissertation
Dr. Clyde Holsapple e Co-Director of Dissertation
Dr. Kenneth R. Troske e Director of Graduate Studies
Dedicated to my parents, Chunxia Yang and Jingfan Yang, who brought me to this world,
iii
ACKNOWLEDGMENTS
I am forever indebted to my dissertation co-chairs. Without Dr. D Sudharshan’s support and guidance, this dissertation development would not be
possible. His expertise, sharp and critical-thinking mind, and endless passion in
doing research not only inspired me in developing this dissertation, but also will
keep inspiring me for the rest of my academic life. Dr. Clyde Holsapple has been
mentoring me since day-one of my PhD training. He is always encouraging, patient
and caring. His guidance ensured the dissertation development being on the right
track. PhD training is a life changing journey for me and working with Dr. D
Sudharshan and Dr. Clyde Holsapple is a critical procedure making that change
happened.
I would like to thank the dissertation committee and examiner, respectively:
Dr. Anita Lee-Post, Dr. Adib Bagh, Dr. Judy Goldsmith, and Dr. Yoonbai Kim. Their
feedback, suggestions, and insights helped a lot in improving the quality of this
dissertation. I want thank Dr. Goldsmith for providing access to the computing
clusters at University of Kentucky's KAOS lab. Paul Eberhart at KAOS lab helped
me use those machines, and his timely support allows my data analysis going
smoothly.
I am incredibly grateful to my fellow doctoral students and friends. From day to day, we discuss research topics, career concerns, and meanings of life… have
fun on weekend days or just simply sit next to each other and edit a term paper.
How could I live without your accompany and support in the past 4 years?!
I want to thank my wife, Dandan Liu. Without her scarifies and support in
the past 4 years, finishing my PhD study is impossible. I also want to take this
opportunity to thank Dr. Jim Baker and Tammi Sutton for their help and support to
iv
TABLE of CONTENTS
Acknowledgments……….………..………iii
List of Tables………...vii
List of Figures………..viii
Chapter 1. Introduction ... 1
1.1. Cross Effect and Large-Scale Cross Effect ... 1
1.2. Theoretical and Managerial Implications ... 6
1.3. Related Research... 8
1.3.1 Association Rule Mining ... 8
1.3.2 Affinity Analysis ... 10
1.4. Summary of Research Question ... 10
Chapter 2. Background and Literature ... 11
2.1 The Random Utility Model ... 11
2.2 Existing Models of Cross Effect ... 12
2.2.1 Utility Correlation and Multivariate Probit Model (MVP) ... 12
2.2.2 Conditional Choice and Multivariate Logistic Model ... 13
2.2.3 Consumption Satiation Model ... 15
2.2.4 Studies Using an Extended Number of Categories... 15
2.3 Modeling Large-Scale Cross Effect ... 18
2.3.1 Parameter Explosion... 18
2.3.2 Reliability of Parameter Estimation... 18
2.3.3 Complexity and Effectiveness of Parameters Estimation ... 19
2.4 Cross Effect Concept Development ... 21
2.5 Consumer Heterogeneity and Spending habit... 23
2.5.1 Heterogeneity in Cross Effect Literature ... 24
2.5.2 Segmentation Method in Marketing Literature ... 26
2.5.3 Spending Habits, the Heterogeneity in This Dissertation... 28
2.5.4 Data Sparseness, Fixed Effect and Random Effect Model of Heterogeneity 30 2.6 Artificial Neural Network (ANN) Technique... 32
2.6.1 Advantages of ANN for Cross Effect Analysis ... 33
2.6.2 Selected Studies of ANN Application in Marketing Problems ... 35
v
Chapter 3. Model Specification and Study Design ... 38
3.1 MVP Model with Heterogeneous Spending habit ... 38
3.1.1 The First Level of the MVP Model ... 39
3.1.2 The second level of the MVP model ... 42
3.1.3 Data Sparseness and Alternative Solution ... 44
3.1.4 Bayesian Inference and Monte Carlo Markov Chain (MCMC) Methods .... 45
3.2 ANN Model ... 46
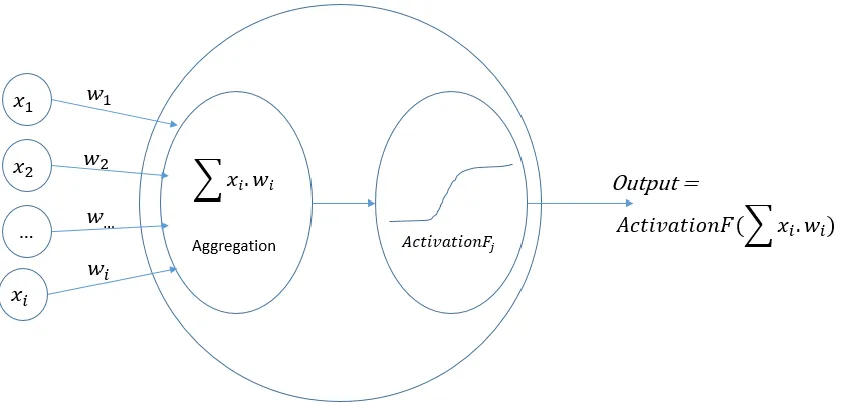
3.2.1 The General Construct of ANN... 46
3.2.2 Cross Effect ANN model ... 51
3.2.3 Consumer Heterogeneity in ANN ... 52
3.2.4 Configuration Tuning for Cross Effect Analysis... 53
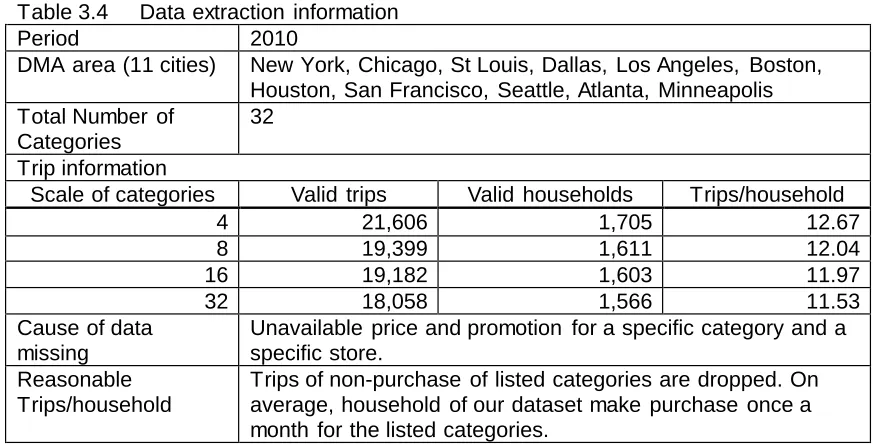
3.3 Data ... 57
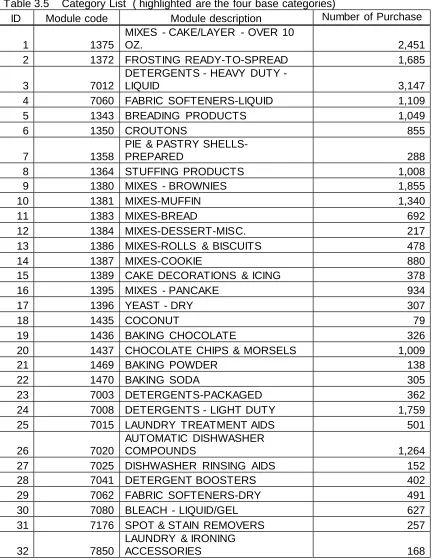
3.3.1 Four Levels of Category Scale ... 57
3.3.2 Steps and Conditions Used in Data Extraction ... 58
3.3.3 Resulting Data Statistics ... 59
3.4 Study – 1 Large-Scale MVP and Spending Habit Heterogeneity ... 62
3.4.1 Experiments to Study Model Performance with Increasing Scales ... 62
3.4.2 Prediction Hit Rate, and Measures Used in This Study ... 63
3.4.3 Parameter Estimation ... 68
3.5 Study – 2 Large-Scale ANN and Non-linear Effect... 69
3.5.1 Experiments to Study Model Performance with Increasing Scales ... 69
3.5.2 Nonparametric Model ANN ... 69
3.5.3 The Special Feature Reported by ANN Model ... 70
Chapter 4. Results of Study One ... 72
4.1 Model Runs ... 72
4.2 Model Performance of Increasing Scale ... 73
Chapter 5. Results of Study Two ... 81
5.1 Model Runs ... 81
5.1.1 Convergence ... 81
5.2 Model Performance with Increasing Scale ... 85
5.3 Non-linear Relationship ... 87
Chapter 6. Discussion ... 93
6.1 General Comparison between the ANN and the MVP ... 93
6.2 Findings of the MVP Model Estimation ... 95
vi
6.4 Non-linear Relationship, and the General Effect of an ANN Input ... 97
6.5 Complexity of MVP and ANN models ... 98
Chapter 7. Conclusions, Limitations and Future Research ... 99
7.1 Conclusions and Limitations ... 99
7.2 Future Research ... 101
7.2.1 Theory of Cross Effect between Unfamiliar Pairs of Categories... 101
7.2.2 The Spending Habit Heterogeneity Model and Propositions ... 103
7.2.3 ANN Incorporating Existing Knowledge ... 104
7.2.4 Evolutionary Learning Algorithm... 105
7.2.5 Impact of Data Preparation on Research Findings and Drawing Conclusions ... 106
7.3 General Conclusion ... 106
Appendix ... 109
Appendix A.1 Representative cross effect (CE) literature ... 110
Appendix A.2 Pair-wise Joint purchase frequency... 112
Appendix A.3 Price parameters draws of the four base category ... 115
Appendix B Inputs dependency in ANN ... 122
Appendix C Mean of Percentage Error (MPE) ... 124
References ... 127
vii
LIST OF TABLES
Table 2.1 Selected representative literature of cross effect... 17
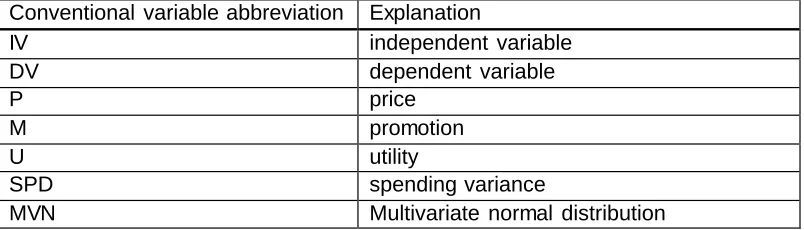
Table 3.1 Variable naming conventions used in model specification ... 38
Table 3.2 Variable abbreviation conventions used in model specification ... 38
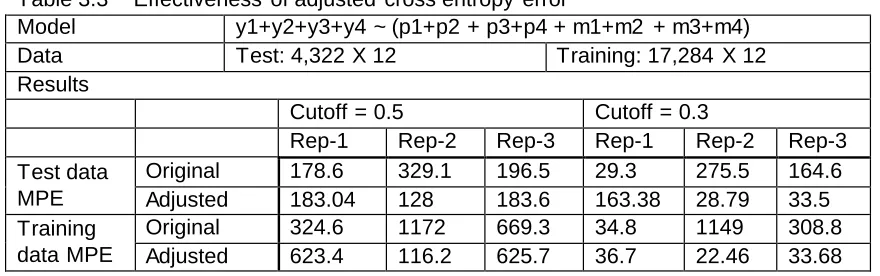
Table 3.3 Effectiveness of adjusted cross entropy error ... 55
Table 3.4 Data extraction information ... 59
Table 3.5 Category List ( highlighted are the four base categories) ... 60
Table 3.6 Part of pair-wise Joint purchase frequency ... 61
Table 3.7 Example of market basket composition and predictions ... 63
Table 3.8 Hit rate measure on scale 2 and scale 4 model outcomes ... 65
Table 3.9 Demonstration of hit rate lift ... 67
Table 3.10 Calculation of base 4 categories from a scale 8 model ... 68
Table 4.1 MCMC parameters ... 72
Table 4.2 General model performance with increasing category scale... 74
Table 4.3 Own/Cross Effect estimation (average of 10 runs) ... 76
Table 4.4 Parameter estimation dispersion of 4 categories and 8 categories model . 79 Table 5.1 Summary of ANN model configurations ... 81
Table 5.2 Selected error tracking plot ... 83
Table 5.3 General model performance with increasing category scale (a) ... 85
Table 6.1 General Performance of the ANN and the MVP model ... 94
viii
LIST OF FIGURES
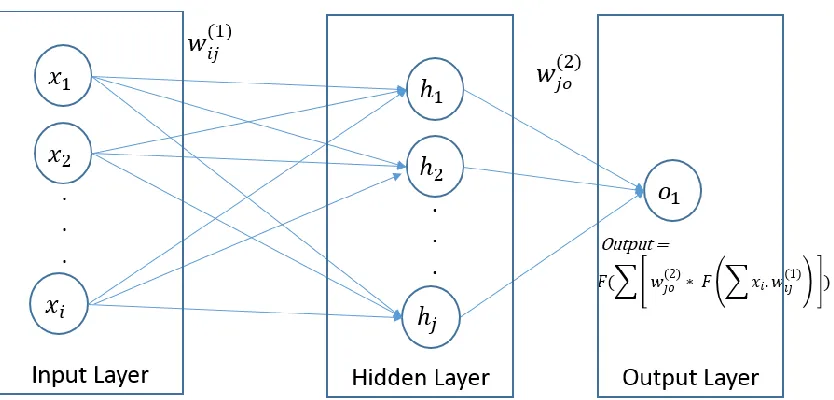
Figure 3.1 Single neuron perceptron, adopted from (West et al. 1997) ... 47
Figure 3.2 One Hidden Layer NN, adopted from (West et al. 1997) ... 48
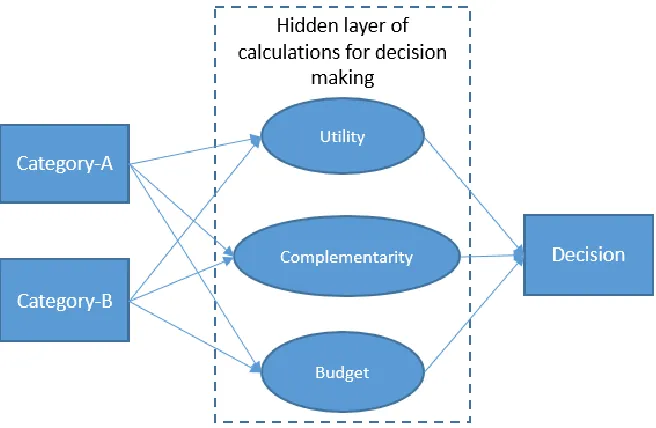
Figure 3.3 Conceptual decision making model ... 49
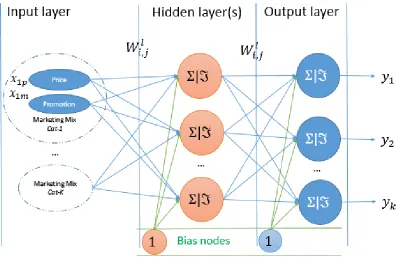
Figure 3.4 the cross category ANN model ... 52
Figure 5.1 Selected plot of generalized weights. ... 89, 90 Figure 6.1 Number of parameters and computation time ... 93
1
Chapter 1. Introduction
1.1. Cross Effect and Large-Scale Cross Effect
Many consumers supposedly purchase frosting together with cake mix.
Research of this and related phenomenon is usually called co-purchase incidence
(COPI). In general, a market action, such as price discount or promotion of cake
mix increases its sales. Thus, it is reasonable to speculate that the campaign not
only increases its own sales, but also increases sales of frosting because many
consumers supposedly purchase them together. Quantifying such a “spilled” effect
of marketing campaign among categories is related to cross effect analysis in
marketing literature (Manchanda et al. 1999). The theoretical and managerial
implications of cross effect are well acknowledged such as boosting cross sales
(Manchanda et al. 1999), maximizing overall store profit (Wedel and Zhang 2004,
Song and Chintagunta 2006, Leeflang and Parreño-Selva 2012, Pancras et al.
2013), and finding new market by identifying cross-selling opportunities (Li et al.
2005).
Most existing literature report models of cross effect with pre-specified
“familiar” categories such as bacon and egg, detergent and softener, coffee and
tea, and kitchen towel and napkin. The implicit requirement is to have good
knowledge about complementarity/substitutability between categories. However, a
modern retailer typically carries hundreds, or thousands of categories. Choosing
from a list of similar categories for cross effect analysis can be difficult and will
constrain research findings within the selected categories. For example, here is a
2 { …
FROSTING READY-TO-SPREAD
MIXES - CAKE/SPECIALTY - OVER 10 OZ. MIXES - CAKE/SPECIALTY - 10 OZ & UNDER MIXES - CAKE/LAYER - OVER 10 OZ.
MIXES - CAKE/LAYER - 10 OZ & UNDER FOOD COLORING
EGG COLORING KITS/DYE MIXES - BROWNIES
MIXES-COFFEE CAKE MIXES-DESSERT-MISC. MIXES-COOKIE
MIXES - HUSHPUPPY
CAKE DECORATIONS & ICING MIXES-FROSTING
MIXES-PIE CRUST
MIXES-DUMPLING & KUGEL MIXES – PANCAKE
…}.
There are various categories of cake mix and frosting. Making a choice of
WHICH mix and WHICH frosting is entered into the cross effect model from this
list (which is already truncated) is not an easily justifiable decision. Additionally,
pre-specifying a pair of categories excludes the possibility of pairing categories by
data-evidence. An ideal model for managers is the one being able to
simultaneously model all these categories, i.e. large-scale cross effect model.
Large-scale cross effect is the cross effect over a large number of categories in
which prior assumptions of possible cross effect is not required. This dissertation
examines an existing econometric model (MVP) and the artificial neural network
(ANN) technique as candidates for this ideal model. In so doing, it extends the
existing literature of cross category research, examines existing models’
3
category research to shed light on alternative approaches of modeling cross
category purchase.
The first objective of this dissertation is to examine the performance of
existing and alternative models. At the most general level, the research question
is: how do the two models perform in large-scale cross effect analysis that
simultaneously loads a large number of categories without prior assumptions of
complementarity/substitutability? Examples of prior assumptions include knowing
that bacon and eggs are commonly used together in a classic American breakfast,
knowing that detergent and softener are commonly used together to wash clothes,
and knowing that paper towels and napkins may be substitutes. By relaxing this
type of prior assumptions, this study allows novel combinations of categories as
cross effect partners and bases such relationships on data evidence.
This study examines two models to shed light on the first research question.
A multivariate probit model (MVP) from existing literature, and an artificial neural
network (ANN) model customized for the cross effect analysis. Using Nielsen’s
Consumer Panel and Scanner dataset, this study extracts four datasets
representing four increasing scales, i.e., four categories, eight categories, 16
categories, and 32 categories. The two models are fit to each of the four datasets.
Fitting to same dataset provides a ground for comparing performance. Several
other tactics are taken to make a fair comparison. Because ANN allows setting the
desirable level of error in model estimation, this study adjusts it to a specific level
so that the model’s prediction accuracy is similar to that of MVP model (best
4
environment, the same hardware and operating system settings are used to run
the two models.
The results show that, at similar prediction accuracy level and using the
same dataset, the ANN model usually finishes computation using much less time
and using much fewer computational resources. When scale increases from four
to eight and 16 categories, computation time of MVP models are about 84, 850,
and (estimated) more than 19,320 minutes (322+ hours), respectively; while ANN
models use about 3, 93 and 176 minutes, respectively. The MVP model becomes
computationally cumbersome when scale increases to 16 categories, while ANN
model can be computed in three hours on average. When scale increases to 32
categories, a PC with 16GB memory hits the out-of-memory error in the middle of
computing the MVP model; while the corresponding ANN model can be computed
in four hours, on average.
Practically, the ANN model is simpler in model construction.
The estimation method of both the MVP and ANN models involves
stochastic processes. MVP model estimation depends on Monte Carlo Markov
Chain method which makes random draws from multivariate normal distribution.
ANN model estimation, when using the gradient descent algorithm, relies on the
random starting location of each individual weight parameter. To reduce the effect
of randomness, ten replications runs are conducted for each model-scale pair. The
5
The variance of computation time and variance of prediction hit rate among
ANN replication runs are higher than that of MVP model runs. For ANN replication
runs, variance of computation time is very high as the scale goes up from four to
eight and 16. This finding indicates that replication runs are necessary for properly
applying ANN model to solve business problems because randomness has a fairly
large impact on ANN model’s estimation. In contrast, the MVP model has relatively
stable computation time and very tiny variance of prediction hit rate. This result
indicates that replication runs for the MVP model does not add much value.
The second objective is to apply ANN technique into large-scale cross effect
analysis. Instead of simply adopting classic ANN algorithm, this study customizes
the ANN technique to make it fit to this specific business problem. For example,
the cross entropy function is customized to weigh false negative error more over
false positive error because missing a potential customer (false negative) hurt a
marketing action more than misidentify a non-customer (false positive). However,
existing ANN research in the business field mainly focuses on comparing
prediction performance of ANN with that of statistical model. This study goes
deeper into ANN model’s mechanism and seeks to adapt its learning method to
specific business problems.
The last contribution of this study is the introduction of spending habit
heterogeneity model. Consumers’ heterogeneity in the cross effect literature has
not been studied in depth. There are few, if any, dedicated studies. Dedicated
heterogeneity studies are very few, if not none. Consumer demographic and
6
consumers’ heterogeneous response in cross effect model. For example,
Manchanda et al. (1999) regress effect/cross effect of marketing mix on family size
and total number of shopping trips. Russell et al. (1999) estimate the effect of
consumers’ average basket size on cross effect. Duvvuri et al. (2007) consider
fixed effect of income and household size on latent utility. This study focuses on
consumer’s inherent spending traits. Drawing on the consumer mental budgeting
model (Heath and Soll 1996, Duvvuri et al. 2007) and consumer impulsive
spending literature (Rook and Fisher 1995, Vohs and Faber 2007), the spending
habit heterogeneity model is introduced. This study provides testable propositions
based on the model, but leaves empirical testing for future research.
1.2. Theoretical and Managerial Implications
The large-scale cross effect analysis research is constructed in accordance
with the business analytics paradigm. Business analytics has been defined
“evidence-based problem recognition and solving” (Holsapple et al. 2014). This
study, in accordance, incorporates large number of simultaneous categories into
model, and (2) leaning on data-driven analysis by relaxing dependence on
subjective prior assumptions of possible cross effect.
The big data analytical approach is attracting increasing research interest
in the business literature. A recent example is the application of adaptive modeling.
This modeling approach, instead of specifying a fix distribution of dependent
7
effect literature has used machine learning (Mishra et al. 2014) and Dirichlet
process (Li and Ansari 2013) as a component of adaptive model calibration.
Instead of manually specifying model construct, both Mishra et al. (2014) and Li
and Ansari (2013) allow varying the model’s hyperparameters – the parameters
defining the model construct itself.
These adaptive models are shown as more capable of fitting an
information-rich dataset. However, one practical problem with these models is the significantly
increased complexity in model specification and estimation. High complexity can
impede adoption of the adaptive modeling method and, in turn, slow down
productivity gains from utilizing big data analytics. In general, there is an emerging
request for large-scale analysis techniques.
In a retailing context, because of the large-scale and high frequency of
transactions, a small improvement in accuracy of estimating sales boosts can have
significant impact on business operations and bottom lines. For example, a
manager of Walmart could find out that a discount of frosting is not necessary when
cake mix is on sale because consumers who buy the latter will most of the time
also buy the former anyway. Avoiding such a discount can mean a notable profit
gain in large volume sales. A significant profitability improvement by a customized
discount is demonstrated in empirical studies such as that of Duvvuri et al. (2007).
In contrast, when cross effect is ignored, managers can make misleading
inferences about the impact of marketing mix (Russell and Petersen 2000, Duvvuri
8
Ideally, managers can simply load all of the categories (for example, all
categories in a food section) into a large-scale model and the model can identify
and quantify cross effects among these categories. By relaxing dependence on
prior assumptions, this study is able to explore cross effect between novel
combinations of categories. For example, by including all categories in the product
group of laundry supplies, managers may find that detergent purchase is
influenced by promotion of dryer sheets but not much by promotion of liquid
softeners. This is a made-up example but using prior assumptions to speculate
cross effect in a set of more than 20 categories is not only difficult but risky. The
first premise of large-scale cross effect analysis is to relax prior assumptions about
cross effect partners.
1.3. Related Research
This section distinguishes the current study from several related research
streams.
1.3.1 Association Rule Mining
In the data mining research field, the well-known association rule mining
technique is rooted in finding frequent patterns. Frequent pattern of co-purchase
is one example of such patterns. Some literature call it frequent pattern mining, or
market basket analysis. The Support-Confidence framework is the cornerstone of
association rule mining research (Agrawal et al. 1993, Agrawal and Srikant 1994,
Kotsiantis and Kanellopoulos 2006, Han et al. 2007). Both the measure of Support
9
cross effect analysis, is different from association rule mining from two
perspectives.
First, association rule mining literature focuses on finding purchasing
associations based purely on purchase frequency. Its purpose is to identify which
two products are highly frequently purchased together. Association rule mining
strives to reveal “interesting” purchasing associations. For example, it will drop the
association of cake mix and frosting from the resulting rule list because people
already know this association and, thus, it is not “interesting”. In contrast, cross
effect analysis looks into understanding why and how consumers purchase them.
For example, it can specify that consumers use them together and discount on
frosting boosts sales of both. Then, it asks the question of how much sales
managers can reasonably expect from a certain amount of discount.
This dissertation connects these two research streams. Association rule
mining can find interesting rules, but does not explain reasons and does not
quantify cross sales. Existing cross effect literature does the opposite, explaining
and quantifying but does not look for unexpected associations. This dissertation
looks at an integrated capability of rule finding and quantifying. Section 1.2
explains why such an integrated capability is important.
Second, from the methodology perspective, association rule mining focuses
mainly on improving computational performance because finishing computation
10
database, the rule searching is very time consuming. However, the computation
time, at least in the published literature, is not a focus of cross effect research.
1.3.2 Affinity Analysis
Affinity analysis carried out in the marketing literature is similar to the
association rule mining research in that it aims to analyze purchase associations
(Russell et al. 1999, Boztuǧ and Reutterer 2008). In general, marketing literature
points out that affinity analysis ignores marketing mix and consumer heterogeneity
and, thus, may be too misleading to be used in marketing decision making (Russell
and Petersen 2000).
1.4. Summary of Research Question
In summary, this dissertation examines solutions and related concerns to
large-scale cross effect analysis. Generally, it has two objectives:
1. To examine computation and prediction performance of a MVP model in
increasing scale of categories.
2. To apply and customize ANN technique in large-scale cross effect
analysis.
Additionally, by synthesizing the existing literature of consumer mental
budgeting and impulsive spending, this study conceptualizes the spending habit
heterogeneity model in the cross effect context. The model is introduced in the
future research section. Testable propositions are provided.
11
Chapter 2. Background and Literature
2.1 The Random Utility Model
Most cross effect studies take the approach of random utility model
(McFadden 1973; 1980; 1986). Walker and Ben-akiva (2002) provide review and
generalization of this model. This model specifies that consumers implicitly
calculate a utility gain on each transaction. When having an opportunity to
purchase a specific category on a shopping trip, consumers do purchase if the
utility gain is positive, and do not purchase at a zero or negative gain. This latent
utility specification translates consumers’ discrete choice decisions into a
continuous variable of latent utility. Then this continuous latent utility (𝒖𝑖) can be regressed on interesting independent variables (𝒙𝒊) such as price and promotion. In general, the random utility model can be shown as below.
𝒚 = {𝑦1, 𝑦2, … , 𝑦𝐾}, 𝑐ℎ𝑜𝑖𝑐𝑒 𝑜𝑓 𝐾 categories in a COPI set (2.1)
𝑦𝑖 = {
0 (𝑛𝑜𝑡 𝑝𝑢𝑟𝑐ℎ𝑎𝑠𝑒𝑑), 𝑢𝑖 ≤ 0
1 (𝑝𝑢𝑟𝑐ℎ𝑎𝑠𝑒𝑑), 𝑢𝑖 > 0 (2.2)
𝑢𝑖(𝒙𝒊) = 𝜷𝑖𝒙𝒊+ 𝜀𝑖 (2.3)
𝑖 ∈ {1,2 … 𝐾}
Note: For simplicity, the general model shown here has omitted the index
of household h, and shopping trip t.
Consumers’ choice of purchase among a COPI set is represented by the
12
valued variable indicating purchased or not purchased of category K as shown in
equation (2.2). The conditions of equation (2) shows the mapping from discrete
choice to latent utility. In short, the model specifies that consumers will purchase
category K when 𝒖𝐾 > 0 and vice versa. Equation (2.3) represents a multivariate regression model. Utility of purchasing a category 𝒊 is regressed to 𝒙𝒊, a vector of independent variables such as price, product display, product featuring, and other
promotions (including the constant term 1 as the first element). The estimated
effects are captured in vector 𝜷. The error term captures the unobserved utilities
of purchasing category 𝒊 .
2.2 Existing Models of Cross Effect
2.2.1 Utility Correlation and Multivariate Probit Model (MVP)
Manchanda et al. (1999) specify cross effect as the effect of category A’s
marketing mix on category B’s purchase utility. In their MVP model, the latent utility
of a customer purchasing a category is regressed on the marketing mix variables
of two sources, the focal category and paired category. The latter captures the
cross effect, i.e., the part of purchase utility allocated to other categories’ attributes.
The unobserved purchase utility is captured by the error term. The specific feature
of the MVP model is that it allows correlation among error terms. The unexplained
co-purchase incidence is captured by the correlation matrix of error terms. The
model is estimated with two pairs of categories, cake mix and frosting and
detergent and softener. Their model finds that cross-effect driven by marketing mix
13
Li et al. (2005) extend Manchanda et al. (1999) and model choices of
financial products. Consumers’ readiness to buy a financial product is called
maturity status. They theorize that consumers’ maturity status can be explained by
variables such as cumulative purchases, average account balance, and
experience with a type of product. Correspondingly, a financial product can have
its maturity level indicating fit to different levels of consumer maturity status. By
adding such a set of explainers into the Manchanda et al. (1999) model, Li et al.
(2005) show an improved prediction accuracy on a holdout sample. It is also
acknowledged that Manchanda et al. (1999)’s model outperforms several
alternative models in this context.
Duvvuri et al. (2007) use a model similar to that of Manchanda et al. (1999).
They simultaneously load into their model six categories including the four used by
Manchanda et al. (1999). But the cross effect partners are pre-specified and are
not allowed to change during the model estimation. The results show that some
consumers seem more sensitive to spaghetti’s price than to sauce’s price under
an independent model, but they become more sensitive to the price of sauce under
a cross effect model. Such an inverse relationship is surprising. The authors
explain the results with a mental budgeting model (Heath and Soll 1996).
2.2.2 Conditional Choice and Multivariate Logistic Model
Russell and Petersen (2000) model cross-category incidence with a
conditional choice model. The model assumes that consumers’ latent utility of
choosing a category in a shopping basket depends on the categories that are
14
frequent purchases of such a combination than purchases without that.
Interestingly, their analysis shows that the size of the cross effect (by price change)
is pretty small among the four categories they use (paper towels, napkins, facial
tissue, and toilet tissue.) Their study suggests that cross price effect exists, but
may not be managerially important because of the small effect size.
Their model is called a conditional choice model in the sense that the
concept of cross effect is conditioned on an actual purchase of the cross partner
(recall appendix A.1 for the model specification). Their model theorizes that the
cross effect is the extra utility from purchasing another category, given the current
category is already purchased. This dissertation takes the alternative perspective
that cross effects do not necessarily rely on actual purchase (recall section 2.4).
For example, suppose that consumers purchase both cake mix and frosting when
frosting is on sale; but do not purchase cake mix when frosting is not on sale.
Russell and Petersen (2000) model captures cross effects from only the former
scenario, because the cross effect is the extra utility for purchasing frosting. The
model of this dissertation captures cross effects from both scenarios because
cross effects could exist without actual purchases. This perspective is less
constrained and allows “informational” cross utility. For example, a promotion of
flowers may just remind consumers to purchase a box chocolate without
purchasing the flowers. The Russell and Petersen (2000) model excludes such
cases.
Song and Chintagunta (2006) extend the Russell and Petersen (2000)
15
result of data analysis, in general, validates the necessity of accounting for cross
effect in understanding purchase relationships. At the cost of increased model
complexity, the Song and Chintagunta (2006) model demonstrates an approach of
directly quantifying the relationship of purchasing among specific brands. The
results of data analysis show some unexplained observations. For example, the
data model estimation shows that lowering the price of Tide powder detergents
increases the sales of liquid detergent.
Boztuğ and Hildebrandt (2003) adopt the model of Russell and Petersen
(2000) and test with a German dataset. They find a similar level of cross effect, but
an opposite direction of the effect of customers’ average basket size on latent utility.
2.2.3 Consumption Satiation Model
Kim et al. (2002) propose a model that is rooted in the consumer theory of
micro economics. The model approximates consumers’ choice of a bundle of
yogurt products with the principle of consumption complementary/substitution,
consumer budget constraints, and consumption utility satiation. The model has a
stronger theory base and is able to model quantity choice with the utility satiation
theory. However, it puts more constraints on choosing complementary/substitute
categories. In contrast, this study relaxes the dependence on prior assumptions
for what categories being chosen.
2.2.4 Studies Using an Extended Number of Categories
Chib et al. (2002) examine twelve categories that are deemed as composing
a classic market basket. Compared with this dissertation, their study does not relax
16
their study quantifies the correlation of utility of purchase, which is different from
our goal (i.e. to quantify the utility dependency) They find that ignoring cross effect
(measured by utility correlation) can bias estimation of marketing mix, and using a
subset of twelve categories can bias estimation of cross effect. The estimation bias
issues is acknowledged in literature, such as (Duvvuri et al. 2007, Hruschka 2013).
Boztuǧ and Reutterer (2008) combine two techniques: cluster analysis and
cross effect analysis. Cluster analysis theorizes that consumers with similar basket
compositions would be similar in latent-utility-based decision making processes. It
first clusters shopping baskets by an extended K-means algorithm, and outputs 14
basket prototypes, each containing 5 categories. When consumers are grouped
into basket prototypes, the whole data set can be divided into subsets, and cross
effect models can be estimated on each of these subsets, as well as on the whole
dataset. The cross effect model they use is the same as the Russell and Petersen
(2000) model.
Artificial intelligence technique is rarely used in cross effect analysis.
Hruschka (2014) examines a technique called restricted Boltzmann machine in this
context. They are able to load 60 categories into that machine.
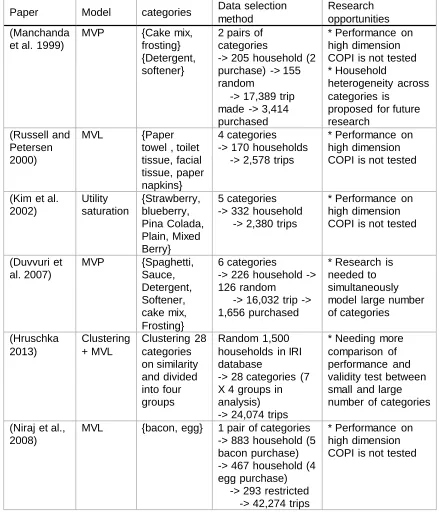
In terms of scale of categories, Table 2.1 shows some representative
17
Table 2.1 Selected representative literature of cross effect
Paper Model categories Data selection
method
Research opportunities (Manchanda
et al. 1999)
MVP {Cake mix,
frosting} {Detergent, softener}
2 pairs of categories
-> 205 household (2 purchase) -> 155 random
-> 17,389 trip made -> 3,414 purchased
* Performance on high dimension COPI is not tested * Household
heterogeneity across categories is
proposed for future research
(Russell and Petersen 2000)
MVL {Paper
towel , toilet tissue, facial tissue, paper napkins}
4 categories -> 170 households -> 2,578 trips
* Performance on high dimension COPI is not tested
(Kim et al. 2002) Utility saturation {Strawberry, blueberry, Pina Colada, Plain, Mixed Berry} 5 categories -> 332 household -> 2,380 trips
* Performance on high dimension COPI is not tested
(Duvvuri et al. 2007)
MVP {Spaghetti,
Sauce, Detergent, Softener, cake mix, Frosting} 6 categories
-> 226 household -> 126 random
-> 16,032 trip -> 1,656 purchased
* Research is needed to simultaneously model large number of categories
(Hruschka 2013)
Clustering + MVL
Clustering 28 categories on similarity and divided into four groups
Random 1,500 households in IRI database
-> 28 categories (7 X 4 groups in analysis) -> 24,074 trips
* Needing more comparison of performance and validity test between small and large number of categories
(Niraj et al., 2008)
MVL {bacon, egg} 1 pair of categories
-> 883 household (5 bacon purchase) -> 467 household (4 egg purchase) -> 293 restricted -> 42,274 trips
18
2.3 Modeling Large-Scale Cross Effect
2.3.1 Parameter Explosion
Relaxing dependency on prior assumptions leads directly to a parameter
explosion problem. If category partners are pre-paired for cross effect, such as
bacon paired with egg, or cake mix paired with frosting, then parameter explosion
can be avoided because a model takes only two categories. If pairs are not
pre-specified, then a model needs to quantify cross effects between any possible pair
of categories in a set. This results in a set of relationships between categories of
any subset. The resulting relationships can be a permutation operation on the
original set. By limiting the relationships to pairs only, there are 𝑝322 = 992 relationships for a set of 32 categories. If there are two independent variables for
a category, such as price and promotion, then the number of parameters doubles.
This is the case for our extracted dataset. See Section 3.3 for details of dataset
preparation. The model’s performance with increasing category scale has not been
examined in the existing literature.
2.3.2 Reliability of Parameter Estimation
Research finds that co-purchase correlation is identified as insignificant in
a small scale model, while weakly significant in a larger scale model (Boztuǧ and
Reutterer 2008) and the effect size is sometimes underestimated (Chib et al. 2002).
Chib et al. (2002) examine the potential impact by including 12 categories, which
are identified by prior literature as a classic consumer basket composition. First of
all, they found that cross-category effect (they call it cross category correlation)
exists and ignoring it will lead to overestimation of marketing effectiveness. More
19
categories compared with a model of 12 categories. Their paper is among the few
empirical studies that look into the impact of increasing number of categories. The
biased estimation found under small number of categories makes it valuable to
further investigate impacts of number of categories. More studies are needed for
further and more deeply understand the impact of category scale on model
performance.
Hruschka (2013) compares the performance of a holistic model of 28
categories with that of four individual models. Each individual model contains 7
categories. The results show that the four individual models generate biased
estimations. Additionally, the individual models show insignificant purchase
correlations that are shown to be significant in the holistic model. The models focus
on the Pearson correlation measure rather than cross effect.
2.3.3 Complexity and Effectiveness of Parameters Estimation
Specifying an econometric model is time consuming and intellectually
challenging. It involves carefully designing a data collection/preparation method,
plus making reasonable assumptions of data distribution and relationship s
between variables. Large-scale cross effect analysis apparently increases such
complexity. First, it needs to deal with big dataset transformations usually at the
level of millions of records. It would be a difficult experience without large-database
skills. However, academic business research has a tradition of focusing on
theoretical development. The data transformation, cleaning, and selection
20
In terms of parameter estimation efficiency, the multivariate econometric
model used in cross effect analysis is subject to the “curse of high-dimensionality”
(Manchanda et al. 1999). The MCMC estimation method is commonly used to
remedy the difficulty of computing high dimension integrals (Russell and Petersen
2000, Duvvuri et al. 2007, Hruschka 2014). In general, the MCMC method avoids
calculating high dimensional integrals by drawing random samples from posterior
distribution of parameters. The existing literature shows that the MCMC method
works fine in small scale cross effect models. However, performance of MCMC in
large dimension problems has not been examined. Ceperley et al. (2012)
speculate that the method may be less effective for high dimension problems. This
dissertation empirically examines MCMC’s performance in high dimension cross
effect.
One goal of this dissertation is to examine model performance of MVP for
large-scale categories. It also examines performance of artificial neural network
model for large-scale categories. Details of the model specifications and study
design are provided in Chapter 3.
Computation time may modestly, linearly, or exponentially increase with the
increasing number of loaded categories. Information about this relationship has
theoretical and empirical meanings. First, if the computation time turns out
prohibitive, then it intrigues researchers to find out reasons and to provide solutions.
Even if the increase turned out linear or modest, the total computation time may
be significant because of the large number of categories loading. For example, it
21
would be prohibitive to compute that for 100 categories in 100 hours, even though
the time increase is linear.
Future research may be warranted to improve estimation algorithms and
improve computing performance so that managers with low profile computing
power can adopt and benefit from large-scale analysis i.e., the commoditization of
computing large-scale cross effect. An IBM Whitepaper1 predicted that, through
2015, 85% of Fortune 500 organizations will be unable to exploit big data analytics
for competitive advantage. If analytics capability became an enabling component
in large organizations, then middle or small ones have to build that capability to
survive. Researchers can contribute to the commoditization of big data analytics.
In the area of large-scale cross effect analysis, improving estimation algorithms
and computation performance are always significant contributions.
2.4 Cross Effect Concept Development
Manchanda et al. (1999) defines it as the effect of marketing mix of one
category on latent utility of another category. This specification has high
managerial implications because managers can manipulate marketing mix. This
definition, on the other hand, does not explain why price change of category A will
affect sales of category B.
This study specifies cross effect as the dependency of perceived utility of
purchasing a category on that of purchasing another category. In general, this
22
specification first provides a broader range of cross effect implementation and,
thus, allows more flexible model specification. The utility dependency specification
does not contend that marketing mix of A directly impacts sales of B. Promoting A
increases A’s latent utility. If B’s latent utility is conditioned on A’s, then B’s utility
may increase or decrease depending on the strength and direction of the latent
utility dependency.
This specification is theoretically justifiable. A consumer’s perceived utility
of purchasing a category is not only related to the category’s own marketing mix,
but also related to the consumer’s perceived utility of purchasing related categories.
For example, many people when making a cake want to use frosting as well. In
this case, the utility of purchasing frosting is conditioned on the utility of purchasing
cake mix. If consumers do not have positive utility of purchasing cake mix (not plan
to make cake), then their utility of purchasing frosting may significantly decrease.
Theoretically, such a utility dependency, if it exists, should be reflected in observed
dependency of decisions of purchasing.
The root cause to cross effect involves a question of why consumers
purchase some categories together under a statistically significant frequency.
Russell and Petersen (2000) articulates the two schools of theory, namely, store
traffic and global utility. Store traffic theory attributes cross-category incidence
mainly to store-specific features such as promotions, displays, and bundles. It
assumes that an individual consumer’s latent utilities from purchasing each
category is independent from each other. Thus, purchase correlation is only
23
suggests that cross-category purchases are results of a consumer’s preference of
joint-consumption. So, the cross-category purchase is independent of shopping
store, but is supposed to be subject to consumer heterogeneity. Recent literature
has found significant consumer heterogeneity in empirical studies. Further, more
and more papers take into account consumer heterogeneity in modeling
cross-category purchase. These two theories do not necessarily exclude each other in
nature, but managers are interested in knowing consumers’ heterogeneity. This
paper takes the global utility view that takes consumers’ consumption utility as the
major cause of cross-category purchase.
2.5 Consumer Heterogeneity and Spending habit
Accounting for consumer heterogeneity is necessary in many marketing
analysis situations (Wind 1978, Kamakura and Russell 1989, Wedel and
Kamakura 1998). Under various conditions, the result of an analysis can be biased
or fail to identify expected relationships when heterogeneity is not properly
addressed (Allenby and Rossi 1998, Fiebig et al. 2010, Dippold and Hruschka
2013). It is a common practice to incorporate consumer heterogeneity in cross
effect research (Duvvuri et al. 2007, Niraj et al. 2008, Mehta and Ma 2012, Aguinis
et al. 2013). However, heterogeneity in cross effect studies typically is correlated
simply with demographic information or historical transaction information.
Theoretical investigations in the cross effect research is very limited. One
exception is that of Duvvuri et al. (2007) which examines consumer budgeting
24
Consumer heterogeneity is related to subjects such as market
segmentation, conjoint analysis, and cluster analysis for the similar objective of
distinguishing consumer preferences. This study first reviews the heterogeneity
studies in cross effect literature. Then, it provides a quick overview of market
segmentation literature for segmentation methods, variable selection, and
evaluation criteria. Finally, this investigation articulates the heterogeneity model
used in this dissertation.
2.5.1 Heterogeneity in Cross Effect Literature
There are mainly two types of heterogeneity models in cross effect literature.
One type is represented by Chib et al. (2002) and the other is exemplified by
Manchanda et al. (1999).
Chib et al. (2002) capture household-specific heterogeneity and
category-specific heterogeneity with a fix effect model. Their model assumes that each
household has its own mean utility on each category. The equation (2.4) below
shows the general model. See Chib et al. (2002)’s model in the Appendix A.1.
𝑈ℎ𝑡𝑗 = 𝑋ℎ𝑡𝑗𝛽𝑗+ 𝑏ℎ+ 𝑐ℎ𝑗+ 𝜀ℎ𝑡𝑗 (2.4)
The utility, 𝑈ℎ𝑡𝑗, is attributed to household value 𝑏ℎ, and household-category specific value 𝑐ℎ𝑗.
The model implicitly assumes that households are the same in elasticity of
25
same across all of households. Such a fixed elasticity specification is relatively
arbitrary because it suggests that a change of marketing mix of a category
generates a utility change that is the same for all consumers. This specification
rules out the possibility that consumers perceive different values of a same change
of marketing mix.
Manchanda et al. (1999) fit a random effect model of heterogeneity. The
model assumes that household specific cross effect is normally distributed. For a
given household, the cross effect value on a category is determined by individua l
characteristics, plus a random error. In segmentation literature, this approach is
sometime called mixture model (Kamakura and Russell 1989, Wedel and
Kamakura 1998). The consumers in the data sample are assumed to be a mix of
different groups. Each group of consumers is assumed as a random draw from the
“super” population. Thus, a group has its own distribution of the cross effect, which
may be featured by different mean and variance derived from the “super”
population‘s overall mean and variance.
Both Duvvuri et al. (2007) and Manchanda et al. (1999) take purchase
history as an independent variable, but in different ways. The former includes the
inventory variable at the level parallel to marketing mix (i.e., the explanatory
variable of latent utility). The latter considers the purchase history (purchase
frequency) at the level parallel to demographic variables (i.e., the explanatory
variables of the heterogeneity). The latter approach is consistent with market
segmentation literature (Allenby and Rossi 1998). Information of consumers’
26
into abstraction of lifestyles (Holt 1997) instead of being used directly to explain
purchase utility.
Appendix A.1 summarizes the literature in regards to ways of dealing with
heterogeneity in cross effect models. It should be noted that the network models
have been examined for addressing heterogeneity (Yang and Allenby 2003).
Consumer heterogeneity is highly related to the market segmentation
research stream, which focuses on addressing consumers’ different preference.
Depending on the research objectives, there are many ways to segment
consumers. This study briefly reviews the segmentation approaches in the next
section.
2.5.2 Segmentation Method in Marketing Literature
In the marketing literature, segmentation research is about theories and
methods to capture heterogeneous consumer needs and preferences. Such efforts
in general enable marketers to better identify and serve customers with precise
customization. The value of segmentation has been well acknowledged in both
academic and industrial marketing research and practices. For example, Currim
(1981) find that by segmenting customers by their perceived utilities on
transportation alternatives, analysts can identify important factors that are specific
to a segment in terms of influencing their choice of transportation alternative.
These factors would not be identified as important in an aggregated model.
Market segmentation is rooted in heterogeneity of consumer
27
(1998, page 1), which says “market segmentation involves viewing a
heterogeneous market as a number of homogeneous markets, in response to
differing preference, attributable to the desires of consumers for more precise
satisfaction of their varying wants” and also says “…segments are directly derived
from heterogeneity of consumer wants…”
Market segmentation is a relatively mature subject in marketing literature
(Wedel and Kamakura 1998, page 1, Taylor-West et al. 2008). Classic articles
include, but are not limited to, Smith (1956), Wind (1978), Punj and Stewart (1983),
Kamakura and Russell (1989), Jedidi et al. (1997), Allenby and Rossi (1998),
Straughan and Roberts (1999), Boxall and Adamowicz (2002). Through decades
of literature accumulation, market segmentation has developed a rich set of
methods and models. Thus, this dissertation relies on this literature in developing
its heterogeneity construct.
This study excludes literature on conjoint analysis (Green and Srinivasan
1978) and related studies that are based on product attribute utility models.
Conjoint analysis is recognized as a methodology for developing market segments
(Wedel and Kamakura 1998, chapter 17). It theorizes that a consumer’s utility of
purchasing a product is based on a function (usually linear) of the consumer’s
evaluation of the product’s attributes. In contrast, the cross effect is theorized on
the utility dependency between categories and, thus, is a higher level aggregation
than conjoint analysis. In terms of addressing consumers’ heterogeneity in cross
28
heterogeneity can be aggregated according to research objectives and data
availability.
Punj and Stewart (1983) provide theoretical justification for applying cluster
analysis to solving marketing problems. In general, segmentation and cluster
analysis share a goal of grouping entities such as consumers and companies.
Practically, cluster analysis is traditionally recognized as a method of market
segmentation (Punj and Stewart 1983, Wedel and Kamakura 1998, page 17).
2.5.3 Spending Habits, the Heterogeneity in This Dissertation
This study conceptualizes spending habits as a source of heterogeneous
response to marketing mix. This conceptualization is based on two schools of
literature: mental budgeting model (Heath and Soll 1996, Duvvuri et al. 2007) and
impulsive spending research (Rook and Fisher 1995, Baumeister 2002, Vohs and
Faber 2007). The mental budgeting model suggests that people conduct implicit
calculation of purchase utility and make decisions when the calculation results in
obvious gains/loss of a purchase.
This study takes the mental budget model further and considers the depth
of consumers’ mental calculation. People of careful spending habit may be
accustomed to planned and within-budget spending. Thus, they are more likely to
do deeper calculation on purchases. At one end of the spectrum are people who
rarely spend over/under budget, while the other end has people who care little
about a price tag, but buy things catching their attention. Impulsive spending
29
can be inherent “impulsive buyers” or “not impulsive buyers “(Rook and Fisher
1995, Youn and Faber 2000). This kind of spending habit (depth of mental
calculation) is expected to be stable because habits are very hard to change.
Cross purchasing is a phenomenon that is expected to be highly related to
consumers’ budget calculations. In general, at a promotion or price drop,
consumers buy more. In a case where cross category is considered, consumers
may have to buy more of both to enjoy the utility of discount or promotion. Whether
the cross category would be purchased can be associated with flexibility of her
mental budget, i.e. the spending habit. Indulgent types of mental budgeting are
hypothesized to be associated with higher cross effect, because the consumer’s
mental budgeting is allowed larger variance.
To realize the mental budgeting theory in cross effect model, the first task
is to define variables that reflects consumers’ types of spending habits. Plausible
variables should reflect consumers’ degree of mental budgeting. It is assumed that
the total spending at shopping trips is normally distributed. Thus, large variance of
trip total spending can reflect indulgent mental budgeting, while small variance can
reflect conservative mental budgeting. Technically, the variance of trip total
spending is easy to calculate. The value range is (0, +Inf).
It is possible that the normality assumption is violated. For example,
consumers may periodically make a large grocery shopping trip followed by small
contingent shopping. This type of consumer can have large variance of total
30
of such cases in its dataset, because the contingent trips would be excluded if the
focal categories was not purchased in that trip. Even if the pattern appears in
individual consumer’s purchasing history, it would not seriously disable our model.
The random effect heterogeneity model (recall next section) pools consumers by
their degree of mental budgeting, rather than distinguishing individuals. Pooling
consumers together largely removes such patterns.
2.5.4 Data Sparseness, Fixed Effect and Random Effect Model of Heterogeneity
This study specifies a random effect model for heterogeneity. The choice
between random and fixed effect model is highly related to data sparseness. The
two models are explained below.
The fixed effect approach assumes that each unit is significantly different
from others in terms of responding to a stimuli, and estimating the unique response
of each unit is necessary according to research objectives. In contrast, the random
effect approach assumes that, even though each unit is different from another for
response to a stimuli, the difference among units is not serious enough to be
distinguished between every pair of individuals according to research objectives.
Thus, it is good enough to estimate a general center for all units and a unit’s “extra”
response is regressed on explanatory variables. In this sense, regression models
in general are random effect models where individual’s response is not uniquely
identifiable by the model.
For example, managers can regress sales change on price change. The
31
model represents a random effect of price on sales because it does not distinguish
individuals for their response, but rather estimates a general center over all
respondents. In another case, a manager of target marketing wants to estimate
consumers’ response to a marketing campaign for each individual customer
because customized promotion can be developed. In this case, individual personal
information must be used to estimate the different responses. In other words, the
value of the estimated model lies at the individual’s unique feature that makes
him/her respond differently; while in the former case, the value lies at the overall
aggregate level of response.
The choice between fixed and random effect heterogeneity models
depends not only on research objectives and theoretical justification, but is also
constrained by data availability. Consumer’s response to a marketing mix change
can be very sparse. As explained in (Rossi et al. 2005, page 130), 12 observations
is very common for a household’s purchase of a category in a year. In such a
situation, it is necessary to consider the proper level of aggregation, even though
the individual level of heterogeneity is desirable.
Data aggregation level is a critical factor for addressing heterogeneity.
Theoretically, each consumer is unique in consumption preference. But, each pair
of consumers can also share a certain level of aggregated preference. Marketing
segmentation literature sometimes labels it segment homogeneity (Wind 1978,
Wedel and Kamakura 1998). For example, the well-known Maslow’s hierarchy of
32
as well as a feeling of love and belonging, but everybody is different in the way
and strength of those needs.
Ideally, marketing science would like to model preference as specifically as
possible. The extreme end of this direction is the ability to predict each individual’s
personal preference (Wedel and Kamakura 1998, page 1). It appears that
marketing science is heading in that direction through technology advancement.
In a statistical sense, to model cross effect to a specific level of consumer
heterogeneity, the available data are required to contain enough samples for that
level of preference. For example, in order to confidently cluster consumers’
preferences by the factor of family size, enough samples are required for each type
of family size to represent a set of distinguishable preferences. Data availability
was pointed out as a potential issue for segmentation validity check (Wind 1978).
Theoretically a segmentation study should ensure customer identifiability (Wedel
and Kamakura 1998, page 4). A large database requires choosing a proper level
of preference aggregation so that important factors are included and preferences
are properly addressed. In addition, high specificity of preference requires powerful
computation resources. Thus, the practical way is to model the preference at the
level that is computationally feasible and includes managerially important factors.
2.6 Artificial Neural Network (ANN) Technique
This section first introduces ANN model and explains why ANN is
appropriate in large-scale cross effect analysis. It then reviews several
33
2.6.1 Advantages of ANN for Cross Effect Analysis
The ANN model has been compared with regression models, especially
with logistic regression models, from a statistical perspective (Bishop 1995,
Warner and Misra 1996, West et al. 1997). Many empirical studies suggest
superior prediction accuracy of ANN over traditional regression models. Wong et
al. (1997) reviews ANN’s application in business. Paliwal and Kumar (2009)
provides a review of ANN from a technical perspective.
This study examines the ANN model in large-scale cross effect analysis for
several reasons.
First, the ANN model is a learning model of high adaptive capability
(Cybenko 1989, Hornik et al. 1989). It is well documented that ANN captures both
linear and non-linear relationships (West et al. 1997, Paliwal and Kumar 2009).
Actually by restricting the number of hidden perceptrons to zero and the activation
function to direct linear, a neural network downgrades to a linear regression model;
under the same condition, but as a logistic activation function, it becomes a logistic
model. Both multiple regression and logistic regression models are special cases
of generalized linear models. Further, a generalized linear model is a special case
of a neural network model (Bishop 1995). The advantage of ANN is that it can learn
model structure from data, in contrast to the traditional approach that analysts are
responsible for pre-specifying a model structure. This fact suggests that ANN
needs a large and information-rich dataset to be accurate. The successful
application of ANN in image recognition and natural language processing is based