Assessing quality in Higher Education:
some caveats
Ferrante, Francesco
Department of Economics and Law - University of Cassino and
Southern Lazio, AlmnaLaurea
2014
Online at
https://mpra.ub.uni-muenchen.de/62450/
ASSESSING QUALITY IN HIGHER EDUCATION: SOME
CAVEATS
FRANCESCO FERRANTE§
Abstract
The technology of cognitive and non-cognitive skills formation is characterized by the cumulative nature of learning processes and by the presence of significant complementarities and irreversibilities in the acquisition of such skills [Cunha and Heckman, 2007]. From this it follows that, in order to evaluate the quality of individual phases of skills formation, it is necessary to take account of the quality of the human capital entering the training process. It is evident that this aspect is more important, the more advanced the level of education. This paper evaluates the effects of the quality of Italian matriculants at 24 engineering faculties measured with the results of the CISIA standardized test on the regularity of university studies. The preliminary results confirm that failing to take account of the incoming quality of students may give rise to significant distortions in the evaluation of the academic productivity of universities.
1. Introduction
There are several reasons for the growing interest in the performance of education
systems, in particular at tertiary level. First, the wide gaps in learning outcomes
recorded by international surveys, such as PISA or PIAAC, are also apparent among
countries similar by level of socioeconomic development and expenditure on education.
Second, the rising cost of education has a weight on fragile public finances which is
judged unsustainable in the long term. Third, especially in developing countries, the
sharp rise in the educational attainment of the population has not been followed by an
equivalent increase in its average quality in terms of learning achievements (Hanushek,
2012). Finally, there is robust empirical evidence that the relationship between human
capital and growth is explained better by learning outcomes than by the educational
attainment of the population (Hanushek and Woesmann, 2008; 2012)
§ Department of Economics and Law, Università di Cassino e del Lazio Meridionale and AlmaLaurea
It is therefore understandable that, especially in underperforming countries like Italy,
education experts and policy makers agree on the need to scrutinize the performance of
the education institutions more closely and to implement reforms to enhance their
efficiency and effectiveness.
A large body of literature straddling economics and psychology shows that the
technology of cognitive and non-cognitive skills formation is characterized by the
cumulative nature of learning processes and by the presence of significant
complementarities and irreversibilities in the acquisition of such skills along the
educational production chain [Cunha and Heckman 2007]. In particular, the
accumulation of cognitive and non-cognitive skills is characterized, especially in the
first years of life, by the presence of feedback between the former and the latter, and by
the fact that the further along the education production chain, the more difficult it
becomes difficult to remedy learning deficits.
It is evident that this aspect is more important, the more advanced the level of
education. Figure 1 illustrate the idea: the potential for learning at every stage of the
chain is conditioned by the width and height of the segments of the pyramid. In
particular, tertiary education is the level most conditioned by previous learning. Equally
ample and consolidated is the empirical evidence on the crucial role performed by
contextual factors in learning processes (family of origin, social and educational
environment); factors which condition the outcomes of the latter beyond the effects of
the quality of educational institutions and teachers.
It is likely that as the level of education increases, so does the weight of previous
learning – with a concomitant decrease in the weight of contextual factors in
conditioning the outcomes of education. This is due to the fact that, with increased age,
cognitive and non-cognitive skills tend to stabilize and consolidate, having absorbed all
the effects of subjective and contextual factors.
From this it follows that, in order to evaluate the quality of the individual phases of
the educational process in terms of effectiveness and efficiency, account should be
taken of the quality of the human capital entering the education system and
measurement should be made of the value added.
There is a large body of literature, mainly of English-speaking origin, testifying to the
of education processes and its use in the allocation of resources is most advanced [Todd
& Wolpin 2003, Lochwood et al. 2009, Zhang, 2009; Rothestein, 2009 and 2010]. With
regard to tertiary education in particular, Kreutzer and Wood [2007] have applied a
methodology to rank American undergraduate business schools in terms of added
value,1 then comparing the results with the very different classification of the same
institutions drawn up by the magazine Business Week. Zhang [2009] has carried out a
similar exercise in order to measure the quality, in terms of added value, of public
colleges at state level, obtaining differentials, in comparison with Alabama, ranging
from -10% to +40%. In this case, too, the ranking differs substantially from the one
customarily used by families and based on the results achieved in college entry tests by
matriculants and on the ranking of the high schools attended by the latter [Barron's,
1988]. The author concludes that, to a large extent, the latter ranking does not reflect the
intrinsic quality of colleges, but rather that of their students.
Measurement of the performance of schools using the added value criterion is largely
restricted to the English-speaking countries. In the USA, various school districts in
Tennessee have adopted the EVAAS (Education Value-Added Assessment System),
and other states are experimenting with it. The Department of Education of the United
Kingdom has for some years adopted a method based on calculation of CVA
(Contextual Value-Added) to evaluate the performance of schools taking account of the
numerous socio-economic and demographic factors that affect learning by pupils.
In Italy no such work has been conducted, and contributions by empirical analysis are
virtually non-existent, with the exception of a recent study by Cipollone, Montaro and
Sestito [2010] on upper-secondary schools. Also to be mentioned, given its importance
for this area of analysis, is the study by Aini, Baici and Casalone [2010].
Notwithstanding the difficulties of such measurement and its limitations in evaluating
the performance of individual teachers, the results of these studies show that, overall,
the evaluation of educational institutions also at tertiary level – especially when it is
believed that these should promote social mobility and geographical mobility is low –
should take due account of the role played by contextual factors and by the quality of
the students entering the educational system.
1 The authors verify educational outcomes in terms of the initial salaries of the graduates from the
The assumption of this exploratory study is that students constitute both the
fundamental input to tertiary educational processes and their output. Consequently,
referring in abstract to the ‘quality of universities’ without considering the quality of
their students is methodologically inappropriate [Zhang, 2009], especially in the
presence of high variability in the quality of secondary schools and the limited mobility
of students. National and international surveys on the quality of primary-level learning
(PISA, INVALSI] not only confirm the important role played by the socio-economic
context but also depict a highly diversified pattern in Italy – both geographically and by
type of school [Montanaro 2008]. This heterogeneity has distant origins also related to
delays in educational processes, and especially in primary schooling [Bertola and
Sestito 2011], which inevitably weighs on the performance of the secondary and tertiary
education system and extends beyond differences of a socio-economic nature between
geographical area and families of origin.
The analysis that follows is based on joint use of the results from the CISIA test, as
indicative of the real quality of incoming students, and of AlmaLaurea data as regards
the other variables. The standardized CISIA test2 verifies the extent to which
matriculants in engineering possess the basic skills (logic, mathematics and sciences). It
has the merit of absorbing the effects and interactions between subjective traits and
contextual factors, yielding a measure of cognitive and non-cognitive skills at an age
when they should be consolidated and stabilized. In view of the relatively low mobility
among regions of matriculating students as revealed by the data, the average CISIA
score, available only at aggregate level, can be interpreted as a proxy for the real
2
average quality of the human capital possessed by the matriculants at a given
engineering faculty.
The following analysis considers 24 engineering faculties of the 22 public universities
belonging to the Almalaurea and CISIA consortia: Bari Politecnico, Basilicata,
Bologna, Cagliari, Calabria, Cassino, Catania, Cesena e Forlì, Ferrara, Firenze,
Modena, Napoli Seconda Università, Perugia, Reggio Calabria, Reggio Emilia, Roma
Tre, Salento, Salerno, Sannio, Siena, Torino Politecnico, Trento, Trieste, Udine.
Section 2 briefly addresses issues concerning the measurement of students’ incoming
quality and their outgoing performance. Section 3 is devoted to the estimates and
discussion of the main results. Section 4 draws the main conclusions and implications.
Bearing in mind the limited aims of this exploratory exercise – which has no ambition
to furnish a model for the evaluation of universities – as well as the space available, it
will not be possible to give systematic treatment of the advantages and shortcomings of
systems which use added value to assess the quality of tertiary education. This is also
because such treatment would have to consider what are the objective functions of the
tertiary education system in relation to which it makes sense to identify productivity
measures.
2. Measuring students’ incoming quality and their outgoing performance
The first question that arises when setting out to measure the productivity of tertiary
education is how to select the indicators best suited to assessing the quality of students
at matriculation and their performance on graduation. What indicators have more
significance, together with less distortion due to the presence of non-observable factors?
2.1. Measuring incoming quality
The aim in this case is to select a standardized and reliable measure which absorbs all
the information relative to the learning potential of matriculants. The first candidate for
this function is the high-school diploma grade, which should furnish a scale of values.
However, the PISA and INVALSI educational attainment surveys raise doubts as to the
reliability of this metric because of marked regional differences in its use. These doubts
are confirmed by Figure 2, which shows, by region, the average scores on the CISIA
grade (scale on the right) in the corresponding year. This is a situation well known to
researchers, who find that schools in certain regions systematically over/underrate their
students in comparison with the results of standardized tests.
Incoming quality – with the limitations of the various indicators borne in mind – was
measured in three ways: the high-school diploma grade corrected (see section 4) on the
basis of the average CISIA score; the high-school diploma grade and the CISIA score
taken separately; the high-school diploma grade corrected on the basis of a procedure
which relativizes it to the distribution of grades by school and the graduate’s region of
provenance.3 The decision to correct the high-school diploma grade on the basis of the
average CISIA score was taken on the assumption that it reflects a relative scale of
matriculants’ skills and knowledge valid at local level but which is not usable on a
national scale. Thus calculated was a corrected or normalized indicator of the actual
quantity of human capital possessed by graduates at matriculation obtained by
multiplying the high-school diploma grade by the average score on the CISIA test
obtained by matriculants at a given faculty. This is evidently an approximation based on
the idea that students taking the test at a given faculty have homogeneous educational
backgrounds.
In the presence of high geographical mobility, the differences in quality among
incoming students may be due to endogenous processes of self-selection: the students
with most potential connected with better individual abilities, the quality of the
upper-secondary school attended, or a more favourable socioeconomic background, may be
induced to enrol at universities/faculties offering better opportunities for learning and
for employment. In this case, in order to avoid distortions in the estimates [Hanushek
1979; Heckman et al. 1999], and in particular underestimations of the value added of
the most valid universities/faculties, analysis should take account of the nature of the
self-selection processes. In view of this risk, a number of preliminary checks were
3 This is a measure developed by the AlmaLaurea researchers. The high-school diploma grade is purged
made. Their results did not support the conclusion that student mobility is characterized
by self-selection processes. In fact, comparison between the observable characteristics
of mobile and non-mobile students did not reveal statistically significant differences.4
2.2. Measures of outgoing performance
Outgoing performance can be measured in terms of both the quality of the university
career of students and graduates (dispersion rate, proportion of students earning a
certain number of university credits, duration of studies, regularity of academic career,
average examination grade, degree grade, effective learning verified by standardized
tests5, etc.) and labour-market entryby graduates.6 The choice of which measure to use
presupposes that clear agreement has been reached as to what the educational system
should offer to individuals and society. Except for tests on learning attainment, the
indicators of outgoing performance all suffer from the presence of non-observable
factors that may distort the significance of the measure selected. In fact, the average
examination grade, the degree grade, or the regularity of academic career may reflect
differences among the assessment methods used by universities.
If the objective of tertiary education is solely that of furnishing human capital
immediately usable by the production system, the labour-market entry of graduates
variously measured (for instance, by the employment conditions of the graduate X years
from graduation, the duration of job-searches, pay at X years from graduation, the type
of contract, the job relevance of the degree, the graduate’s degree of job satisfaction)
would constitute a non-distorted measure of performance, provided that account has
been taken of the uneven geographical distribution of employment opportunities – that
is, of local labour-market conditions7 and the mobility of graduates.
4
The test of differences among the means led to 99% rejection of the hypothesis that there were differences in socioeconomic background, high-school diploma grade, normalized high-school diploma grade (see note 5) or the type of school attended.
5 See in this regard the OECD’s AHELO (Assessment of Higher Education Learning Outcomes) project.
6 Ideally, verification should be made of occupational outcomes throughout the working life, especially if
the presence of a trade-off between short- and long-period employability is apparent as a function, for example, of the degree of specificity of the skills acquired from different educational programmes [Hanushek, Woessmann and Zhang 2011].
7
Given the general importance of the regularity of academic career and its specific
importance for the Italian university system [Brunello and Winter-Ebmer 2003; Bound
Lovenheim and Turner 2010], this latter measure of outgoing performance has been
selected here. It should be pointed out, however, that the regularity of academic career
should be measured by following the careers of matriculants. But, bearing in mind the
scant availability and reliability of data on such careers, and especially, the complexity
of university drop-out behaviour, it has been preferred to perform the estimates on
graduates.8 On the other hand, specific studies [Baldissera, Galeazzi and Petrucci 2010]
show that analysis by cohorts yields results comparable with those that obtained on the
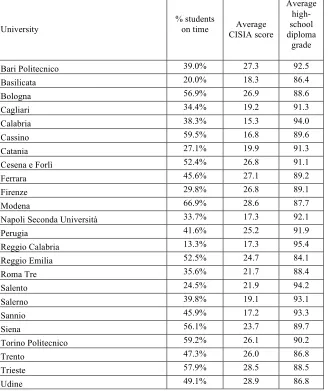
basis of graduates. The faculties surveyed, with their relative regularity rates calculated
by bachelor degree, are listed in Table 1.
Besides those already mentioned, another limitation of the exploratory exercises
derives from the fact that the CISIA test scores are available only as average values for
the faculty/university. They do not describe – nor are they intended to – relations of
causality, but rather simply ones of statistical association.
4. The effect of incoming quality on outgoing performance
It is likely that the university performance of students and, in particular, the time taken
by them to graduate, depend – cognitive capacity remaining equal – on the quality of
the academic institutions and, especially, on the quality of teachers and course
programmes, on the resources used directly and indirectly to support learning
(counselling and tutoring, study grants, accommodation, etc.), on the rigidity of the
selection criteria applied, and on employment opportunities, whose extent can be
approximated with the graduate unemployment rate or with pay levels in the local
labour market – both of which are factors that influence the opportunity-cost of the time
devoted to study [Light and Strayer 2000; Zhang 2003; Cappellari and Lucifora 2009].
On the basis of these hypotheses, the aim of the estimates reported here was to
determine the factors which explain the regularity of academic career, and especially the
production system due to institutional factors. Although this is a question of major importance, it cannot be addressed here.
8
weight exerted by the quality of incoming students. On the basis of the findings of a
large body of literature on the topic, and of preliminary analyses, besides the student’s
quality on matriculation, the other variables considered were the following: the
educational qualifications of the parents; jobs undertaken by the graduate during his/her
time at university and its influence (worker-student and student-worker); the time taken
to complete the degree thesis; the motives inducing the graduate to attend university
(cultural or professional); intentions regarding postgraduate studies; the assessments
made by graduates on the quality of their relationship with academic staff; the average
students/lecturer ratio during the first-degree course;9 the average regional
unemployment rate for the 15-24 age group in both the region of residence and the
region of the university faculty attended; and a fixed effect for the 24 universities. Two
control variables were introduced to control for self-selection due to mobility: the first
of them concerned regional mobility if the student was enrolled at university in a region
different from that of residence; the second was relative to provincial mobility.
The problem of the variability of selection standards was particularly complex. To
capture its effect, it was assumed that such variability affects all aspects of university
performance (regularity of academic career, examination grades, and degree grade), and
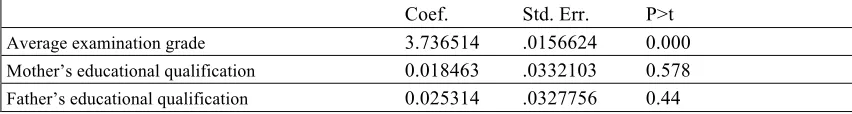
that it impacts especially on the degree grade. On this basis, an OLS model was used to
estimate the determinants of the degree grade, including, with the purpose of capturing
the ‘selection standards’ variable,10 the fixed university effects. The coefficients thus
obtained, associated with variables significant to at least 10% level – excluding those
relative to the fixed effects – were used to obtain an ‘undistorted’ measure of the grade
expected (Table 3). The difference between the actual degree grade and the one thus
calculated was then used as a proxy for the effects of rigour in selection criteria on an
individual student’s career (laxness effect).
As said, the measures of the incoming quality of graduates at the time of matriculation
should have absorbed large part of the effects connected with family background and
non-cognitive skills. It is therefore likely that the variables characterizing the latter
9 This is an indicator that varies according to the year of matriculation. It was chosen on the idea that,
taking account of the current system of funding allocation, the overall absorption of resources is correlated with the endowment of academic staff.
10 If selection standards are homogeneous, the fixed effects should not be significant. However, this was
(parents’ educational qualifications and social class; students’ motivations) have a
limited explanatory capacity. As we shall see, the exploratory analyses and the estimates
performed appear to confirm this assumption.
On the basis of these conjectures and preliminary calculations, estimation was made
of a probit model in which the dependent variable was the likelihood that the graduate
had been regular in his/her academic career or, alternatively, had graduated with a
delay of one or two years.11 The sample consisted of 5182 first-degree graduates
enrolled in the 2005/6, 2006/7 and 2007/8 academic years and who completed their
degree courses in the 2009/10 academic year. The CISIA score was calculated as the
average of the 2005/6, 2006/7 and 2007/8 academic years – these being the only years
for which data were available.
The independent variable in the first three models estimated was only the quality of
human capital at matriculation measured in the three ways described (high-school
diploma grade + average CISIA test score, average CISIA score multiplied by the
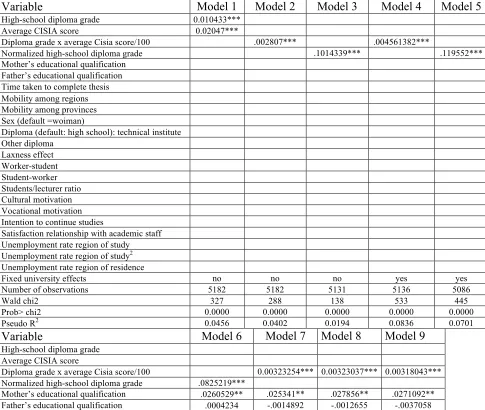
high-school diploma grade, normalized high-high-school diploma grade). Further explanatory
variables were then added, taking into account that the average CISIA score does not
allow the introduction of the fixed university effects. Table 4 sets out the results.
The variables significant to at least 10% exhibit the expected sign, except for the
unemployment rate in the region of the university attended. All the measures of the
quality of human capital on entry are significant to at least 1% level in all estimates. In
particular, the score on the CISIA test, which is considered more accurately to reflect
the learning potential of matriculants, has marked effects on the regularity of academic
career. It should be pointed out that the estimates made on the basis of the two different
ways to correct the high-school diploma grade yielded entirely similar indications. In
model (7), one point more than the average score on the CISIA test determined an
increase in the probability of graduating on time equal to 2.1% for a diploma-holder
with the minimum grade (66) and to 3.2% for a diploma-holder with the grade of 100
[1% significant level]. Hence, in this latter case, an increase in the score of one standard
deviation determines a 12.8% increase in the probability.
11
Among the variables imputable to teaching quality, the results confirm – within a
general pattern of this indicator’s high variability among universities – the positive
contribution of the student/lecturer ratio to the regularity of academic career [1%
significance level]. Also positive and highly significant is the contribution of the
perceived quality of relations between lecturers and students [1% significance level].
There may be various explanations for this result. Firstly, it may depend on the fact that
culturally motivated graduates are also those who most appreciate good relations with
academic staff. Secondly, the cause may be the fact that more capable teachers are
better able to motivate their students. The finding that the coefficient is still significant
when also controlling for motivation seems to confirm the latter hypothesis.
Also borne out is the hypothesis that the presence of heterogeneity in selection criteria
(laxness effect) contributes to explaining the variability of outgoing performance [1%
significance]: in particular, as expected, more generous criteria are associated with a
higher probability of graduating on time.
Whilst the prevalence of cultural motivations in the choice of academic programme,
compared with both cultural and professional motivations, exerts a positive effect on
regularity [5% significance], the prevalence of vocational motivations exerts a negative
effect [5% significance]. As expected, the effect of the ‘intention-to-continue-studies’
variable is both positive and significant [1%], and associated with this variable is a 24%
increase in the probability of graduating on time.
As might be expected, a job has a negative impact on the regularity of academic
career [5% significance], especially in the case of worker-students (-20%), whereas in
the case of student-workers the decrease in the probability of graduating on time is
rather small (-4.8%). Also of interest is the effect on the unemployment rate. Firstly, the
estimates show that both the unemployment rates considered are significant, with a
decidedly greater impact of the region of university attendance. Hence, the
labour-market conditions in the area where the university is situated seem to have greater
influence on the behaviours of students than the area of residence. Secondly, whilst the
relation with the unemployment rate in the region of residence is, as expected, negative,
the relation with the unemployment rate in the region of the university attended is
positive and non-linear: it is positive for unemployment rates lower than around 28%
first concerns the fact that, as the unemployment rate decreases, so job opportunities
while attending university increase – an explanation borne out by the fact that the
incidence of work while studying is greater in the universities of the Centre-North: a
greater propensity to work evidently has a negative effect on the regularity of academic
career. The second explanation concerns the idea that, in local labour markets with
higher unemployment, where job-search processes are longer and more complex, the
value of the ‘graduated on time’ signal increases. Overall, the expected negative effect
due to the lower opportunity cost of time is therefore off-set by these two positive
effects for values of the unemployment rate less than 28%.
Confirming the above-discussed conjectures, mobility is not an explanatory variable
for differences in outgoing performance.
The fixed university effects are almost all significant at 1% level. Taking account of
the limited time horizon considered, they can be considered approximate measures of
the added value of universities – that is, their net contribution to the regularity of
academic career by their graduates. On the basis of this measure obtained from model
(9) but also substantially confirmed by model (6), verification was made of whether and
to what extent the ranking of universities changed in comparison with the one based on
the raw data – that is, the actual rates of regularity. This comparison evidenced
substantial differences between the two rankings: the absolute mean variation of
positions was 7.5, with a maximum of 21 positions of difference.12
3. Conclusions and implications
This econometric exercises show that the quality of learning at upper-secondary school
has a significant impact on the regularity of academic career by matriculants at
engineering faculties. Teaching quality and selection standards remaining equal, if the
average score achieved on the CISIA entry test by a student with average characteristics
increases by one standard deviation, then his/her probability of graduating on time
increases by 12%. The most immediate implication of this result is that, once the
outgoing performance of graduates has been purged of the effects of the quality of the
incoming students and of the other significant factors, the ranking of universities in
terms of their students’ regularity of academic career changes radically in comparison
with the regularity in the absence of such adjustment.
The classification thus obtained has indubitably been distorted by heterogeneity
among the assessment standards of faculties not captured by the empirical models used.
Yet this shortcoming does not affect the overall validity of the lesson to be learned from
the exercise: namely, that not taking account of the quality of incoming students may
distort the evaluation of the university system and, consequently, the allocation of funds
on the basis of meritocratic criteria.
The essential issue often evaded when the quality of educational systems is discussed
is that students are both the fundamental inputs and outputs of educational processes
[Light and Strayer, 2003]. Hence, referring in abstract to the ‘quality of universities’,
without considering the quality of the latter in the presence of scant student mobility, is
methodologically inappropriate. These considerations also apply, albeit to a lesser
extent, to the output and assessment of university research, the quality of which depends
at least partially on the quality of the feedbacks between teaching and research.
Measures of the outgoing performance of students and graduates are of great interest
to families, universities, and firms, but they should be given less importance by
policy-makers intending to use them to allocate funds. Just as a firm is interested in strategies
to increase its added value more than sales by employee, so policy-makers should be
interested in allocating public resources according to the capacities of universities to
enhance their inputs, rather than on the basis of results concerning their outputs
(dispersion rate, regularity of academic career, labour-market entry, etc.). It is no
coincidence that an educational system’s performance is most commonly measured on
the basis of value added in countries where the culture of assessment is more
consolidated.
These conclusions acquire greater value with the transition from tertiary education
systems characterized by strong homogeneity among matriculants to systems with
broader entry – like those towards which the OECD countries and Europe have been
moving in the past twenty to thirty years, and which are inevitably characterized by
greater heterogeneity. This prospect has been confirmed by the Europe 2020 document,
In the presence of significant differences among starting conditions, there is a risk
that the superficial use of assessments based on outgoing performance indicators, and
thus conditioned by the scant availability of information and its cost, will, on the one
hand, reward universities which, though not particularly virtuous, enjoy more
favourable conditions and, on the other, remove valuable resources – in a chronically
under-funded system – from universities which, though situated in more disadvantaged
areas, operate virtuously.
Meritocratic criteria in the allocation of public funds among schools and universities
which do not take account of these considerations, in the absence of effective means to
support the right to study (especially in the form of grants and an adequate university
building programme) would exacerbate the polarization of the educational systems.
They would penalize the least mobile students, regardless of their talent, and especially
those from the more disadvantaged social groups, and schools/universities in more
backward areas independently of the merits/deficiencies of their personnel. In this
regard, it should be borne in mind that mobility is due not only to economic factors but
also to social and cultural barriers on which the introduction of economic incentives
would have little effect. Empirical evidence on the concreteness of these risks, in a
high-mobility country like the USA, has been provided by Bound, Lovenheim and Turner
[2010] in an article which shows how the longer time taken to graduate by
disadvantaged social groups is due in large part to cutbacks in the resources made
available to the public educational institutions in the USA.
The problem is made even more urgent, in some countries like Italy, by the fact that,
for numerous universities, the lower quality of incoming students is associated with
fewer opportunities to acquire funding through both external sources and increased
university fees. Thus, in practice, the distribution of resources is already
disproportionately tipped against those universities regardless of their productivity.
These considerations would be less important in countries characterized by high rates
of graduation, and if both increased access to tertiary-level studies and the promotion of
social mobility were not given priority over the pursuit of excellence and the
enhancement of talents. This latter strategy would not entail relinquishing a socially
REFERENCES
Aina C. Baici E. and Casalone G. 2010, Time to degree: students’abilities, university characteristics from what else? Evidence from Italy, WP March.
Baldissera A., Galeazzi S. e Petrucci A. 2010, Regolarità degli studi prima e dopo la riforma, Profilo dei laureati italiani, in Consorzio Interuniversitario AlmaLaurea (a cura del), XI Profilo dei laureati italiani. Valutazione dei percorsi formativi nell’Università a dieci anni dalla Dichiarazione di Bologna, Il Mulino.
Barron’s. 1988, Barron’s profiles of American colleges. Barron’s Educational Series Inc. 16th ed. Hauppauge, NY.
Bertola G. e Sestito P. 2011, A comparative perspective on Italy’s human capital accumulation, Quaderni di storia economica (Economic History Working Papers), Banca d’Italia, n. 6, ottobre.
Bound J., Lovenheim M.F and Turner S. 2010, Increasing time to baccalaureate in the United States, NBER Working Papers, n. 15892.
Brunello G. and Winter-Ebmer R. 2003, Why students expect to stay longer in college? Evidence from Europe, Economics Letters, 80: 247-253.
Cappellari L. and Lucifora C. 2009, The “Bologna Process” and the college enrollment decisions, Labour Economics, 16:638-647.
Cipollone P. Montanaro P. e Sestito P. 2010, Misure di valore aggiunto per le scuole superiori italiane: i problemi esistenti e alcune prime evidenze, Banca d’Italia, Temi di discussione, n. 754, marzo.
Cunha F. and Heckman J. 2007, The Technology of Skill Formation, American Economic Review, vol. 97[2]: 31-47.
Hanushek E. A. 1979, Conceptual and empirical issues in the estimation of education production functions, Journal of Human Resources, 14: 351-88.
Hanushek, E. A., and Woessmann L. 2008, The role of cognitive skills in economic development, Journal of Economic Literature, 46, n. 3 : 607-688.
Hanushek E. A., Woessmann and Zhang L. 2011, General education, vocational education, and the labor-market outcomes over the life cycle, NBER Working Papers, n. 17504.
Hanushek, E. A., and Woessmann L., 2012, Do better school lead to more growth? Cognitive skills, economic outcome and causation, Journal of Economic Growth, 17, n. 4, 267-321.
Kreutzer D.V. and Wood W.C. 2007, Value-Added Adjustment In Undergraduate Business School Ranking,Journal of Education for Business, July/August: 357-361.
Heckman J., Layne-Farrar A. and Todd P. 1996, Human capital pricing equations with an application to estimating the effect of schooling quality on earnings, The Review of Economics and Statistics, 78 n.4: 562-610.
Light A. and Strayer W. 2003, Determinants of College Completion: School Quality or Student Ability?, The Journal of Human Resources, XXXV, 2: 299-332.
Lockwood J.R., Louis T.A. e McCaffrey D.F. 2002, Uncertainty in Rank Estimation: Implications for Value-Added Modelling Accountability Systems, Journal of Educational and Behavioural Statistics, n. 27, 3: 255-270.
Montanaro P. 2008, I divari territoriali nella preparazione degli studenti italiani: evidenze dalle indagini nazionali e internazionali, Banca d’Italia, «Questioni di Economia e Finanza, n. 14.
Rothstein J. 2009, Student Sorting and Bias in Value-Added Estimation: Selection on Observables and Unobservables, Education Finance and Policy, Fall 2009, vol.4, n.4: 537-571.
Rothstein J. 2010, Teacher Quality in Education Production: Tracking, Decay and Student Achievement, Quarterly Journal of Economics, vol. 125, n. 1, 175-214.
Todd P.E and Wolpin K.E. 2003, On the specification and estimation of the production function for cognitive achievement, Economic Journal, 113: F3-F33.
Zhang J. 2009, A value-added estimate of higher education quality of US states, Education Economics, vol.17, 4: 469-89.
17 F IG U RE 1. T he pyra m id of t he e duc at ion produc tion c ha in U RE 2. CIS IA s core s (P T ) a nd hi gh-s chool di pl om a gra de s (V D IP
) by re
gi
on
PT
VD
IP
PUNTEGGI E VOTI DI
DIPLOM
A
PER REGIONI
FRIULI VENEZIA GIULIA
TRENTINO ALTO ADIGE
VENETO
MARCHE
EMILIA RO MAGNA
PUG LIA LIGURIA ABBRUZZO UMBRIA LOMBARDIA TOSCANA VALLE D'AOSTA PIEMONTE LAZIO MOLISE BASILICATA CAMPANIA SICILIA SARDEGNA ESTERA CALABRIA NAZIONALE
[image:18.595.240.499.99.496.2]TABLE 1. Shares of students graduating on time, average CISIA scores and high-school diploma grades by faculty
University
% students
on time Average CISIA score
Average high-school diploma
grade
Bari Politecnico 39.0% 27.3 92.5
Basilicata 20.0% 18.3 86.4
Bologna 56.9% 26.9 88.6
Cagliari 34.4% 19.2 91.3
Calabria 38.3% 15.3 94.0
Cassino 59.5% 16.8 89.6
Catania 27.1% 19.9 91.3
Cesena e Forlì 52.4% 26.8 91.1
Ferrara 45.6% 27.1 89.2
Firenze 29.8% 26.8 89.1
Modena 66.9% 28.6 87.7
Napoli Seconda Università 33.7% 17.3 92.1
Perugia 41.6% 25.2 91.9
Reggio Calabria 13.3% 17.3 95.4
Reggio Emilia 52.5% 24.7 84.1
Roma Tre 35.6% 21.7 88.4
Salento 24.5% 21.9 94.2
Salerno 39.8% 19.1 93.1
Sannio 45.9% 17.2 93.3
Siena 56.1% 23.7 89.7
Torino Politecnico 59.2% 26.1 90.2
Trento 47.3% 26.0 86.8
Trieste 57.9% 28.5 88.5
[image:19.595.88.417.171.562.2]TABLE 2. Descriptive statistics
Variable Observation Mean/frequency
Standard
dev. Min Max
Students on time 5182 0.476457 0.4994936 0 1
Mother’s educational qualification: no reply 5182 0.0144732 0.1194423 0 1 Mother’s educational qualification: none 5182 0.0061752 0.0783471 0 1 Mother’s educational qualification:
elementary certificate 5182 0.0453493 0.2080891 0 1
Mother’s educational qualification:
lower-secondary certificate 5182 0.2271324 0.4190193 0 1
Mother’s educational qualification:
upper-secondary diploma 5182 0.4884215 0.4999142 0 1
Mother’s educational qualification: degree 5182 0.2184485 0.4132332 0 1
Average CISIA test score 5182 2.443915 4.031922 15.31 28.99
Time taken to complete thesis (months) 4738 3.379485 1.743754 1 24
High-school diploma grade 5182 90.29718 1.063003 60 100
Regional mobility 5182 0.2005017 0.4004144 0 1
Mobility among provinces 5182 0.4500193 0.4975437 0 1
Father’s educational qualification: no reply 5182 0.0148591 0.1210007 0 1 Father’s educational qualification: none 5182 0.0050174 0.0706623 0 1 Father’s educational qualification:
elementary certificate 5182 0.0447704 0.2068193 0 1
Father’s educational qualification:
lower-secondary certificate 5182 0.2473948 0.4315398 0 1
Father’s educational qualification:
upper-secondary diploma 5182 0.4540718 0.4979342 0 1
Father’s educational qualification: degree 5182 0.2338865 0.4233417 0 1 Satisfaction relationship with academic staff 5182 3.977229 0.5977686 1 5 Unemployment rate 15-24 years region of
study 5197 21.02 10.11752 7.3 40.3
Unemployment rate 15-24 years region of
residence 5158 22.09 10.23336 7.3 40.3
Students/lecturer ratio 5182 27.94724 4.014305 15 37
Graduates/matriculants ratio 5182 47.58456 9.653872 18.2 81
Sex 5182 1.249518 0.4327756 1 2
Classical high school diploma 5181 .0521135 .2222773 0 1
Scientific high school diploma 5181 .6352056 .4814189 0 1
Technical institute diploma 5182 0.2886916 0.453198 0 1
Other diploma 5182 0.0102277 0.1006234 0 1
Average examination grade 5182 25.38593 1.931394 18 30
Worker-student 5165 0.0118103 0.1080418 0 1
Student-worker 5165 0.5512101 0.4974188 0 1
Importance of cultural motivation 5164 1.712239 0.4527632 1 2
Importance of vocational motivation 5159 1.730762 0.443607 1 2
TAB. 3. Degree grade estimation model
Coef. Std. Err. P>t
Average examination grade 3.736514 .0156624 0.000
Mother’s educational qualification 0.018463 .0332103 0.578
Normalized high-school diploma grade 0.098857 .0340454 0.004
Cultural motivation 0.112996 .0583714 0.000
Vocational motivation 0.107508 .059226 0.07
Worker-student -0.72192 .2448252 0.003
Student-worker -0.08925 .0530902 0.000
Intention to continue studies 0.507028 .1239201 0.000
Constant 3.493664 .4922992 0.000
Fixed university effects yes
Number of observation 5091
F( 33, 5057) 2471.32
Prob > F 0.0000
R-squared 0.9416
[image:21.595.87.572.340.750.2]Adj R-squared 0.9412
TABLE 4. Results of the estimates (marginal effects = dF/dx)
Variable Model 1 Model 2 Model 3 Model 4 Model 5
High-school diploma grade 0.010433***
Average CISIA score 0.02047***
Diploma grade x average Cisia score/100 .002807*** .004561382***
Normalized high-school diploma grade .1014339*** .119552***
Mother’s educational qualification Father’s educational qualification Time taken to complete thesis Mobility among regions Mobility among provinces Sex (default =woiman)
Diploma (default: high school): technical institute Other diploma
Laxness effect Worker-student Student-worker Students/lecturer ratio Cultural motivation Vocational motivation Intention to continue studies
Satisfaction relationship with academic staff Unemployment rate region of study
Unemployment rate region of study2 Unemployment rate region of residence
Fixed university effects no no no yes yes
Number of observations 5182 5182 5131 5136 5086
Wald chi2 327 288 138 533 445
Prob> chi2 0.0000 0.0000 0.0000 0.0000 0.0000
Pseudo R2 0.0456 0.0402 0.0194 0.0836 0.0701
Variable Model 6 Model 7 Model 8 Model 9
High-school diploma grade Average CISIA score
Diploma grade x average Cisia score/100 0.00323254*** 0.00323037*** 0.00318043*** Normalized high-school diploma grade .0825219***
Time taken to complete thesis -.0339655*** -.0345911*** -.0335619*** -.0344663***
Mobility among regions .0232654 .027305 .0290692 .03222587
Mobility among provinces -.12046 -.0140839 -.016818 -.016242
Sex (default =woiman) -.018982 -.0318765 -.0315165 -.0295291
Diploma (default: high school): technical institute -.1251850*** -.1115153*** -.1077563*** -.1055233***
Other diploma .-1970871** -.1935436** -.1891509** -.1854622**
Laxness effect .0391198*** .0368793*** .0358162*** .0367818***
Worker-student -.2024576** -.1883649** -.1947163** -.2048117**
Student-worker -.0472653** -.0417852* -.0450216** -.0478308**
Students/lecturer ratio -.1646115*** -.1661474*** -.1679859***
Cultural motivation .0365749* .0359484* .0504265** .049493**
Vocational motivation -.045779** -.0436516** -.0400909* -.0429317** Intention to continue studies -.2444911*** -.2450889*** -.2447923*** -.2445061*** Satisfaction relationship with academic staff .0709349*** .0713582***
Unemployment rate region of study .0810372*** .8089471*** .810715*** .8063813*** Unemployment rate region of study2 -0.149106*** -.0148601*** -.0148853*** -.0146425*** Unemployment rate region of residence -.0055868*** -.0063887*** -.0061919*** -.0062262***
Fixed university effects yes yes yes yes
Number of observations 4621 4621 4621 4621
Wald chi2 2311 2293 2292 2092
Prob> chi2 0.0000 0.0000 0.0000 0.0000
Pseudo R2 0.3694 0.3732 0.3702 0.3629