http://www.scirp.org/journal/jgis ISSN Online: 2151-1969
ISSN Print: 2151-1950
Predict the Future Hospitalized Patients
Number Based on Patient’s Temporal and
Spatial Fluctuations Using a Hybrid ARIMA
and Wavelet Transform Model
Shundong Lei
Information Management Department, West China Second University Hospital, Sichuan University, Chengdu, China
Abstract
Relative to hospitalized patient information, outpatient admission informa-tion is relatively simple. It only includes the patient admission time, place of residence and other information. Traditionally, the excavation of this infor-mation is not sufficient. However, when a large number of patients admitted time and residence information combined to consider, and add some data mining technology, some of the previously ignored regular information is likely to be found. Using 5 years of data mining research and admission data from a paediatric department at a large women’s and children’s hospital in China, we found important fluctuation rules regarding admissions using wavelet analysis on hospital admission data among different scales of cyclical fluctuations. Method: Seasonal distribution of patient number was analysed based on Haar wavelet transformation, and level 3 and level 2 of wavelets were extracted out to fit the data. The distribution function of hospitalized patients was visualized by kernel density estimation. Using linear regression and ARIMA (autoregressive integrated moving average model) predict the sea-sonally number of patients in the future. Results: The data analysis demon-strates the total surge of inpatients was decomposed into one mother wavelet and five small wavelets, each of which represents different time frequency. Be-sides, as distance from hospital increases, the number of patients decreased exponentially. The seasonal factors are the largest time factor influencing the number changes of patients. Conclusion: By wavelet analysis and the im-proved prediction model, we could make forecast on the future inpatient number trend and prove factors such as geographic position is influential on inpatient amount. Additionally, the concept of data mining based on spatial distribution and spectral analysis could be applied to other aspects of social management.
How to cite this paper: Lei, S.D. (2017) Predict the Future Hospitalized Patients Number Based on Patient’s Temporal and Spatial Fluctuations Using a Hybrid ARIMA and Wavelet Transform Model. Journal of Geographic Information System, 9, 456-465.
https://doi.org/10.4236/jgis.2017.94028
Received: May 28, 2017 Accepted: August 7, 2017 Published: August 11, 2017
Copyright © 2017 by author and Scientific Research Publishing Inc. This work is licensed under the Creative Commons Attribution-NonCommercial International License (CC BY-NC 4.0). http://creativecommons.org/licenses/by-nc/4.0/
Keywords
Medical Resources, Data Mining, Multi-Scale, ARIMA, Wavelet Transform Spatial Distribution
1. Introduction
Pretending changes in patient number and observing spatio-temporal patient distribution have been fundamental problems for hospital management. Many studies indicate that the patient spatio-temporal distribution contains important management information. Until now, most researches about patient admission are focused on simulation of disasters and public security incidents [1]. Few stu-dies have focused on distribution of emergency resources. Hung’s group re-ported traffic accident black spots in Hanoi and Vietnam using linear regression to determine a relationship between the black spot and an emergency distribu-tion [2] [3]. These studies help us understand medical resource distribution and demand, but often, clinical activity is more related to diagnosis and patient treatment, so patient allocation and fluctuation represent challenges to alloca-tion of medical resources.
To create a systematic analysis of routine medical procedures, two dimensions must be considered: time and space. For time, patients admitted to hospitals are influenced by days, weeks, or seasons, epidemics, and economic development. The probability of a patient admission during a specific time period can prompt the next period of probability of the patient’s admission, so sequence analysis tools are required to analyze patient’s admittance and machine-learning can as-sist with this process.
For spatial dimensions, patients in different regions are likely to have different medical needs. Selvin’s studies suggest that patients from proximal regions are likely to have common diseases and patients from remote regions are likely to have chronic or rare diseases [4]. Patients from remote regions often expect a diagnosis which is a challenge to treatment. If we could understand patient dis-tribution in time and space, we could better allocate medical resources and create an intelligent hospital management system based on big data.
To build a contemporary distribution for the forecast, the relationship be-tween influencing factors and spatio-temporal distribution of hospitalized pa-tients must be understood. Factors that influence hospitalized papa-tients vary from economic development, education, population structure, and distance to the hospital [5] [6]. Therefore, technology to assess hospital needs should integrate these for more accurate medical resource distribution.
non-linear processing units for feature extraction and transformation. Each succes-sive layer uses the output from the previous layer as input. Algorithms may be supervised or unsupervised and applications include pattern analysis (unsuper-vised) and classification (super(unsuper-vised).
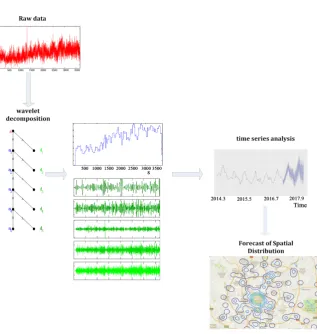
Wavelet analyzation is based on unsupervised learning of multiple levels of features or representations of data. Higher-level features derived from lower lev-el features were used to form a hierarchical representation. These definitions have common multiple layers of nonlinear processing units and supervised or unsupervised learning of feature representations in each layer, with the layers forming a hierarchy from low- to high-level features [2]. The composition of a layer of nonlinear processing units used in a deep learning algorithm depends on the problem to be solved. Layers used in deep learning include hidden layers of an artificial neural network and sets of complicated propositional formulas [3]. They may also include latent variables organized layer-wise in deep generative models such as the nodes in Deep Belief Networks and Deep Boltzmann Ma-chines. Overall, with these methods, multivariate analysis of the whole system can forecast future development and provide solutions for admission data (Figure 1).
Figure 1. Wavelet analysis was performed on raw data representing the fluctuation of
[image:3.595.216.534.346.681.2]2. Experimental (Mathematical Formulas,
Tables and Equations)
2.1. Data Acquisition
Data from Sichuan University West China Second Hospital from 2010-2015 were collected that contained patient’s admissions time, address, attending phy-sician name, reason for admission, diagnosis, and outpatient service check list. Patient names were de-identified with md5 encrypted desensitization. Patient communication address was anonymized using a key figure encrypted method.
2.2. Seasonal Distribution Analysis Based on Wavelet Transform
Count the segmented numbers of hospitalized children every 8 hours, and re-cord the other information about admissions time, address, reason for admis-sion, diagnosis into the comma-separated values (CSV) files. Using the Matlab wavelet toolbox to import the data, select Haar wavelet to decomposition, Select the best wavelet basis for compression at decomposition level 5, and chose a proper threshold for de-noising. Exporting one main wave (a1), and 5 levels of
wavelet (d1 - d5). Use the histogram for distribution observation. And the
fre-quent pattern mining also is approached to find the law of the wavelet.
2.3. Spatial Distribution
Using the map of China’s largest service providers, a map (NASDAQ: a map), the longitude and latitude of the patient can be obtained and the density can be calculated to estimate data distribution using Botev’s method [1]. Specifically, using the front Haar wavelet decomposition results, we found selections deviat-ing from Gaussian function biggest Haar decomposition level, and the level of the number of hospitalized patients as across-sectional observation unit. Using kernel density, the distribution function of the scales of hospitalized patients with spatial distribution were analyzed, and we gained influence on the fluctua-tion of the number of hospitalized patients with geographic locafluctua-tion informa-tion. The basic principle of kernel density estimation algorithm for spatial data is as follows:
Kernel density estimation is a fundamental data smoothing problem where inferences about the population are made based on a finite data sample. In some fields such as signal processing and econometrics it is also termed the Par-zen–Rosenbl at t-window method. This algorithm is often expressed as [1] [2],
( )
(
)
1 1
1 n 1 n
i
h n i
i i
x x
f x K x x K
n = nh = h
−
= − =
∑
∑
(1)where K(•) is the kernel—a non-negative function that integrates to one and has
mean zero—and h > 0 is a smoothing parameter called the band width.
2.4. Prediction and Machine Learning
density estimation on the space analysis, 5 years of pediatric admission data were extracted for different scales of fluctuation. Through the study of the spatial analysis of the data, we choose level 3 and level 2 of wavelet to fit the data dis-tribution, which represent 8 and 15 day intervals, which respectively represent the weeks (7 days) and half month (15 days) of the time periods. We used ARIMA and linear regression fitting to make predictions about the future.
3. Results and Discussion
3.1. Wavelet Transform
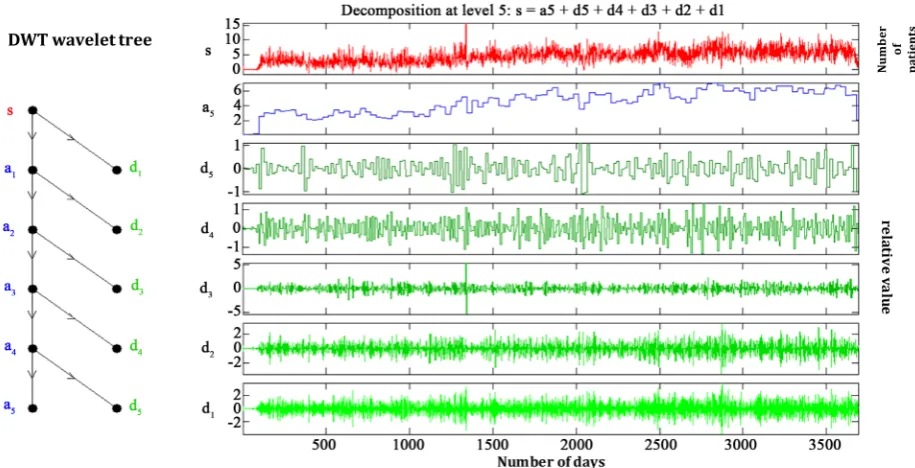
On the time scale, patients admitted to hospital after the waveform can be di-vided into one mother wave and five wavelets (Figure 2) and the signal may be represented on every frequency band of the form [f, 2f] for all positive frequen-cies f > 0. Then, the original signal can be reconstructed by a suitable integration over all the resulting frequency components. The frequency bands or subspaces (sub-bands) are scaled versions of a subspace at scale. Therefore, the following conclusions can be drawn from the above wavelet transform:
1) The whole surge of patients admitted was decomposed into one original (or mother) wavelet and 5 small wavelets.
2) Because 5 years is 1826 days, the Haar wavelet time period is derived from 2^n (n = 1, 2, 3, 4, 5) days. The largest wavelet is about 32 days of the time pe-riod, which is almost one month.
3) The corresponding Mother wavelet should be the overall trend of hospital admissions, so that as time goes on, admissions increase.
4) The 5th wavelet corresponds to admissions in days, which is almost a
nor-mal distribution (Figure 2).
Figure 2. Wavelet transformation of hospitalized patient number. Wavelet analysis was performed on raw data representing the
[image:5.595.68.526.466.700.2]3.2. Time and Space Distribution and Its Influencing Factors
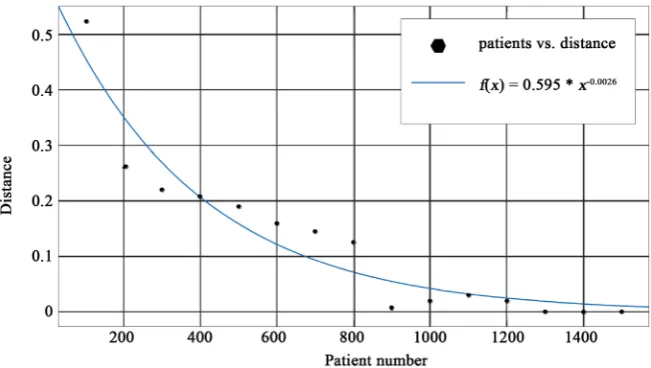
Using kernel density estimation, As the distance from the patient to the hospital gradually increased, the number of patients decreased exponentially, Using the Matlab®, CF tool toolbox, fit distance of patient from the hospital with the num-ber of patients within these distance, we get the typical fitting formula as follows:
( )
0.0026 0.595f x = ∗x− (2)
where f(x) is the patients number, and x is the distance to West China Hospital, the correlation coefficient (R^2) is 0.875 (Figure 3). Thus, hospitalized patients will gradually decrease with distance. Using wavelet transform, we obtained the wavelet scale for patients with the distribution fitting, from Haar wavelet from 1 - 5. The smallest scale wavelet (wavelet 5) can be considered as a random white noise, and there is no clear trend for the distribution of patient space in this scale. And with the scale, the third wavelets, second wavelets, it can be viewed as the monthly and seasonal distribution. Therefore, the month and season can be used as a larger distribution cycle to test the source of the patient’s space dis-tribution in Chengdu, in Sichuan, or in China (Figure 2).
3.3. Forecast for Patient Number
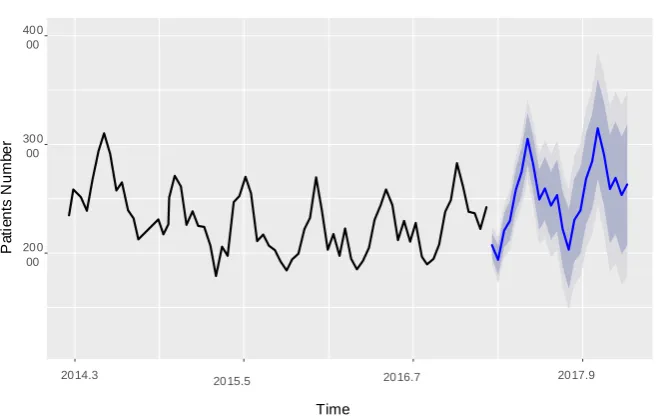
The ARIMA the forecast model suggests 3500 - 4700 patients per month, it will be described as follows (Figure 4 and Table 1). And under the short-term mod-ulation of patient’s number, wave 3 represents seasonal patterns of patient surges, so we used seasonal ARIMA models (SAM) to represent patients trend changes [7]. These data appear in Table 2.
3.4. Effect of Seasonal Rotation to Diseases and the
Prediction Model
[image:6.595.211.537.518.702.2]Classical ARIMA models are typically well-suited for short-term forecasts, but not for longer term forecasts due to the convergence of the autoregressive com-
Figure 3. With the increase in the distance of the patient’s residence, the number of
Figure 4. The fluctuation of patient number from Mar. 2014 to Dec. 2016 and the curve with shadow is on behalf of the forecast of volatility of patient number in future fitted by ARIMA and seasonal ARIMA.
Table 1. The results of the fitting.
Value
Coefficients (with 95% confidence bounds)
a= 0.5954 (0.4597, 0.7311) b= 0.002643 (0.003389, 0.001896)
SSE: 0.02698 R-square: 0.9078 Adjusted: 0.9007
SSE: 0.02698
R-square: 0.9078
Adjusted: 0.9007
RMSE: 0.04556
Table 2. ARIMA forecast result.
Ma1 Sma1
−0.4303 −0.5528
s.e. 0.1228 0.1784
ponent of the model to the mean of the time series. However, as mentioned above, the use of too short a time cycle causes random fluctuations. Therefore, the selection of a reasonable statistical cycle for correct statistical conclusions is essential.
However, according to the multi-scale theory, one random process under the one view can change the organized characteristic in other scales and show cor-responding laws. So, tools are needed to observe the time series in different scales. Wavelet analysis is suitable for efficiency in time [7] [8], or frequency (as harmonic, Shannon, Meyer) [9] [10] domain. In the time distribution, and the present random fluctuations inpatient admissions, using wavelet decomposition,
200 00 300 00 400 00
2014.3
2015.5 2016.7 2017.9
Time
P
at
ien
ts
N
u
m
be
r
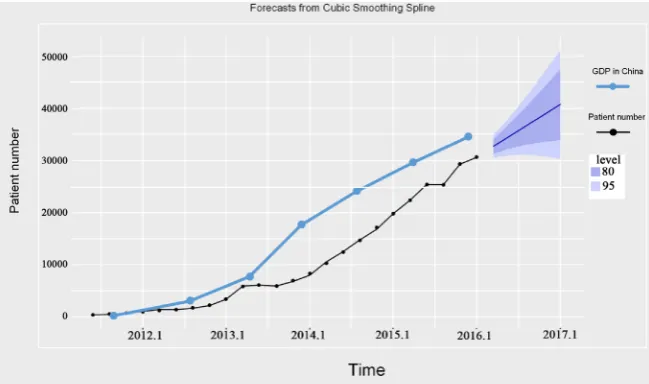
[image:7.595.207.541.517.567.2]patients with fluctuations in different scales have different rules. We calculate the correlation between GDP and the number of patients by at a specific point in time, the formula is:
(
)(
)
(
) (
2)
2i i
i i
X X Y Y
R
X X Y Y
− −
=
− −
∑
∑
(3)where Xi represents the number of patients in the i-th period, Yi represents the
GDP announced by the Chinese government at the end of the i-th period From the scale of the mother wave, growth in admissions increased over time in the manner of an accelerating index increase. This increase was closely related to China’s GDP growth (Figure 5). (R = 0.8826). ARIMA model can be used to predict future admissions. From 2nd and 3rd scale, the two scale can reflect the
number of patients on the monthly and quarterly changes, which is true for pe-diatrics. In autumn, patient admissions will decrease because of the school sea-son. Seasonal ARIMA models suggest that outpatients since the end of 2014 de-clined (Figure 4), suggesting that the classification system of the hospital may contribute to the patient count. However, this cannot be modeled with a clas-sical linear ARIMA fitting. With the ARIMA model the existing classification system of hospital patient decline due to seasonal and monthly differences did not have big fluctuations, and in 2017 the rebound was greater after October. This rebound needs attention (Figure 4).
3.5. The Spatial Distribution of Patients and Its
Influencing Factors
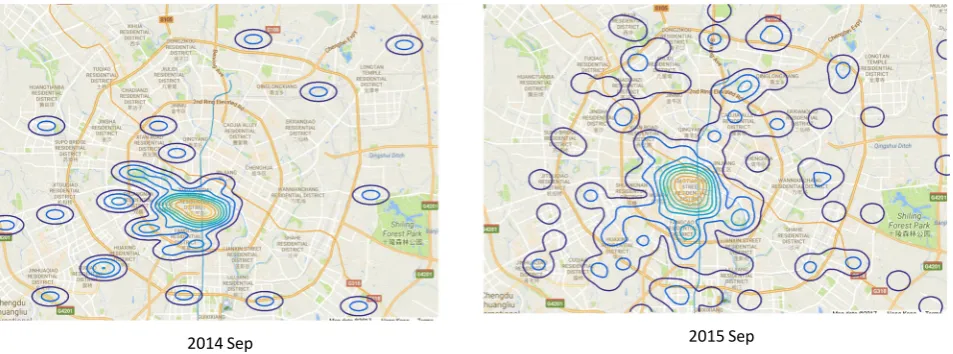
[image:8.595.211.536.522.714.2]Segmentation fitting shows that the number of hospitalized patients will de-crease exponentially with distance from the hospital, and these data agree with Wang’s group [11]. Specific to the urban area of Chengdu, after the implemen-tation of hierarchical treatment in 2015, patients in the urban distribution changed significantly. Patients decreased with increasing distance from the hos-
pital, and this decrease was exponentially distributed. The relationship with time is clear, too, and it indicates that patients from outer suburbs to the hospital primarily by time constraints. Elective patients will generally avoid peak enrollment in September. Spatial density analysis showed that after the imple-mentation of hierarchical diagnosis and treatment, distribution patient patterns change. In September 2015, hospitalized patient distribution is more concen-trated than that from September 2014, indicating that the change in spatial dis-tribution of the diagnosis and treatment system has been identified by the KDE (kernel density estimation) algorithm (Figure 6).
4. Conclusions
Multi-scale phenomena can be found in numerous natural events that occur over long time periods and within wide spaces. Multi-scale effects can be ana-lysed using multi-scale effects for complex fluctuations caused by complex fac-tors. As can be seen from our study, the number of growing patients presents some seasonal cyclical fluctuations and shows a trend of gradually increase. This spatial and temporal fluctuation poses a double challenge to the allocation of medical resources. In order to cope with this dual challenge, it is advisable to in-crease the supply of medical care in the surrounding area during the busy sea-son, where most patients with mild symptoms are able to seek medical attention nearby. In the winter and summer school vacation, hospital should increase the supply of elective outpatient clinics.
[image:9.595.61.538.537.714.2]Multi-scale phenomena can be realized with mathematical microscope-wave- let analysis. Through wavelet analysis and other predictive methods such as ARIMA, we analyse the time and spatial distribution of patients in a Chinese hospital over a five-year period. Data show that even a patient address can be useful information. The idea of data mining based on spectral analysis and spa-tial distribution can be extended to many aspects of social management such as education resource assessment, medical resources distribution assessment and future social resources planning.
Figure 6. The spatial distribution of patient in downtown of Chengdu in 2014 and 2015.
Acknowledgements
This project was supported by the funds of Strategic Innovation Funding of Science and Technology of SiChuan University. (No. 20160040321).
References
[1] Bayram, J.D., Sauer, L., Catlett, C.L., Levin, S., Cole, G., Kirsch, T.D., et al. (2013) Critical Resources for Hospital Surge Capacity: An Expert Consensus Panel. PLoS Currents, 5.
https://doi.org/10.1371/currents.dis.67c1afe8d78ac2ab0ea52319eb119688
[2] Hung, K.V. and Huyen, L.T. (2011) Education Influence in Traffic Safety: A Case Study in Vietnam. IATSS Research, 34, 87-93.
https://doi.org/10.1016/j.iatssr.2011.01.004
[3] La, Q.N., Lee, A.H., Meuleners, L.B. and van Duong, D. (2013) Prevalence and Fac-tors Associated with Road Traffic Crash among Taxi Drivers in Hanoi, Vietnam.
Accident Analysis & Prevention, 50, 451-455.
https://doi.org/10.1016/j.aap.2012.05.022
[4] Toor, M.R., Singla, A., Devita, M.V. and Michelis, M.F. (2014) Characteristics, Therapies, and Factors Influencing Outcomes of Hospitalized Hypernatremic Ge-riatric Patients. International Urology and Nephrology, 46, 1589-1594.
https://doi.org/10.1007/s11255-014-0721-2
[5] Koberich, S. and Farin, E. (2016) Factors Influencing Hospitalized Patients’ Percep-tion of Individualized Nursing Care: A Cross-SecPercep-tional Study. BMC Nursing, 15, 1- 11. https://doi.org/10.1186/s12912-016-0137-7
[6] Livera, A.M.D., Hyndman, R.J. and Snyder, R.D. (2009) Forecasting Time Series with Complex Seasonal Patterns Using Exponential Smoothing. Monash Econome-trics & Business Statistics Working Papers, 106, 1513-1527.
[7] Chen, C.F. and Hsiao, C.H. (1997) Haar Wavelet Method for Solving Lumped and Distributed-Parameter Systems. IEE Proceedings-Control Theory and Applications, 144, 87-94. https://doi.org/10.1049/ip-cta:19970702
[8] Lewis, A.S. and Knowles, G. (1991) VLSI Architecture for 2D Daubechies Wavelet Transform without Multipliers. Electronics Letters, 27, 171-173.
https://doi.org/10.1049/el:19910110
[9] Meyer, Y. (1991) Wavelets: Algorithms and Applications. Society for Industrial & Applied Mathematics, Philadelphia.
[10] Shannon, C.E. (1974) A Mathematical Theory of Communication. McGraw-Hill, New York.
[11] Wang, F. and Wei, L. (2005) Assessing Spatial and Nonspatial Factors for Health-care Access: Towards an Integrated Approach to Defining Health Professional Shortage Areas. Health & Place, 11, 131-146.
https://doi.org/10.1016/j.healthplace.2004.02.003
Submit or recommend next manuscript to SCIRP and we will provide best service for you:
Accepting pre-submission inquiries through Email, Facebook, LinkedIn, Twitter, etc. A wide selection of journals (inclusive of 9 subjects, more than 200 journals)
Providing 24-hour high-quality service User-friendly online submission system Fair and swift peer-review system
Efficient typesetting and proofreading procedure
Display of the result of downloads and visits, as well as the number of cited articles Maximum dissemination of your research work
Submit your manuscript at: http://papersubmission.scirp.org/