http://www.scirp.org/journal/gep ISSN Online: 2327-4344
ISSN Print: 2327-4336
Groundwater Potential Evaluation
in a Typical Basement Complex
Environment Using GRT Index
—
A Case
Study of Ipinsa-Okeodu Area,
near Akure, Nigeria
Igbagbo A. Adeyemo
*, Gabriel O. Omosuyi, Bosede T. Ojo, Abiola Adekunle
Department of Applied Geophysics, Federal University of Technology, Akure, Nigeria
Abstract
This study is aimed at evaluating groundwater potential of Ipinsa-Okeodu area, near Akure, Southwestern Nigeria. A multi-criteria model was developed for achieving this aim; the GRT model which is based on geology of each sounding point, resistivity, and thickness of the aquifer across the study area was successfully used to evaluate the aquifer potential of the area for future groundwater development programme in the area. Geophysical investigation involving vertical electrical sounding was carried out across the study area. A total of one hundred and two (102) vertical electrical soundings (VES) data were acquired using Schlumberger array with maximum half-current elec-trode separation of 150 m. Three to five geoelectric layers were delineated across the study area. The predominant curve types are KH, H, K and A. The maps of aquifer layer resistivity and aquifer layer thickness were generated and synthesized with the geology of the study area in producing the GRT model map/groundwater potential map. The groundwater potential map shows that the area is characterized by five groundwater potential zones; poor, low, moderate, good and high. The northwestern regions, north central and part of the southwestern regions are high groundwater potential zones, the northern and most part of southeastern zone are of moderate potential, while small portion in the southeastern and northern zones are of low groundwater po-tential.
Keywords
GRT-Model, Groundwater Potential Evaluation, Geology, Resistivity,
How to cite this paper: Adeyemo, I.A., Omosuyi, G.O., Ojo, B.T. and Adekunle, A. (2017) Groundwater Potential Evaluation in a Typical Basement Complex Environment Using GRT Index—A Case Study of Ipinsa- Okeodu Area, near Akure, Nigeria. Journal of Geoscience and Environment Protection, 5, 240-251.
https://doi.org/10.4236/gep.2017.53017
Received: January 15, 2017 Accepted: March 28, 2017 Published: March 31, 2017
Copyright © 2017 by authors and Scientific Research Publishing Inc. This work is licensed under the Creative Commons Attribution International License (CC BY 4.0).
Thickness
1. Introduction
Groundwater is the water stored in subsurface aquifers which are pore spaces or fractures in rocks or sediments. Groundwater is the only viable safe source of water in many remote areas where development of surface water is not econom-ically viable. Groundwater provides a reasonable constant supply of water since it is not completely susceptible to drying up under natural conditions unlike sur-face water [1]. Groundwater has been of continuous and tremendous use in irri-gation, industries and urban centers, as well as in rural communities. It is con-veniently available at point of use and possesses excellent quality that requires little or no treatment in most cases. There is inadequate supply of water at the study area, Ipinsa-Okeodu, near Akure Ondo State due to the continuous growth of this residential area, hence there is need for proper hydrogeophysical investi-gation of the area to enhance groundwater development programme in the area
[1].
In the basement terrain, groundwater development may be primarily re-stricted to the aquifer in the weathered overburden or complemented by frac-tured crystalline rocks which are mainly of Precambrian age [2] [3] [4]. The concealed basement rocks may contain faulted areas, incipient joints and frac-tured systems derived from earlier tectonic events. The delineation of these hy-dro geologic structures may facilitate the location of groundwater prospect zones in typical basement settings [5]. Fractured crystalline bedrocks remain good sources for drinkable water but sitting of highly productive wells in these rock units remains a challenging and expensive task because fractured developments on regional scale are both heterogeneous and anisotropic. Also fractured and viable aquifers wholly within the fractured bedrock are of rare occurrence be-cause of the typically low storability of fracture systems [6]. The availability of groundwater in these aforementioned rocks is largely due to the development of secondary porosity and permeability resulting from weathering and fracturing. In a typical hard rock setting, the geological stratification normally encountered consists of a hard rock basement overlain by variably thick unconsolidated ma-terials referred to as the overburden or the regolith. The overburden is further stratified into zones of aeration and saturation, separated by the water table [7].
synthesized using an existing approach that has been used in environmental stu-dies [14].
2. Study Area
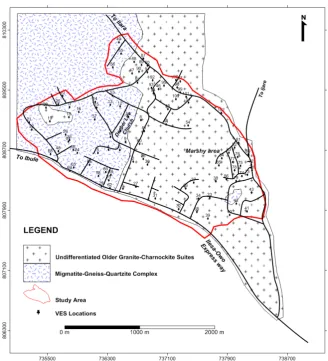
The study area covers Ipinsa-Okeodu area located in the northeastern boundary of Akure, Ondo State (Figure 1). The area spans within 735,000 and 739,200 m (Easting) and 806,000 and 810,600 m (Northing) based on Universal Traverse Mercatum System (Minna Datum) and it occupies a total area of about 4.7 km2
(Figure 1). The terrain across the study area is moderately to highly undulating
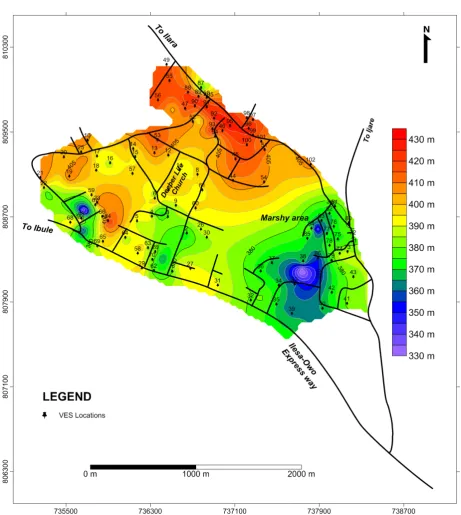
with surface elevation ranging between 330 and 430 m above sea level, while de-pressions zones are observed at the southeastern parts of the study area (Figure 2).
The area falls within the tropical rain forest region, with a climate characte-rized by wet and dry seasons. The vegetation in the study area is tropical rain forest type; it consists of thick vegetation comprising of varieties evergreen trees that yield tropical hardwoods.
[image:3.595.208.537.354.716.2]The area is easily accessible through tarred major roads, untarred roads and footpaths.
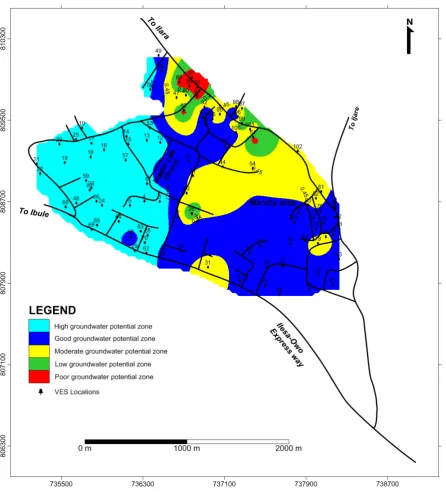
Figure 2. Topographic map of the study area showing the VES points.
The area is underlain by the rocks of Precambrian Basement Complex of southwestern Nigeria (Figure 1). Two lithologic units were identified in the area, namely: undifferentiated Older Granite-Charnockites suites (OGC) and Migma-tite-Gneiss-Quartzite complex (MGQ).
3. Methodology
points were occupied across the study area with a view to understanding the hy-drogeophysical characteristics of the area. Analysis and interpretation of the data obtained were made both qualitatively and quantitatively in order to establish the geo-electric/geologic sequence beneath the study area. The qualitative analy-sis also involved evaluation of sounding curves for hydrogeophysical characte-ristics, while quantitative analysis involving partial curve matching and comput-er itcomput-erations to detcomput-ermine geoelectric parametcomput-ers of geoelectric sequence beneath the study area. The results were presented as tables and maps.
4. Results
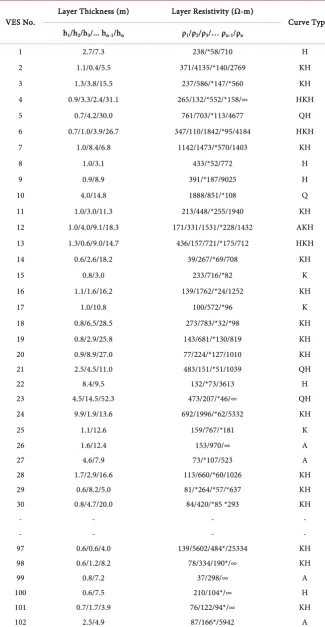
The curves obtained in the study are the A, H, K, Q, KH, AK, AA, HK, QH, AKH, and HKH. The KH, H and A curve types are the predominant curves in the study area. Three to five geoelectric layers were delineated across the study area which corresponds to four geologic units namely; the top soil, weathered layer, partially weathered basement, partially fractured basement and the pre-sumed fresh basement. The topsoil resistivity varies from 26 to 1888 ohm-m and thickness range of 0.2 and 9.9 m. The weathered layer resistivity varies from 15 to 5603 ohm-m with a thickness range of 0.2 and 36.3 m. The third layer resis-tivity values range from 25 to 1842 ohm-m and thickness range of 2.0 and 52.3 m. The fourth layer resistivity ranges between 19 and 478 ohm-m and thickness values of 15 to 35 m. The fifth layer resistivity value varies between 369 and 100,000 ohm-m (Table 1).
4.1. GRT Model
The GRT is an acronym formed from the highlighted letters of the three factors considered most relevant to groundwater potential evaluation; underlying Geol-ogy beneath each VES point, Resistivity and Thickness of the aquifer layers. These factors are combined in a numerical ranking system in order to quantita-tively rate the aquifer potential of each VES location. The system contains two significant parts: weights and ratings and each GRT factor was evaluated with respect to others in order to determine the relative importance of each factor (Table 2).
The basic assumption made in the development of the GRT model includes the following:
1) The Geology of an area depends on the mineral content of the rock present and in turn determines the age of the rock, its degree of weathering and fractur-ing and consequently its ability to store and transmit water.
2) Resistivity of the aquifer layer depends essentially on the availability of connecting pore spaces in the aquifer layer and presence of conductive fluid such as water within the aquifer layer.
3) Thickness of the aquifer layer determines the possible water column and volume of water within the aquifer layer.
Table 1. Geoelectric sounding results.
VES No. Layer Thickness (m) Layer Resistivity (Ω-m) Curve Type h1/h2/h3/... hn-1/hn ρ1/ρ2/ρ3/… ρn-1/ρn
1 2.7/7.3 238/*58/710 H
2 1.1/0.4/5.5 371/4135/*140/2769 KH
3 1.3/3.8/15.5 237/586/*147/*560 KH
4 0.9/3.3/2.4/31.1 265/132/*552/*158/∞ HKH
5 0.7/4.2/30.0 761/703/*113/4677 QH
6 0.7/1.0/3.9/26.7 347/110/1842/*95/4184 HKH
7 1.0/8.4/6.8 1142/1473/*570/1403 KH
8 1.0/3.1 433/*52/772 H
9 0.9/8.9 391/*187/9025 H
10 4.0/14.8 1888/851/*108 Q
11 1.0/3.0/11.3 213/448/*255/1940 KH
12 1.0/4.0/9.1/18.3 171/331/1531/*228/1432 AKH
13 1.3/0.6/9.0/14.7 436/157/721/*175/712 HKH
14 0.6/2.6/18.2 39/267/*69/708 KH
15 0.8/3.0 233/716/*82 K
16 1.1/1.6/16.2 139/1762/*24/1252 KH
17 1.0/10.8 100/572/*96 K
18 0.8/6.5/28.5 273/783/*32/*98 KH
19 0.8/2.9/25.8 143/681/*130/819 KH
20 0.9/8.9/27.0 77/224/*127/1010 KH
21 2.5/4.5/11.0 483/151/*51/1039 QH
22 8.4/9.5 132/*73/3613 H
23 4.5/14.5/52.3 473/207/*46/∞ QH
24 9.9/1.9/13.6 692/1996/*62/5332 KH
25 1.1/12.6 159/767/*181 K
26 1.6/12.4 153/970/∞ A
27 4.6/7.9 73/*107/523 A
28 1.7/2.9/16.6 113/660/*60/1026 KH
29 0.6/8.2/5.0 81/*264/*57/*637 KH
30 0.8/4.7/20.0 84/420/*85 *293 KH
- - - -
- - - -
97 0.6/0.6/4.0 139/5602/484*/25334 KH
98 0.6/1.2/8.2 78/334/190*/∞ KH
99 0.8/7.2 37/298/∞ A
100 0.6/7.5 210/104*/∞ H
101 0.7/1.7/3.9 76/122/94*/∞ KH
102 2.5/4.9 87/166*/5942 A
Table 2. Indicator weights.
S/N Indicators Weights
1 Geology of the area 5
2 Resistivity of the aquifer layer 3
3 Thickness of the aquifer layer 2
1) Identification of the important indicators influencing groundwater poten-tial.
2) Derivation of indicator weights (Table 2); indicator weights depict the rela-tive importance of the indicator to the evaluation of groundwater potential.
3) Derivation of different ratings for each indicator.
The most significant indicators have weights of 5 and the least weight of two in a five-point scale.
The three (3) parameters were synthesized using the following relationship:
[
]
{
geology geology resistivity resistivity thickness thickness}
GRT value
Wt * Rt Wt * Rt Wt * Rt
= + + (1)
where,
Wt = Weight; Rt = Rating.
4.2. Geology
The geologic map of the study area (Figure 1) indicates that the study area is underlain by two major rock types with different hydrogeological potential, namely undifferentiated Older Granite-Charnockites suites (OGC) and Mig-matite-Gneiss-Quartzite complex (MGQ). The undifferentiated Older Granite- Charnockites suites areas are considered to be poor and moderate groundwater potential zones, while Migmatite-Gneiss-Quartzite complex are noted for its high groundwater potential.
The undifferentiated OGC suites are found in the eastern and southeastern parts of the study area while Migmatite-Gneiss-Quartzite complex are dominant in the western part of the area. Charnockites are assigned a rating of 0.4 in the GRT-model, while the Migmatite-Gneiss-Quartzite was assigned a rating of 0.8, and finally the granitic region were assigned a rating of 0.5. The region with sig-nificantly higher rating is considered to be of good groundwater potential.
4.3. Aquifer Layer Resistivity Map
Figure 3. Aquifer layer resistivity map of the study area.
GRT indicator (Table 2) shows the weight of resistivity to be 3 from maximum of 5, while the rating range is 0.2 to 1.
4.4. Aquifer Layer Thickness Map
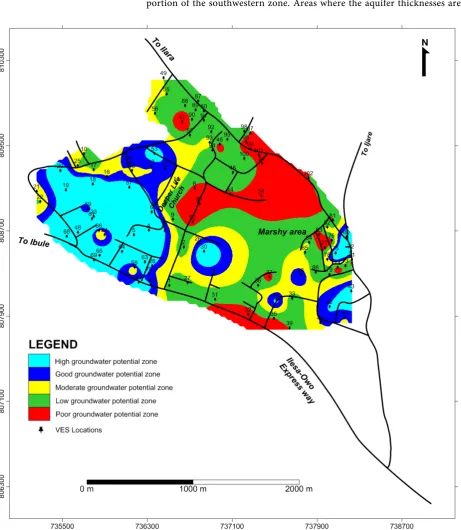
[image:9.595.60.522.182.713.2]The aquifer layer thickness (Figure 4) across the study area varies from 2 to 50 m. Areas with thickness of 2 - 5 m are considered to be of poor groundwater poten-tial and are rated 0.2, and these areas occupy part of the northeastern and a small portion of the southwestern zone. Areas where the aquifer thicknesses are be-
tween 10 - 15 m and 15 - 20 m are considered to be of moderate and good groundwater potentials and they are rated 0.6 and 0.8 respectively. Areas where the aquifer thickness is above 20 m are ranked to be high groundwater potential zone and are rated 1.0. Aquifer thickness is weighed 2 from possible 5 in the GRT- model.
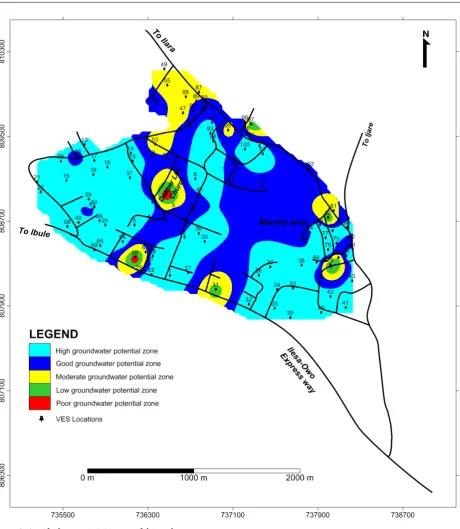
4.5. Groundwater Potential Map
[image:10.595.74.521.225.719.2]The GRT-model map integrates maps of geology, aquifer resistivity and aquifer thickness. It is the direct indicator of groundwater potential in the study area
and it shows the spatial variation of the groundwater potential across the study area. The GRT model map/groundwater potential map (Figure 5) delineated five different groundwater potential areas; poor, low, moderate, good and high. The western part of the study area are delineated to be high groundwater poten-tial area (0.7 - 0.95), while the extreme northern parts of the area are characte-rized by poor and low potentials (0 - 0.3) and the northeastern and central parts of the area are categorized as moderate (0.3 - 0.5) and good (0.5 - 0.7) ground-water potential zones. Generally the Ipinsa-Okeodu area can be considered to be of moderately good potential. Evidence from success rate of groundwater devel-opment efforts in the study area confirmed the reliability of this model.
5. Conclusion and Recommendation
This research work presents the result of application of a multi-criteria approach to groundwater potential evaluation at Ipinsa-Okeodu area near Akure, Ondo State, Nigeria. The study adopted vertical electrical sounding techniques using the Schlumberger electrode configuration. The maps of aquifer layer resistivity, aquifer layer thickness and the geology of the study area were generated and in-tegrated in the GRT model map/groundwater potential map. The western parts of the study area are delineated to be high groundwater potential area, followed by the northeastern and central parts of the area which are categorized as moderate and high potentials and finally the extreme northern parts of the area which are characterized by poor and low potentials. In view of the observed re-liability of this model it is therefore recommended that groundwater potential evaluation in any geologic setting should always be done using a multi-criteria approach.
References
[1] Akintorinwa, O.J. and Olowolafe, T.S. (2013) Geoelectric Evaluation of Groundwa-ter Prospect within Zion Estate, Akure, Southwest, Nigeria. International Journal of Water Resources and Environmental Engineering, 5, 12-28.
[2] Olayinka, A.I. and Olorunfemi, M.O. (1992) Determination of Geoelectrical Char-acteristic in Okene Area and Implication for Boreholes. Journal of Mining and Ge-ology, 28, 403-412.
[3] Wright, E.P. and Burgess, W.G. (1992) Hydrogeology of Crystalline Basement Aq-uifers in Africa. Geological Society London Special Publications, 66, 1-27.
https://doi.org/10.1144/GSL.SP.1992.066.01.01
[4] Omosuyi, G.O., Ojo, J.S. and Enikanselu, P.A. (2003) Geophysical Investigation for Groundwater around Obanla-Obakekere in Akure Area within the Basement Com-plex of Southwestern Nigeria. Journal of Mining and Geology, 39, 109-116. [5] Omosuyi, G.O. (2010) Geoelectric Assessment of Groundwater Prospect and
Vul-nerability of Overburden Aquifers at Idanre, Southwestern Nigeria. Ozean Journal of Applied Science, 3, 19-28.
[6] Clark, L. (1985) Groundwater Abstraction from Basement Complex Area of Africa. Quarterly Journal of Engineering Geology and Hydrogeology, 18, 25-34.
https://doi.org/10.1144/GSL.QJEG.1985.018.01.05
Shallow Aquifers Using Geoelectric and Hydrogeologic Parameters at Odigbo, Southwestern Nigeria. Journal of Scientific and Industrial Research, 3, 501-512. [8] Abiola, O., Enikanselu, P.A. and Oladapo, M.I. (2009) Groundwater Potential and
Aquifer Protective Capacity of Overburden Units in Ado-Ekiti, Southwestern Nige-ria. International Journal of Physical Sciences, 4, 120-132.
[9] Adeyemo, I.A., Omosuyi, G.O., Olayanju, G.M. and Omoniyi, G.K. (2014) Hydro-geologic and Geoelectric Determination of Groundwater Flow Pattern in Alaba- Apatapiti Layouts, Akure, Nigeria. The International Journal of Engineering and Science (IJES), 3, 44-52.
[10] Amadi, A.N., Nwawulu, C.D., Unuevho, C.I. and Ako, T.A. (2011) Evaluation of the Groundwater Potential in Pompo Village, Gidan Kwano, Minna Using Vertical Electrical Resistivity Sounding. British Journal of Applied Science & Technology, 1, 53-66. https://doi.org/10.9734/BJAST/2011/192
[11] Kosinski, W.K. and Kelly, W.E. (1981) Geoelectric Soundings for Predicting Aquifer Properties. Groundwater, 19, 163-171.
https://doi.org/10.1111/j.1745-6584.1981.tb03455.x
[12] Mogaji, K.A., Omosuyi, G.O. and Olayanju, G.M. (2011) Groundwater System Evaluation and Protective Capacity of Overburden Material at Ile-Oluji, Southwest-ern Nigeria. Journal of Geology and Mining Research, 3, 294-304.
[13] Olayanju, G.M., Ayuk, M.A. and Adelusi, A.O. (2011) Geotechnical Mapping of the Groundwater Regime around the Federal Polytechnic, Ado-Ekiti, Southwestern Ni-geria. Journal of Geology and Mining Research, 3, 201-210.
[14] Chachadi, A.G. (2005) Seawater Intrusion Mapping Using Modified GALDIT Indi-cator Model-Case Study in Goa. Jalvigyan Sameeksha, 20, 29-45.
Submit or recommend next manuscript to SCIRP and we will provide best service for you:
Accepting pre-submission inquiries through Email, Facebook, LinkedIn, Twitter, etc. A wide selection of journals (inclusive of 9 subjects, more than 200 journals)
Providing 24-hour high-quality service User-friendly online submission system Fair and swift peer-review system
Efficient typesetting and proofreading procedure
Display of the result of downloads and visits, as well as the number of cited articles Maximum dissemination of your research work
Submit your manuscript at: http://papersubmission.scirp.org/