The Joint Use of Electronic Nose and Electronic Tongue
for the Evaluation of the Sensorial Properties of Green and
Black Tea Infusions as Related to Their Chemical
Composition
Susanna Buratti1*, Antonella Casiraghi2, Paola Minghetti2, Gabriella Giovanelli1
1DeFENS, Department of Food, Environmental and Nutritional Sciences, Università degli Studi di Milano, Milano, Italy; 2Depart-
ment of Pharmaceutical Sciences “Pietro Pratesi”, Università degli Studi di Milano, Milano, Italy. Email: *[email protected]
Received January 17th, 2013; revised February 20th, 2013; accepted February 28th, 2013
Copyright © 2013 Susanna Buratti et al. This is an open access article distributed under the Creative Commons Attribution License, which permits unrestricted use, distribution, and reproduction in any medium, provided the original work is properly cited.
ABSTRACT
The objectives of the present study were to determine the effects of the brewing method on the amount of the major catechins, methylxanthines, total polyphenols and antioxidant capacity in green and black teas, and to correlate the chemical composition of tea infusions to their sensorial properties by the combined use of the electronic nose and tongue. For this purpose, tea infusions were prepared from 7 green teas and 6 black teas using different extraction times (3 - 5 and 10 min). The extraction of total polyphenols and catechins was increased by prolonging the infusion time from 3 - 5 to 10 min, while the caffeine amounts did not increase. The antioxidant activity of teas was well correlated with polyphenol content. Electronic tongue and electronic nose were able to discriminate green teas from black teas on the basis of their sensorial properties. Considering the taste, green teas were characterized by astringency and after- taste-astringency and this sensation was increased by prolonging the infusion time; black teas were perceived as more bitter, sour, salty and the extraction time affected the astringent sensation. The aroma of green and black teas was dis- criminated by specific sensors and the increase of the extraction time produced more richly flavoured infusions. This work adds information about correlation between sensorial properties, antioxidant capacity and chemical composition of green and black teas.
Keywords: Green Tea; Black Tea; Electronic Nose; Electronic Tongue; Chemical Composition; Antioxidant Activity
1. Introduction
Tea is the most widely consumed beverage throughout the world, appreciated because of its aroma and taste cha- racteristics as well as beneficial health effects, including antioxidant activity, anticarcinogenic and antihyperten- sive effects [1]. All teas originate from a single evergreen plant, the Camellia sinensis var. sinensis and assamica, and diverse processing methods produce the various types of tea.
The major distinctive element of the different types of tea is the degree of oxidation, the leaf’s enzyme reaction to oxygen, a process that is improperly referred to as fer- mentation. The characteristics of raw material and the fermentation process greatly influence the chemical com- position of teas [2], which are generally classified into
compositional differences affect the health-promoting pro- perties of tea, which are mainly due to its polyphenolic composition and content. Polyphenols in tea infusions are mainly represented by catechins and polymeric flavo- noids derived by enzymatic oxidation of catechins (thea- flavins and thearubigins). Flavonol glycosides, gallic and chlorogenic acids have also been detected in tea infu- sions [3]. Teas also contain methylxanthines: caffeine, one of the major components in tea extracts, and theobro- mine [4,5]. Water temperature can influence the extrac- tion of tea components; tea infused at higher temperature had higher levels of catechins, especially epigallocatechin gallate and epigallocatechin, and caffeine than those ex- tracted at lower temperature [6-8]. Another important brewing factor is the infusion time. It has been reported that the amount of catechins and caffeine increases with increasing duration of infusion [4,7]. Reference [9] re- ported that the total flavonoid content from loose leaf and bagged green tea increased with prolonged extraction time till 10 and 15 min, whereas longer extraction time can lead to catechin degradation. These results were in accordance with those reported by [10], who observed that catechins tend to degrade during prolonged extrac- tion time.
Various studies investigated the effects of the type of tea and the brewing conditions (mainly water tempera- ture, agitation, tea:water ratio and infusion time) in order to optimize the extraction of polyphenolic components and therefore maximize the nutraceutical characteristics of the beverage [1,3,4,7]. However, very few works take into account the effects of the varying conditions of tea preparation on the sensory attributes of the resulting be- verage [5,11], though the sensory quality of teas is the primary aspect for the consumers to express their prefer- ence and choice. The sensory quality of food is generally determined by a panel of tasters, which is an expensive method in terms of time and labor, and sometimes gives inaccurate or subjective results. The electronic nose (e- nose) and electronic tongue (e-tongue) are fast, simple and non-destructive technologies applied successfully in the food field. There are some literature references about the e-nose application for the discrimination of different types of tea [12], for tea quality evaluation [13,14] and also for the detection of the optimum fermentation time in black tea manufacturing process [15,16]. E-tongue has been successfully used to discriminate different types of teas [17,18] and also to evaluate the geographical origin and quality level [19]. A recent research has evaluated black tea quality by using e-nose and e-tongue, showing that a better classification can be obtained when these two devices are used in combination [20]. To our know- ledge, there are no works combining e-nose and e-tongue in order to relate the sensorial characteristics with the chemical composition of green and black teas.
The objectives of the present study were: (A) to de- termine the effects of the infusion time on the amount of the major catechins (epicatechin, epigallocatechin, epigal- locatechin gallate, and epicatechin gallate) and methy- lxanthines (caffeine and theobromine), total polyphenols and antioxidant capacity in green and black teas; (B) to evaluate how the chemical composition of green and black tea infusions affects their sensorial properties, assessed by the combined use of e-nose and e-tongue.
2. Materials and Methods
2.1. Materials
Seven green teas and six black teas in loose leaf form were used; tea samples were prepared using the brewing method typically applied in Western Europe for home preparation: 2.5 g of tea leaves were infused in 250 mL of low mineral content water heated to boiling tempera- ture. The dipping time was 3 min and 5 min for green and black teas, respectively, as usually suggested for these products. All teas were also infused for 10 min, in order to evaluate the enhancement of the extraction rates and the relevant effect on tea sensorial properties. De- tailed information about the samples and brewing condi- tions are reported in Table 1.
Low mineral content water was used for tea brewing (S. Anna, Vinadio, Cuneo; fixed residue 42.8 mg/l; so- dium 0.0001%; hardness 3.1 French degrees).
(−)-Epigallocatechin (EGC), (−)-epicatechin (EC) and gallic acid (GA) were purchased from Sigma (Sigma Al- drich Italia). Caffeine (CA), theobromine (THEO), (−)- epigallocatechin gallate (EGCG) and (−)-epicatechin gal- late (ECG) were purchased from Fluka (Sigma Aldrich Italia).
Acetonitrile and methanol were HPLC grade; all other reagents were analytical grade.
2.2. HPLC Analysis of Catechins and Methylxanthines
The analyses were carried out with a HP 1100 apparatus (Chemstations, Agilent Technologies) using ZORBAX Eclipse XDB-C18 (5 µm, 4.6 mm × 150 mm) column with a specific precolumn. The temperature was maintain- ed at 35˚C. The flow rate was 1 mL/min and the injection volume was 20 L. Peaks were detected at 210 nm and 280 nm.
Table 1. Characteristics and infusion time of teas.
Type of
tea Plant variety Country of origin Tea name Sample name
Infusion time (min)
Green Sinensis Japan Hojicha (roasted bancha) G1 G2 10 3
Green Sinensis China (Zhejiang) Chun Mee G3 G4 10 3
Green Sinensis Japan (Shizuoka) Sencha Tokumushi G5 G6 10 3
Green Sinensis China (Zhejiang) Lung Ching G7 G8 10 3
Green Sinensis Japan (Shizuoka) Sencha Fuji-yama G10 G9 10 3
Green Sinensis Japan (Kyushu) Sencha Ariake G11 G12 10 3
Green Sinensis Japan Yanagicha (bancha) G13 G14 10 3
Black Assamica Sri Lanka (Dimbula) Pettiagalla B1 B2 10 5
Black Sinensis India (Darjeeling) Ambootia B3 B4 10 5
Black Sinensis China (Anhui) Grand Keemun B5 B6 10 5
Black Assamica India (Assam) Thowra B7 B8 10 5
Black Assamica Sri Lanka (Uva) Saint James B10 B9 10 5
Black Sinensis India (Darjeeling) Margaret’s Hope B11 B12 10 5
column was conditioned with the initial eluent for 10 min.
Six concentrations of the standard compounds (gallic acid, the four catechins and the two methylxanthines) were prepared and injected. Methylxanthines and cate- chins in tea infusions were identified by comparison of retention time and adsorption spectra with reference standards. Tea infusions were analyzed in triplicate.
2.3. Determination of Total Polyphenols and Antioxidant Activity
Total polyphenols were determined by the Folin-Ciocal- teau method [22]. 0.5 mL suitably diluted samples were mixed with 2.5 mL water, 0.5 mL Folin-Ciocalteau re- agent and, after 3 - 5 min, 2 mL 10% Na2CO3. Water was
added to total 10 mL and samples were stored for 90 min in the dark. The absorbance at 750 nm was read against a blank (by Jasco Uvidec 650 spectrophotometer) and total polyphenols were quantified by a calibration curve built with gallic acid. All samples were analysed in triplicate and data are expressed as mg/L gallic acid equivalents (GAE).
The antioxidant activity of tea infusions was deter- mined by the DPPH* (2,2-diphenyl-1-picrylhydrazyl) as- say as previously reported [23]. Dose-response curves were built for each sample and the amount of antioxidant
corresponding to 50% inactivation of the DPPH* radi- cal (I50), was calculated. Since I50 is an inverse index (the higher the antioxidant activity, the lower the I50 value), data were converted into trolox equivalents (mil- ligram of trolox per 100 mL of tea infusion) using a cali- bration curve built with trolox (6-hydroxy-2,5,7,8-tetra- methyl-chroman-2-carboxylic acid). All determinations were carried out in triplicate and data are expressed as mmol/L Trolox equivalents (TE).
2.4. Electronic Nose
A Portable e-nose (PEN2) from Win Muster Airsense (WMA) Analytics Inc. (Schwerin, Germany) was used. It consists of a sampling apparatus, a detector unit contain- ing the sensor array, and a pattern recognition software (Win Muster v.1.6) for data recording and elaboration. The sensor array is composed of 10 Metal Oxide Semi- conductor (MOS) type chemical sensors: W1C (aromatic) W5S (broadrange) W3C (aromatic) W6S (hydrogen) W5C (arom-aliph) W1S (broad-methane) W1W (sulphur-or- ganic) W2S (broad-alcohol) W2W (sulph-chlor) W3S (me- thane-aliph). The sensor response is expressed as resisti- vity (Ohm).
measurement started. The headspace was pumped over the sensor surfaces for 60 s (injection time) at a flow rate of 300 mL/min, during this time the sensor signals were recorded. After sample analysis the system was purged for 180 s with filtered air prior to the next sample injec- tion to allow reestablishment of the instrument baseline. The sensor drift was evaluated by using a standard solu- tion of 1% ethanol included in each measurement cycle. For all the experimental period (4 weeks max) no sensor drift was experienced. All samples were analyzed in trip- licate.
2.5. Electronic Tongue
Analyses were performed with the Taste-Sensing System SA 402B (Intelligent Sensor Technology Co. Ltd., Japan). The detecting part of the system consists of detecting sensors whose surface is combined with artificial lipid membranes having different response properties to chemical substances on the basis of their taste. The de- tecting sensors used in this work were: CT0 specific for saltiness, CA0 for sourness, C00 for bitterness and after- taste bitterness, AE1 for astringency and aftertaste strin- gency. The measurement principle of the e-tongue is based on the capability of tasty substances to change the potential of the detecting sensors through electrostatic or hydrophobic interaction with the hydrophilic and hydro- phobic groups of the lipid membranes. The detecting sensors were first dipped into the reference solution (30 mmol/L potassium chloride and 0.3 mmol/L tartaric acid) and the electric potential measured for each sensor was defined as Vr. Then the sensors were dipped for 30 s into 60 mL room temperature tea infusion and for each sensor the measured potential was defined as Vs. The “Relative value” (Rv) was represented by the differences between the potentials of the sample and the reference solution (Vs-Vr). Sensors were rinsed with fresh reference solu- tion for 6 s and then dipped into the reference solution again. The new potential for the reference solution was defined as Vr’. The difference Vr’-Vr between the poten- tials of the reference solution after and before sample measurement is the “Change of Membrane Potential caused by Absorption value” (CPAv) and corresponds to the “aftertaste”. Before a new cycle measurement, elec- trodes were rinsed for 90 s with a washing solution (ethanol 30%) and then for 180 s with the reference solu- tion. Each sample was evaluated in duplicate and the averages of the sensor outputs were converted to taste information. The “taste values” were calculated by mul- tiplying the Rv and CPAv of the sensors for appropriate coefficients based on Weber-Fechner law, which gives the intensity of sensation considering the sensor proper- ties for tastes [24].
2.6. Statistical Treatment of Data
E-nose and e-tongue data were standardized and ana- lyzed by means of Principal Component Analysis (PCA) using the SCAN software for chemometric analysis (MINITAB Inc., PA, USA, 1998). Chemical data were subjected to one-way analysis of variance (ANOVA) and comparison among means was determined according to Fisher’s least significant difference (LSD) test, at 95% confidence level.
3. Results and Discussion
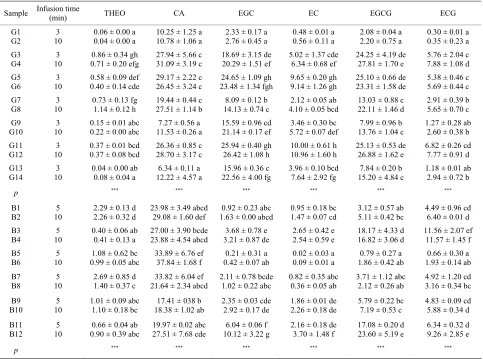
Table 2 reports the amounts of individual methyllxan-
thines and catechins in the black and green teas analysed. Concerning methylxanthines, all teas contained relatively low concentration of THEO, higher in black than in green teas. Pettiagalla (B1-B2) and Thowra (B7-B8), which are assamic varieties, showed the highest THEO content. Also in the case of CA, the highest amounts were meas- ured in black teas; this is in agreement with literature data [4]. Green teas Chun Mee (G3-G4), Sencha Toku- mushi (G5-G6) and Sencha Ariake (G11-G12) showed CA content similar to that found in black teas; lower CA levels were measured in Sencha Fuji-yama (G9-G10) and Bancha Yanagicha (G13-G14). Bancha is a Japanese green tea, considered naturally low in caffeine because it is made from more mature leaves, which contain less caf- feine. In the case of methylxanthines, significant differ- ences in the two infusion times were observed only for Lung Ching (G7-G8) and Thowra (B7-B8). Concerning catechins, for all investigated teas EGC and EGCG were the prevailing compounds, with values ranging from 2.33 mg/g to 26.65 mg/g for EGC and from 2.08 mg/g to 27.81 mg/g for EGCG; the content of EC and ECG was lower, ranging from 0.48 mg/g to 10.96 mg/g. It can be noted that Bancha Tostato Hojicha (G1-G2) had the low- est catechin content and Sencha Ariake (G11-G12) had the highest content. The prolonged infusion time not al- ways led to significantly higher levels of extracted cate- chins. In the case of black teas, differences for all cate- chins were significant in Margaret’s Hope (B11-B12). For green teas, the effect of prolonged infusion was sig- nificant for Lung Ching (G7-G8), Sencha Fuji-yama (G9-G10) and Bancha Yanagicha (G13-G14).
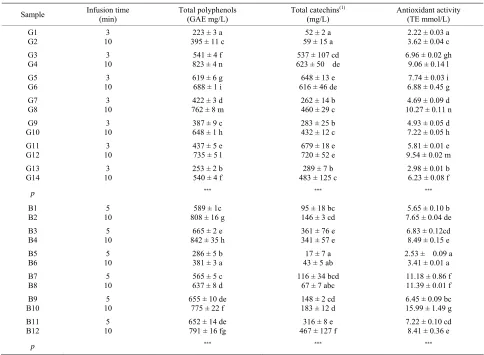
Table 3 shows the amounts of total phenolics, cate-
Table 2. Bioactive components of green and black teas determined by HPLC (mg/g tea loose leaf; mean value ± s.d., n = 3).
Sample Infusion time (min) THEO CA EGC EC EGCG ECG
G1 G2
3 10
0.06 ± 0.00 a 0.04 ± 0.00 a
10.25 ± 1.25 a 10.78 ± 1.06 a
2.33 ± 0.17 a 2.76 ± 0.45 a
0.48 ± 0.01 a 0.56 ± 0.11 a
2.08 ± 0.04 a 2.20 ± 0.75 a
0.30 ± 0.01 a 0.35 ± 0.23 a G3
G4
3 10
0.86 ± 0.34 gh 0.71 ± 0.20 efg
27.94 ± 5.66 c 31.09 ± 3.19 c
18.69 ± 3.15 de 20.29 ± 1.51 ef
5.02 ± 1.37 cde 6.34 ± 0.68 ef
24.25 ± 4.19 de 27.81 ± 1.70 e
5.76 ± 2.04 c 7.88 ± 1.08 d G5
G6
3 10
0.58 ± 0.09 def 0.40 ± 0.14 cde
29.17 ± 2.22 c 26.45 ± 3.24 c
24.65 ± 1.09 gh 23.48 ± 1.34 fgh
9.65 ± 0.20 gh 9.14 ± 1.26 gh
25.10 ± 0.66 de 23.31 ± 1.58 de
5.38 ± 0.46 c 5.69 ± 0.44 c G7
G8
3 10
0.73 ± 0.13 fg 1.14 ± 0.12 h
19.44 ± 0.44 c 27.51 ± 1.14 b
8.09 ± 0.12 b 14.13 ± 0.74 c
2.12 ± 0.05 ab 4.10 ± 0.05 bcd
13.03 ± 0.88 c 22.11 ± 1.46 d
2.91 ± 0.39 b 5.65 ± 0.70 c G9
G10
3 10
0.15 ± 0.01 abc 0.22 ± 0.00 abc
7.27 ± 0.56 a 11.53 ± 0.26 a
15.59 ± 0.96 cd 21.14 ± 0.17 ef
3.46 ± 0.30 bc 5.72 ± 0.07 def
7.99 ± 0.96 b 13.76 ± 1.04 c
1.27 ± 0.28 ab 2.60 ± 0.38 b G11
G12
3 10
0.37 ± 0.01 bcd 0.37 ± 0.08 bcd
26.36 ± 0.85 c 28.70 ± 3.17 c
25.94 ± 0.40 gh 26.42 ± 1.08 h
10.00 ± 0.61 h 10.96 ± 1.60 h
25.13 ± 0.53 de 26.88 ± 1.62 e
6.82 ± 0.26 cd 7.77 ± 0.91 d G13
G14
3 10
0.04 ± 0.00 ab 0.08 ± 0.04 a
6.34 ± 0.11 a 12.22 ± 4.57 a
15.96 ± 0.36 c 22.56 ± 4.00 fg
3.96 ± 0.10 bcd 7.64 ± 2.92 fg
7.84 ± 0.20 b 15.20 ± 4.84 c
1.18 ± 0.01 ab 2.94 ± 0.72 b
p *** *** *** *** *** ***
B1 B2
5 10
2.29 ± 0.13 d 2.26 ± 0.32 d
23.98 ± 3.49 abcd 29.08 ± 1.60 def
0.92 ± 0.23 abc 1.63 ± 0.00 abcd
0.95 ± 0.18 bc 1.47 ± 0.07 cd
3.12 ± 0.57 ab 5.11 ± 0.42 bc
4.49 ± 0.96 cd 6.40 ± 0.01 d B3
B4
5 10
0.40 ± 0.06 ab 0.41 ± 0.13 a
27.00 ± 3.90 bcde 23.88 ± 4.54 abcd
3.68 ± 0.78 e 3.21 ± 0.87 de
2.65 ± 0.42 e 2.54 ± 0.59 e
18.17 ± 4.33 d 16.82 ± 3.06 d
11.56 ± 2.07 ef 11.57 ± 1.45 f B5
B6
5 10
1.08 ± 0.62 bc 0.99 ± 0.05 abc
33.89 ± 6.76 ef 37.84 ± 1.68 f
0.21 ± 0.31 a 0.42 ± 0.07 ab
0.02 ± 0.03 a 0.09 ± 0.01 a
0.79 ± 0.27 a 1.86 ± 0.42 ab
0.66 ± 0.30 a 1.93 ± 0.14 ab B7
B8
5 10
2.69 ± 0.85 d 1.40 ± 0.37 c
33.82 ± 6.04 ef 21.64 ± 2.34 abcd
2.11 ± 0.78 bcde 1.02 ± 0.22 abc
0.82 ± 0.35 abc 0.36 ± 0.05 ab
3.71 ± 1.12 abc 2.12 ± 0.26 ab
4.92 ± 1.20 cd 3.16 ± 0.34 bc
B9 B10
5 10
1.01 ± 0.09 abc 1.10 ± 0.18 bc
17.41 ± 038 b 18.38 ± 1.02 ab
2.35 ± 0.03 cde 2.92 ± 0.17 de
1.86 ± 0.01 de 2.26 ± 0.18 de
5.79 ± 0.22 bc 7.19 ± 0.53 c
4.83 ± 0.09 cd 5.88 ± 0.34 d
B11 B12
5 10
0.66 ± 0.04 ab 0.90 ± 0.39 abc
19.97 ± 0.02 abc 27.51 ± 7.68 cde
6.04 ± 0.06 f 10.12 ± 3.22 g
2.16 ± 0.18 de 3.70 ± 1.48 f
17.08 ± 0.20 d 23.60 ± 5.19 e
6.34 ± 0.32 d 9.26 ± 2.85 e
p *** *** *** *** *** ***
Different letters in each column indicate significant differences at 95% confidence level as obtained by the LSD test. ***
p < 0.001.
Ariake (G12) and the lowest value in Bancha Tostato Hojica (G1). Hojicha is a Japanese tea that is distin- guished from all the other green teas because it is roasted in a porcelain pot over charcoal. This type of tea is fired at high temperature, altering the leaf colour from green to reddish-brown. Black teas showed a total phenolic con- centration maximum in Darjeeling Ambootia (B4) and minimum in Grand Keemun (B5), with average value of 637 mg/L. Catechin concentration ranged from 467 mg/L (Darjeeling Margareth’s Hope, B12) to 17 mg/L (Grand Keemun, B5), with an average value of 192 mg/L. The only black tea from Chinese origin (Grand Keemun, B5- B6) showed total phenolic and catechin contents much lower than all the other samples. In general terms, black teas had higher average content of total phenolics, while green teas had higher catechin content. With regard to the effects of prolonged infusion time, this determined a significantly higher extraction of phenolic components in all black and green teas, as evidenced by the statistical analysis. Concerning black teas, longer infusion time (10
min vs 5 min) increased the extraction of total phenolics by 20% as average. In green teas (extraction time 3 and 10 min) a similar and more evident effect was observed with average increase in total phenolic concentration of 38%. Variations of catechin concentration in black teas obtained by prolonged infusion resulted as non-signifi- cant except for one sample (Darjeeling Margareth’s Hope, B11-B12). In green teas, longer infusion time produced significant increase in catechin content in three samples: Lung Chin (G7-G8), Sencha Fuji-yama (G9-G10) and Bancha Yanagicha (G13-G14). Even if not statistically significant, a higher catechin concentration was observed in all green teas infused for 10 min compared to 3 min.
The antioxidant activity of black teas, evaluated as the ability to inactivate synthetic radical DPPH* (Table 3),
Table 3. Total polyphenols, total catechins and antioxidant activity of green and black teas (mean value ± s.d., n = 3).
Sample Infusion time (min) Total polyphenols (GAE mg/L) Total catechins(mg/L) (1) Antioxidant activity (TE mmol/L)
G1 G2
3 10
223 ± 3 a 395 ± 11 c
52 ± 2 a 59 ± 15 a
2.22 ± 0.03 a 3.62 ± 0.04 c G3
G4 10 3 823 ± 4 n 541 ± 4 f 623 ± 50 de 537 ± 107 cd 6.96 ± 0.02 gh 9.06 ± 0.14 l
G5 G6
3 10
619 ± 6 g 688 ± 1 i
648 ± 13 e 616 ± 46 de
7.74 ± 0.03 i 6.88 ± 0.45 g G7
G8
3 10
422 ± 3 d 762 ± 8 m
262 ± 14 b 460 ± 29 c
4.69 ± 0.09 d 10.27 ± 0.11 n G9
G10
3 10
387 ± 9 c 648 ± 1 h
283 ± 25 b 432 ± 12 c
4.93 ± 0.05 d 7.22 ± 0.05 h G11
G12
3 10
437 ± 5 e 735 ± 5 l
679 ± 18 e 720 ± 52 e
5.81 ± 0.01 e 9.54 ± 0.02 m G13
G14
3 10
253 ± 2 b 540 ± 4 f
289 ± 7 b 483 ± 125 c
2.98 ± 0.01 b 6.23 ± 0.08 f
p *** *** ***
B1 B2
5 10
589 ± 1c 808 ± 16 g
95 ± 18 bc 146 ± 3 cd
5.65 ± 0.10 b 7.65 ± 0.04 de B3
B4 10 5 842 ± 35 h 665 ± 2 e 361 ± 76 e 341 ± 57 e 6.83 ± 0.12cd 8.49 ± 0.15 e
B5
B6 10 5 286 ± 5 b 381 ± 3 a 43 ± 5 ab 17 ± 7 a 2.53 ± 0.09 a 3.41 ± 0.01 a
B7
B8 10 5 565 ± 5 c 637 ± 8 d 116 ± 34 bcd 67 ± 7 abc 11.18 ± 0.86 f 11.39 ± 0.01 f
B9
B10 10 5 655 ± 10 de 775 ± 22 f 148 ± 2 cd 183 ± 12 d 15.99 ± 1.49 g 6.45 ± 0.09 bc
B11
B12 10 5 652 ± 14 de 791 ± 16 fg 467 ± 127 f 316 ± 8 e 7.22 ± 0.10 cd 8.41 ± 0.36 e
p *** *** ***
(1)Calculated as the sum of EC, EGC, EGCG and ECG; Different letters in each column indicate significant differences at 95% confidence level as obtained by
the LSD test. ***
p < 0.001.
linearly correlated to the total phenolic concentration (r2
= 0.91, determined by linear correlation on pooled black and green teas). The correlation was much less signifi- cant when catechin concentration was considered (r2 =
0.61). LSD test proved that longer infusion time corre- sponded to higher antioxidant activity in all green teas and in 4 black teas (Pettiagalla B1-B2, Ambootia B3-B4, Saint James B9-B10 and Margareth’s Hope B11-B12).
Flavour, described as taste and aroma, is the most im- portant element for tea evaluation. In this work the e- tongue and the e-nose were applied to assess taste and aroma profiles of tea infusions and to evaluate their rela- tionship with the brewing conditions and the chemical composition.
Data collected were processed by PCA and the first two principal components (PC1 and PC2) were plotted.
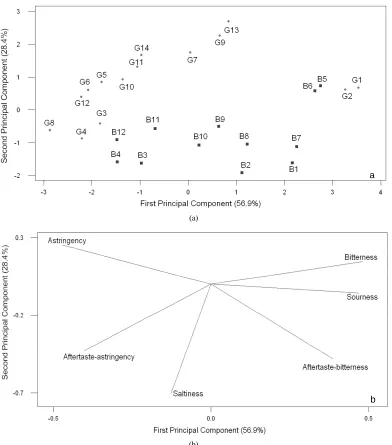
Figure 1 reports the e-tongue score plot (a) and loading
plot (b) of teas.
It is known that tea taste is influenced by the process- ing method and the infusion conditions, which affect the
extraction of phenolic compounds and caffeine [5]. The e-tongue score plot (Figure 1(a)) showed the discrimina-
tive ability of this device in distinguishing the taste of green and black teas. In particular, green teas, grouped at the left of PC1 (explained variance 56.9%), were dis- criminated from black teas, which were more dispersed along PC1 and located in the lower part of PC2 (ex- plained variance 28.4%). At the right of the score plot the Bancha Tostato Hojicha tea (G1-G2) was completely separated from the other green teas. Moreover, different teas of the same type (for example different green teas) were not overlapping each other, indicating the sensitive- ity of the e-tongue. From the loading plot (Figure 1(b)),
a
(a)
b
[image:7.595.104.496.93.538.2](b)
Figure 1. Principal component analysis of electronic tongue data: Score plot (a) and loading plot (b) of green and black teas in the plane defined by the first two principal components.
the most bitter. The two Indian teas Darjeeling Ambootia (B3-B4) and Darjeeling Margaret’s Hope (B11-B12) were located in the lower left quadrant of the score plot and were characterized by aftertaste astringency.
The effect of the extraction time on tea taste was also evaluated. As shown by the arrows reported in the e- tongue score plot (Figure 1(a)), the green teas infused
for 10 min were shifted on PC2 and the direction coin- cided with the increase of astringency and aftertaste as- tringency. The increment of this sensation was particu- larly evident for three samples, Lung Chin (G7-G8), Sen- cha Fuji-jama (G9-G10) and Bancha Yanaghica (G13- G14), whose total phenol and catechin content was sig-
nificantly influenced by the extraction time (Table 3).
Similarly, the extraction time affected the position of the black tea infusions in the e-tongue score plot; samples extracted for 10 min moved to the left on PC1 and the direction coincided with an increase of astringency sen- sation.
In order to evaluate the aroma profile of the different types of tea and the aroma evolution related to the infu- sion time, e-nose data were collected and elaborated by PCA.
prising non-terpenoid and terpenoid components. Non- terpenoids found in tea are chetones, aldehydes, alcohols and alkenyl-2-ones produced during lipid degradation. Main terpenoids are monoterpene alchohols, including linalool and geraniol [25,26]. The fermentation process of black tea causes changes in the quality and quantity of volatiles and affects tea aroma by reducing the grassy and green characters, typical of green teas, and increas- ing fruity/floral and other fermented characters. A total of more than 70 volatile flavour compounds have been detected in tea, but few of them showed significant dif- ferences between unfermented green tea and fermented black tea [27].
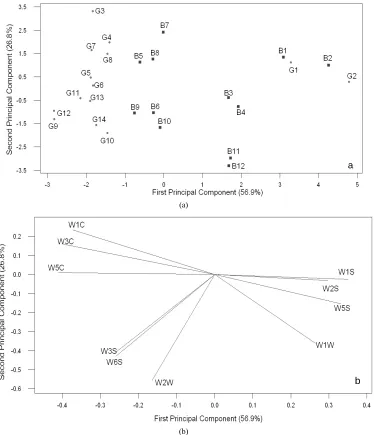
Figure 2 reports the e-nose score plot (a) and loading
plot (b) of the examined infusions. The variance explain- ed by the first two principal components was 83.7%.
The score plot (Figure 2(a)) showed the ability of the
e-nose in discriminating green and black tea infusions by their aromatic profile. In particular, green teas were grouped at the left of PC1 (explained variance 56.9%) with the exception of Hojicha green tea (G1-G2); black teas resulted more dispersed along PC1. Along PC2 (ex- plained variance 26.8%) the Chinese green teas Chun Mee (G3-G4) and Lung Chin (G7-G8), positioned in the upper part, were discriminated by the Japanese teas Sen- cha Tokumushi (G5-G6), Sencha Fuji-yama (G9-G10), Sencha Ariake (G11-G12) and Bancha Yanagicha (G13- G14), positioned in the lower part. The process by which
a
(a)
b
(b)
Figure 2. Principal component analysis of electronic nose data: Score plot (a) and loading plot (b) of green and black teas in he plane defined by the first two principal components.
Japanese teas are manufactured differs from Chinese green teas, which are initially pan-fired. Japanese green teas are first steamed to prevent oxidation of the leaves and then the leaves are rolled, shaped, and dried. These processes impart differences in the flavour of Chinese and Japanese green teas, in particular Japanese teas have a vegetal, al- most grassy flavour while Chinese teas are richly flavour- ed with some grassy tones and a noticeable toasty char- acter [28,29]. From the e-nose loading plot (Figure 2(b))
it can be noticed that the volatile components of green teas were perceived by WC sensors (W1C, W3C and W5C), specific for aromatic compounds and by W3S and W6S sensors, specific for aliphatic compounds. These sensors were able to detect the vegetative tones of green teas; moreover WC sensors discriminated Chinese teas revealing the characteristic aroma of pan-fired teas. For black teas, fruity/floral/spicy characters were detected by WS sensors (W1S, W2S, W5S), characterized by a broad range sensitivity, and by WW sensors (W1W, W2W), sensitive to many terpenes. Hojicha green tea (G1-G2), positioned at the right of the e-nose score plot, was com- pletely discriminated by the other green teas and charac- terized by WS sensors (W1S, W2S, W5S). As for the taste, its aroma was totally different from that of the other green teas and seemed to be more similar to black teas, in particular to Pettiagalla (B1-B2), which is known to be a highly aromatic tea with a spicy and slightly malty character. In Hojicha tea, the roasty aroma is pre- dominant and replaces the vegetative tones typical of green teas.
The effect of the extraction time on tea aroma was also evaluated. As shown by the arrows in the e-nose score plot (Figure 2(a)), green and black teas infused for 10
min were shifted on the second and on the first principal
components and the direction coincided with the increase in the response of WW sensors, specific for terpenoids, and WS sensors of broad range sensitivity.
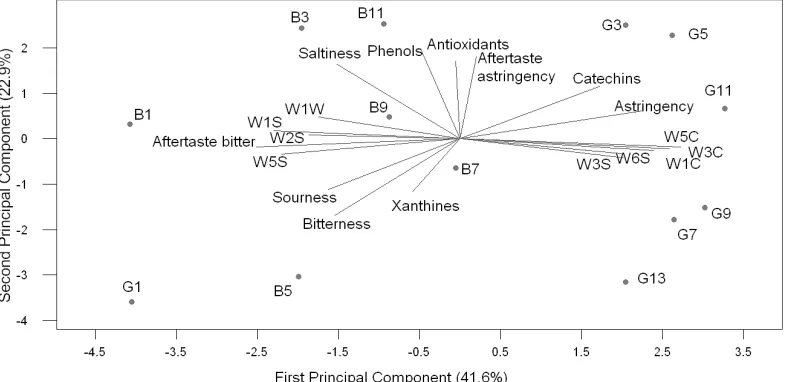
Data collected from e-nose and e-tongue were elabo- rated together with the chemical parameters by PCA. Fig- ure 3 reports the bi-plot in the plane defined by the first
two Principal Components (explained variance 64.3%), of black and green teas infused for 5 and 3 min, respec- tively.
Considering the variable distribution in the plot and their relationship, e-nose variables, astringency, aftertaste bitterness and catechins were dominant on PC1, while to- tal phenols, antioxidant activity, xanthines, aftertaste as- tringency, bitterness, saltiness and sourness were domi- nant on PC2. In particular on PC1, astringency sensation was related to catechins; on PC2, total phenols were well correlated to antioxidant activity and aftertaste astringen- cy, while bitterness was related to xanthines. Considering the sample distribution, green teas located at the right of the plot were characterised by astringency sensation, by catechins and by WC (W1C; W3C; W5C) and WS (W3S, W6S) e-nose sensors. Among green teas, samples poor in catechins (Bancha Yanagicha-G13, Sencha Fuji-yama- G9, Lung Ching-G7) were located in the lower part of PC2 and were perceived as less astringent, while samples characterized by high catechin content (Chun Mee-G3, Sencha Tokumushi-G5, Sencha Ariake-G11) were loca- ted in the upper part of PC2 and were characterized by astringent sensation. Hojicha green tea (G1), positioned at the left of the plot, is completely discriminated by the other green teas; due to the roasting process, this tea is very low in catechins, is characterized by bitterness and perceived as the least astringent. Black teas were more dispersed along PC1, and compared to green teas were
[image:9.595.103.498.517.708.2]perceived as more bitter, salty and were discriminated by WS (W1S; W2S; W5S) and W1W e-nose sensors. Among black teas, Keemun (B5) is a Chinese tea characterized by bitter taste; it contains the lowest amount of catechins and the highest amount of xanthines (Tables 2 and 3).
The two Indian teas Darjeeling Ambootia (B3) and Dar- jeeling Margaret’s Hope (B11), characterized by the hi- ghest concentration of catechins, total phenols and anti- oxidant power and by a low content of xanthines (Tables 2 and 3), were located in the upper left quadrant of the
plot; among black teas they were perceived as the least bitter and were discriminated by saltiness and aftertaste astringency. Pettiagalla (B1), located at the right of PC1, had a low content of xanthines and catechins, was char- acterized by aftertaste bitterness and among black teas was perceived as the least astringent.
4. Conclusions
Results obtained in this work indicate that, considering our samples, black teas had higher total phenol concen- tration than green teas; instead, green tea infusions show- ed higher catechin content. Prolonged infusion time in- creased the extraction of total polyphenols both in black and green teas, while catechin and methilxanthine con- centrations were less affected by the extraction time. E- tongue and e-nose were able to discriminate green tea from black tea infusions on the basis of their taste and aroma. Green teas were characterized by astringency and aftertaste-astringency and this sensation was increased by longer infusion time; black teas were perceived as more bitter, sour and salty and prolonged extraction time en- hanced the astringency character. The aroma profile of both green and black teas infused for longer time shifted towards an increased response of sensors specific for terpenoids and of broad range sensitivity, thus indicating a greater extraction of some volatile compounds which produces more richly flavoured infusions.
The multivariate statistical elaboration of e-nose and e-tongue data together with chemical parameters eviden- ced a clear correlation between the chemical composition of tea infusions and their sensorial properties.
5. Acknowledgements
The Authors would thank Mrs Barbara Sighieri, owner of the specialized tea shop “La Teiera Ecclettica” in Milan, for providing samples and information about teas.
REFERENCES
[1] Y. Shishikura and S. Khokhar, “Factors Affecting the Levels of Catechins and Caffeine in Tea Beverage: Esti- mated Daily Intakes and Antioxidant Activity,” Journal of the Science of Food and Agriculture, Vol. 85, No. 12,
2005, pp. 2125-2133. doi:10.1002/jsfa.2206
[2] D. A. Balentine, S. A. Wiseman and L. C. M. Bouwens, “The Chemistry of Tea Flavonoids,” CRC Critical Re- views in Food Science and Nutrition, Vol. 37, No. 8, 1997, pp. 693-704. doi:10.1080/10408399709527797
[3] C. Lakenbrink, S. Lapczynski, B. Maiwald and U. H. En- gelhardt, “Flavonoids and Other Polyphenols in Consu- mer Brews of Tea and Other Caffeinated Beverages,” Journal of the Science of Food and Agriculture, Vol. 48, No. 7, 2000, pp. 2848-2852. doi:10.1021/jf9908042 [4] C. Astill, M. R. Birch, C. Dacombe, P. G. Humphrey and
P. T. Martin, “Factors Affecting the Caffeine and Plyphe- nol Contents of Black and Green Tea Infusions,” Journal of Agricultural and Food Chemistry, Vol. 49, No. 11, 2001, pp. 5340-5347. doi:10.1021/jf010759+
[5] V. Sharma, A. Gulati and S. D. Ravindranath, “Extracta- bility of Tea Catechins as a Function of Manufacture Pro- cedure and Temperature of Infusion,” Food Chemistry, Vol. 93, No. 1, 2005, pp. 141-148.
doi:10.1016/j.foodchem.2004.10.016
[6] V. Sharma, A. Gulati, S. D. Ravindranath and V. Kumar, “A Simple and Convenient Method for Analysis of Tea Biochemicals by Reverse Phase,” HPLC Journal of Food Composition and Analysis, Vol. 18, No. 6, 2005, pp. 583- 594. doi:10.1016/j.jfca.2004.02.015
[7] D. J. Yang, L. S. Hwang and J. T. Lin, “Effects of Diffe- rent Steeping Methods and Storage on Caffeine, Cate- chins and Gallic Acid in Bag Tea Infusions,” Journal of Chromatography A, Vol. 1156, No. 1-2, 2007, pp. 312- 320. doi:10.1016/j.chroma.2006.11.088
[8] D. Horzic, D. Komes, A. Belscak, K. K. Ganic, D. Ive- kovic and D. Karlovic, “The Composition of Polyphenols and Methylxanthines in Teas and Herbal Infusions,” Food Chemistry, Vol. 115, No. 2, 2009, pp. 441-448.
doi:10.1016/j.foodchem.2008.12.022
[9] W. J. Cheong, M. H. Park, G. W. Kang, J. H. Ko and Y. J. Seo, “Determination of Catechin Compounds in Korean Green Tea Infusions under Various Extraction Conditions by High Performance Liquid Chromatography,” Bulletin of the Korean Chemical Society, Vol. 26, No. 5, 2005, pp. 747-754. doi:10.5012/bkcs.2005.26.5.747
[10] Perva-Uzunalic, M. Skerget, Z. Knez, B. Weinreich, F. Otto and S. Gruner, “Extraction of Active Ingredients from Green Tea (Camellia Sinensis): Extraction Efficien- cy of Major Catechins and Caffeine,” Food Chemistry, Vol. 96, No. 4, 2006, pp. 597-605.
doi:10.1016/j.foodchem.2005.03.015
[11] S. Scharbert, N. Holzmann and T. Hofmann, “Identifica- tion of the Astringent Taste Compounds in Black Tea In- fusions by Combining Instrumental Analysis and Human Bioresponse,” Journal of Agricultural and Food Chemis- try, Vol. 52, No. 11, 2004, pp. 3498-3508.
[12] H. Yu and J. Wang, “Discrimination of LongJing Green- Tea Grade by Electronic Nose,” Sensors and ActuatorsB, Vol. 122, No. 1, 2007, pp. 134-140.
doi:10.1016/j.snb.2006.05.019
and R. Bandyopadhyay, “Electronic Nose for Black Tea Quality Evaluation by an Incremental RBF Network,” Sensors and Actuators B, Vol. 138, No. 1, 2009, pp. 90- 95. doi:10.1016/j.snb.2009.02.025
[14] H. Yu, J. Wang, H. Xiao and M. Liu, “Quality Grade Iden- tification of Green Tea Using the Eigenvalues of PCA Based on the E-Nose Signals,” Sensors and Actuators B, Vol. 140, No. 2, 2009, pp. 378-382.
doi:10.1016/j.snb.2009.05.008
[15] N. Bhattacharyya, S. Seth, B. Tudu, P. Tamuly, A. Jan, D. Ghosh, R. Bandyopadhyay and M. Bhuyan, “Monitoring of Black Tea Fermentation Process Using Electronic Nose,” Journal of Food Engineering, Vol. 80, No. 4, 2007, pp. 1146-1156. doi:10.1016/j.jfoodeng.2006.09.006 [16] N. Bhattacharyya, B. Tudu, A. Jana, D. Ghosh, R. Ban-
dyopadhyay and M. Bhuyan, “Preemptive Identification of Optimum Fermentation Time for Lack Tea Using Elec- tronic Nose,” Sensors and Actuators B, Vol. 131, No. 1, 2008, pp. 110-116. doi:10.1016/j.snb.2007.12.032 [17] Q. Chen, J. Zhao and S. Vittayapadung, “Identification of
Green Tea Grade Level Using Electronic Tongue and Pat- tern Recognition,” Food Research International, Vol. 41, No. 5, 2008, pp. 500-504.
doi:10.1016/j.foodres.2008.03.005
[18] M. Palit, B. Tudu, N. Bhattacharyya, A. Dutta, P. K. Dut- ta, A. Jana, R. Bandyopadhyay and A. Chatterjee, “Com- parison of Multivariate Preprocessing Techniques as Ap- plied to Electronic Tongue Based Pattern Classification for Black Tea,” Analytica Chimica Acta, Vol. 675, No. 1, 2010, pp. 8-15. doi:10.1016/j.aca.2010.06.036
[19] W. He, X. Hu, L. Zhao, X. Liao, Y. Zhang, M. Zhang and J. Wu, “Evaluation of Chinese Tea by Electronic Tongue: Correlation with Sensory Properties and Classification According to Geographical Origin and Grade Level,” Food Research International, Vol. 42, No. 10, 2008, pp. 1462-1467. doi:10.1016/j.foodres.2009.08.008
[20] R. Banerjee, B. Tudu, L. Shaw, A. Jana, N. Bhattacharyya and R. Bandyopadhyay, “Instrumental Testing of Tea by Combining the Responses of Electronic Nose and Ton- gue,” Journal of Food Engineering, Vol. 110, No. 3, 2012, pp. 356-363. doi:10.1016/j.jfoodeng.2011.12.037
[21] L. Peng, X. H. Song, X. G. Shi, J. Li and C. X. Ye, “An Improved HPLC Method for Simultaneous Determination of Phenolic Compounds, Purine Alkaloids and Theanine
in Camellia Species,” Journal of Food Composition and Analysis, Vol. 21, No. 7, 2008, pp. 559-563.
doi:10.1016/j.jfca.2008.05.002
[22] V. L. Singleton and J. A. Rossi “Colorimetry of Total Phe- nolics with Phosphomolybdic-Phosphotungstic Acid Re- agents,” American Journal of Enology and Viticulture, Vol. 16, No. 3, 1965, pp. 144-158.
[23] S. Buratti, M. Scampicchio, G. Giovanelli and S. Man- nino, “A Low-Cost and Low-Tech Electrochemical Flow System for the Evaluation of Total Phenolic Content and Antioxidant Power of Tea Infusions,” Talanta, Vol. 75, No. 1, 2008, pp. 312-316.
doi:10.1016/j.talanta.2007.11.014
[24] Y. Kobayashi, M. Habara, H. Ikezazki, R. Chen, Y. Naito and K. Toko, “Advanced Taste Sensors Based on Artifi- cial Lipids and Global Selectivity to Basic Taste Qualities and High Correlation to Sensory Scores,” Sensors, Vol. 10, No. 4, 2010, pp. 3411-3443. doi:10.3390/s100403411 [25] J. A. B. Baptista, J. F. P. Tavares and R. C. B. Carvalho,
“Comparison of Catechins and Aromas among Different Green Teas Using HPLC/SPME-GC,” Food Research In- ternational, Vol. 31, No. 10, 1998, pp. 729-736.
doi:10.1016/S0963-9969(99)00052-6
[26] P. Pripdeevech and T. Machan, “Fingerprint of Volatile Flavour Constituents and Antioxidant Activities of Teas from Thailand,” Food Chemistry, Vol. 125, No. 2, 2011, pp. 797-802. doi:10.1016/j.foodchem.2010.09.074 [27] L. F. Wang, J. Y. Lee, J. O. Chung, J. H. Baik, S. So and
S. K. Park, “Discrimination of Teas with Different De- grees of Fermentation by SPME-GC Analysis of the Cha- racteristic Volatile Flavour Compounds,” Food Chemistry, Vol. 109, No. 1, 2008, pp. 196-206.
doi:10.1016/j.foodchem.2007.12.054
[28] K. Kumazawa and H. Masuda, “Identification of Potent Odorants in Japanese Green Tea (Sen-cha),” Journal of Agricultural and Food Chemistry, Vol. 47, No. 12, 1999, pp. 5169-5172. doi:10.1021/jf9906782