GIS Data Integration to Manage Waterlogging Problem
on the Eastern Nile Delta of Egypt
M. F. Kaiser, A. El Rayes, K. Ghodeif, B. Geriesh Geology Department, Suez Canal University, Ismailia, Egypt
Email: [email protected]
Received March 3, 2013; revised April 6, 2013; accepted May 4, 2013
Copyright © 2013 M. F. Kaiser et al. This is an open access article distributed under the Creative Commons Attribution License,
which permits unrestricted use, distribution, and reproduction in any medium, provided the original work is properly cited.
ABSTRACT
Three sets of satellite data were utilized to outline and monitor the waterlogging problems along the Wadi El Tumilate basin. These data include Thematic Mapper image for year 1984, Enhanced Landsat Thematic Mapper image for year 2000 and SPOT-4 image for year 2008. Supervised classification using the maximum likelihood approach has been performed. A number of 6 classes were observed at the study sites including, Nile deposits and cultivated areas, surface water and water logged areas, salt crust, Quaternary playa deposits, fluviatile and lacustrine deposits and Miocene (gypsum and carbonate) deposits. Water logged areas expanded from 9.1 km2 in year 1984 to 18.8 km2 in year 2000 to 25.3 km2 in year 2008, with a rate of 0.7 km2/year. At the same time, vegetation cover shows an increase from 453 km2 in year 1984 to 719 km2 in year 2008. The integrated data used by Geographic Information Systems specified factors controlling waterlogging problems, which are: topography, drainage pattern and water flow direction, excess of irriga- tion water, deficiency of drainage system, presence of impermeable clay lenses and lineaments direction. Groundwater modeling including GMS and MODFLOW programs were processed to manage waterlogging problem. Using of un- derground tile drain along the eastern portion of Wadi El Tumilate basin and dewatering wells along the western side was recommended to obtain the highest monetary return from the drainage investment.
Keywords: Waterlogging; Groundwater Modelling; GIS; Remote Sensing; Image Enhancement and Water Resource Management
1. Introduction
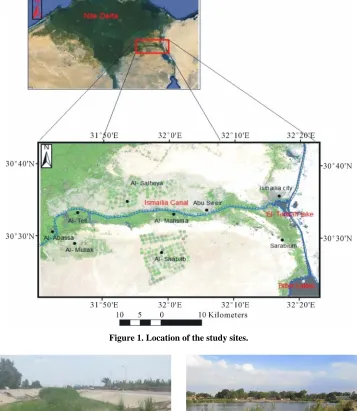
Wadi El-Tumilate basin is a morphotectonic depression crosses Ismailia governorate from west to east along its middle part and separates between two higher elevated geomorphologic units namely; Um-Gedam gravely slopes to the south and El-Salhiya gravely plain to the north. It is located between longitudes 31˚30 to 32˚40E and lati- tudes 29˚50 to 30˚50N (Figure 1). It occupies an area of about 350 km2, extending from the Nile Delta from the west to the El-Timsah and Bitter Lakes to the east with about 50 km long and 7 km average width. Its altitude varies from 10 m at west to 0 m at east with very gentle slope towards east. The study site is planned within three main mega land reclamation projects in the Suez Canal province during the digging of Ismailia Canal course in 1869. The wadi floor is covered by cultivated lands which rest on, silty and loamy fine sand soil. The south- ern boundary of the wadi is occupied by elongated and parallel sand dunes.
In irrigation areas, farmers may not be able to control
irrigation, which usually results in excess water being added to the groundwater. Continued irrigation with ex- cess water induces rising of the ground water table [1]. Water logging at low lying areas is created by seepage of water from irrigated uplands and from canal systems [2]. Over-irrigation by canal water besides inadequate water management practices culminates in water logging [3]. During the last three decades, groundwater level at some localities in Wadi El-Tumilate basin and its vicinities is remarkably raised. This caused flooding of many infra- structures, houses, agricultural lands, industrial zones and electricity towers and endangers the accessible railways and asphaltic roads in some areas (Figure 2). The con- cerned site represents a morpho-tectonic stretch which is characterized by the occurrence of sticky clay lenses and wide evaporite deposits. Wadi El-Tumilate area is char- acterized by arid, long hot, rainless summer and mild winter. The average annual precipitation reaches up to 30 mm.
Figure 1. Location of the study sites.
Water logging beside the asphaltic road in Al-Tell Water logged areas in Abu Sweir
[image:2.595.111.491.436.718.2]
Industrial factories around waterlogged areas Electric towers above waterlogged areas
in its thickness between 0.5 and 6 m. Groundwater re- sources along Wadi El-Tumilate are presented by two main hydrogeologic units; the near upper surface semi- permeable aquitard unit and the lower highly permeable aquifer unit (Geriesh, 1994).
The structural frame work of the study site is subjected by two main fault groups comprising ENE-WSW and NNW-SSE directions. The ENE-WSW faults configure a number of parallel morphotectonic basins controlling the depositional regime, thickness and configuration of the overlying Quaternary sediments and configure the main water bearing formation.
The impeded alluvial sand-clay complex plays an es- sential role as a restricting boundary for vertical move- ments of irrigated water. Depth of the sand-clay complex varies from 0.6 m to 2.8 m below ground surface along the main wadi and increases to 12m along the sandy banks. Climatic parameters reveal that the rainfall has no sig- nificant role in creating the water logging problem. This research aims to detect, delineate and measure the wa- terlogged areas in Wadi El Tumilate basin during 1984 to 2008. The main factors controlling waterlogging disaster will be specified. This problem will be managed using groundwater modeling in compiled with GIS techniques.
2. Remote Sensing Techniques and Results
Three sets of remote sensing data are acquired in this study aiming to detect, outline and monitor waterlogging problem at the wadi El Tumilate basin. These data in- cludes Thematic Mapper images for year 1984, En- hanced Landsat Thematic Mapper images for year 2000, Spot-4 images for year 2008, all images are collected in June to be representative for summer season. Remote Sensing and GIS techniques can be extremely useful in accurate mapping and quantification of waterlogged area [4]. Remote sensing procedures used in this research can be categorized into the following operations: image en- hancement, image classification and change detection.
2.1. Image Enhancement
ENVI 4.7 was used to do mosaicking for the two recti- fied images Spot-4 data for year 2008. Mosaicking in- volves combining multiple images into a single compos- ite image. ENVI provides interactive capabilities for placing non-georeferenced images within a mosaic, and automated placement of georeferenced images within a georeferenced output mosaic. Multi-temporal satellite data were used for continuous monitoring of the water logging dynamics, prediction and history.
Image enhancement including, contrast stretching, spa- tial filtering were used to produce high spectral resolution images required to detect and monitor water logged areas during 1984-2008. Contrast manipulation procedures are
thus essential to most visual analyses. This systemati- cally expands the range of DN values to the full limits determined by byte size in the digital data. For Landsat this is determined by the eight bit mode (28) or 0 to 255 DNs [5]. The most appropriate band combination giving high contrast among land covers were selected; band combination 742, RGB was used for TM images for year 1984 and ETM+ for year 2000. The mosaic Spot image for year 2008 was processed with band combination 432, RGB. The goal of fusing data from different sensors is to reduce the classification error rate obtained by single source classification [6]. Images data fusion was applied in this study between ETM+ (Enhanced Thematic Map- per) and ASTER (Advanced Spaceborne Thermal Emis- sion and Reflection) for year 2000 to improve informa- tion extraction in irrigated settings. The fused image was utilized to extract lineaments and major structures con- trolling the distribution of water logged areas at the con- cerned sites.
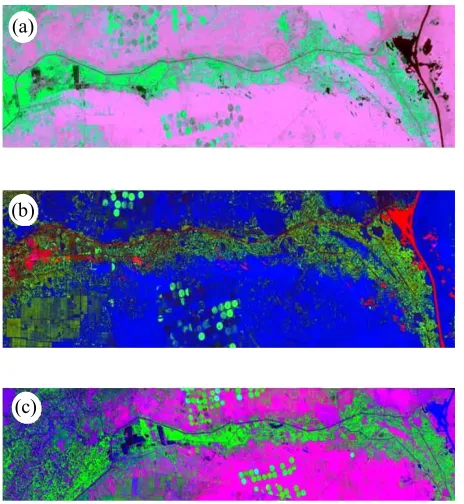
Ratio images are enhancements resulting from the di- vision of DN values in one spectral band by correspond- ing values in another band [7]. Rationed images are often useful to discriminate spectral variations in the images from individual spectral bands [5]. The most appropriate band combination ratios, confirming the results obtained during the field investigation, were utilized for the im- ages data. Band ratioing 7/4, 4/2, 7/2 were used in band combination R, G, B for the TM satellite image for year 1984. Band combination ratioing 6/5, 4/3, 2/1 were used as RGB for ETM+ image data for year 2000. For the SPOT-4 images, band ratioing 2/1, 3/2, 4/3 was used as band combination R, G, B for year 2008 (Figure 3).
Principal Components Analysis (PCA) is a linear trans- formation technique related to Factor Analysis. Colour composites made from images representing individual components often show information not evident in other enhancement products [5]. Principal Component Analyses PC4, PC2, PC1 for TM 1984, PC4, PC3, PC2 for ETM+ 2000 and PC1, PC2, PC3 for SPOT-4 image 2008 are used as band combination R, G, B to get the most appropriate enhancement showing the distribution of water logged areas.
2.2. Image Classification
(a)
(b)
[image:4.595.58.290.83.335.2](c)
Figure 3. Band ratio combination 7/4, 4/2, 7/2, RGB for TM in year 1984, (b) 6/5, 4/3, 2/1, RGB for ETM+ in year 2000 and (c) 2/1, 3/2, 4/3, RGB for SPOT images in year 2008.
Unsupervised classification was performed to classify the land covers at the study sites and monitoring the changes during the last three decades from year 1984 and year 2008. 100 ground control points were checked. The num- ber of classes was determined by hierarchical clustering. Supervised classification using the maximum likelihood approach has been performed.
Image accuracy was assessed, it was 86%. A number of 6 classes were observed at the study sites (Figure 4) including, Nile deposits and cultivated areas with green colour, surface water and water logged areas with red colour, salt crust areas with dark blue colour, Quaternary playa deposits with yellow colour, fluviatile and lacus- trine deposits with pale blue colour and finally, Miocene (gypsum and carbonate deposits) with violet colour.
2.3. Change Detection
Landuse/landcover changes were noticed following im- age classification and identifying the changes during 1984-2008. Significant changes produced due to human activities including an increase in vegetation cover and water logged areas. However, quaternary deposits includ- ing playa, fluviatile and lacustrine deposits decreased from year 1984 to year 2008. The most important output from the analysis of remote sensing data is the delinea- tion of water spread area which represents the surface waterlogged area. Vegetation and cultivated areas show significant increase along Ismailia canal. Some cultivated lands are subjected to salinization and salt crust during
(a)
(b)
Figure 4. Image classifications for (a) TM in year 1984 and (b) SPOT images data in year 2008.
summer due to evaporation and an increase in tempera- ture.
3. GIS Data Integration
Remote sensing often requires other kinds of ancillary data to achieve both its greatest value and the highest levels of accuracy as a data and information production technology [11]. Remote sensing (RS) and geographical information system (GIS) offers convenient solutions to map the extent and severity of water logging, particularly in large areas. GIS helps in assessing the water logging and drainage problem by identifying the drainage net- work and its characteristics in a basin besides the infor- mation on presence of high water table, high morphology, plant stress and drainage water collection in lower spots.
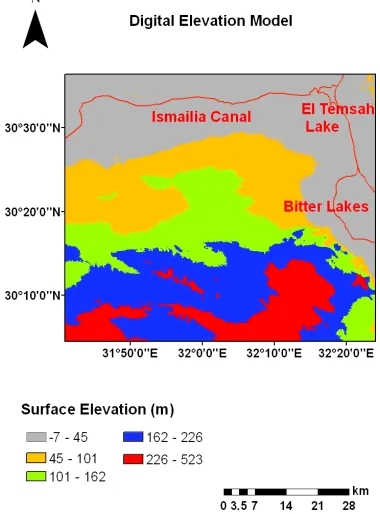
[image:4.595.334.513.83.334.2]watershed polygons and the four-point linkage informa- tion can be transferred to vector based GIS for further analysis. [13] used GIS to diagnose and map waterlog- ging and salinity risks in the Mediterranean region and to investigate drainage needs. One of the techniques to achieve improvement in digital classification is the in- corporation of ancillary data, such as a digital elevation model (DEM), [14]. DEM integration in image classifi- cation has helped increase the classification accuracy of digital data [15]. A DEM has also been used to describe the distribution of terrain components which contribute to spectral response [16], identify sites for fieldwork, geographically stratify training areas or homogeneous regions, and provide topographic normalization of Land- sat TM digital imagery [17]. The hydrogeology tools in ArcGIS provide a method to describe the physical char- acteristics of a surface. Using a digital elevation model (DEM) as input. Topographic map of the area of study was constructed (Figure 5) and the drainage system can be delineated, drainage water flow was directed towards the Ismailia canal, therefore, it can be considered as the main source of water logging due to the intensive rainfall during the winter season. Water logged areas were out- lined and measured using ArcGIS 10 during years 1984- 2008. The results indicate that its surface areas increases from 9.1 km2 in year 1984, 18.8 km2 in year 2000 and 25.3 km2 in year 2008, with a rate of 0.7 km2/year.
[image:5.595.77.267.451.708.2]At the same time, vegetation cover shows an increase from 453 km2 in year 1984 to 719 km2 in year 2008. This
Figure 5. Topographic map extracted from digital elevation model SRTM image data.
means that there is positive correlation between agricul- tural activities and waterlogged areas.
4. Ground Water Modeling Results
Management of waterlogging problem in Wadi El Tumi- late basin was processed using GMS and MODFLOW programs. Groundwater modeling procedure depends on specific input data including, water table, soil texture, drainage rate and depths of clay layer [18]. Drain spacing and effective depths required to mitigate waterlogging problem were determined based on the following equa- tion:
2a 4 Km 2De m L
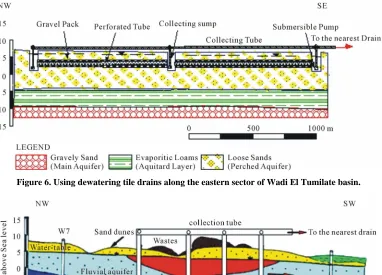
where, υa is drainage rate, K is hydraulic conductivity, De is the effective depth of restricting layer below drain center, m is height of water table above drain center mid-way between drains and L is the spacing distance be- tween drains [19]. Boundary conditions were adjusted to calibrate and verify groundwater simulation with meas- ured data collected by [20]. Values of discharge rates were varied till achieving real observed data with the least error. Groundwater modeling in this study predicted that the drainage spacing ranges from 111 m in case of using drip irrigation techniques (rate of irrigation is about 0.014 m/d, [21]) to 145 m in case of using flood irrigation techniques (0.023 m/d). Two solutions were proposed to improve the drainage efficiency in Wadi El Tumilate basin. Under- ground tile drain should be applied along the eastern sector of the concerned site (Figure 6). While, using of dewatering wells was proposed along the western up- stream sector (Figure 7). In addition, reuse of the logged water by mixing it with canal water leads to ameliorate its water quality required for irrigation and decline the ground- water level.
5. Discussion
Figure 6. Using dewatering tile drains along the eastern sector of Wadi El Tumilate basin.
Figure 7. Using dewatering wells along the western sector of Wadi El Tumilate basin.
earth surface (<1 m depth) and 4) lineaments direction. Digital Elevation Model extracted from the SRTM data shows that the waterlogged areas are distributed at low topographic localities (Figure 8). The area having a low lying topography has numerous topographic depres- sions which are poorly drained topographically and re- main waterlogged throughout the year. The drainage pat- tern extracted from the ETM+ image data and SRTM (DEM) using ArcGIS 10 techniques show that all tribu- taries are accumulated toward the water logging localities (arrow directions). This indicate that during the intensive rain fall, all surface and subsurface water are going along these tributaries and accumulate water at the low topog- raphic areas and producing water logging problems.
Figure 8. Waterlogged sites showing white colour that is closely distributed at the low topographic areas (grey col- our).
W-E and NW-SE trends (CONOCO map for year 1981). Change detection image processing techniques be-
tween TM image data for year 1984 and the SPOT-4 image data for year 2008 at the study sites indicate that there is a positive relationship between the cultivated areas and waterlogged areas. Field observations indicate that the lower the value of the clay depth, the higher the risk for water logging and soil salinity, especially where the artificial drains are limited. Furthermore, it was no- ticed that the sand dunes and the water logged sites are distributed at the same trend of lineaments which are
Application of GMS and MODFLOW modeling were utilized to manage and mitigate the waterlogging prob- lem in the study site. The drainage spacing required for each irrigation technique was predicted. It is 0.14 m/d and 0.023 m/d in case of drip and flood irrigation techniques, respectively.
to improve the drainage water systems.
6. Conclusion
GIS data integration of remote sensing images and groundwater modeling are utilized to assess water logging problem and manage drainage deficiency along Wadi El Tumilate basin. Drainage network was constructed using Digital Elevation Model (DEM) as a part of GIS analysis. Water logged areas were outlined and measured using ArcGIS 10 during years 1984-2008. Remote sensing re- sults indicate that its surface areas increases from 9.1 km2 in year 1984, 18.8 km2 in year 2000 and 25.3 km2 in year 2008, with a rate of 0.7 km2/year. At the same time, vegetation cover shows an increase from 453 km2 in year 1984 to 719 km2 in year 2008. This reflects a positive correlation between agricultural activities along the ex- tendable desert fringes and water logging areas of the wadi basin. The rate of groundwater rising around the waterlogged sites varies between 3 - 8 cm/year. Remote sensing and GIS result indicated that waterlogging prob- lem controlled by topography and surface elevation, dra- inage pattern and water flow direction, excess of irriga- tion water and deficiency of drainage system and pres- ence of impermeable clay lenses near the earth surface (<1 m depth) and finally, lineaments direction. About 7.2% of the old cultivated lands (25.3 km2 out of 350 km2) are drowning under the logged water. Modeling results proposed two solutions to improve drainage efficiency. It includes using of underground tile drains and dewatering wells along the eastern and western sectors of Wadi El Tumilate basin, respectively. GMS and MODFLOW groundwater modeling were used to mitigate waterlog- ging phenomena and to predict the most appropriate dra- inage spacing.
REFERENCES
[1] H. Bouwer, “Groundwater Hydrology,” In: McGraw-Hill Series in Water Resources and Environmental Engineer-ing, Library of Congress, Washington DC, 1978, pp. 294-
299.
[2] M. A. Chitale, “Environmental Management in Water Re- sources Project-Indian Experiences of Irrigation Power Project,” Journal of Indian Water Resources, Vol. 1, No.
2, 1991, pp. 56-59.
[3] G. C. Mishra, S. Kumar, B. Kumar and M. Shukla, “Sub- surface Drainage Investigation in Stage II of Indira Gan- dhi Nahar Pariyojna at RD 38,” Technical Report, Na- tional Institute of Hydrology, 1996.
[4] G. M. Wim, D. Bastiaanssen, J. Molden and I. W. Makin, “Remote Sensing for Irrigated Agriculture: Examples from Research and Possible Applications,” Agricultural Water Management, Vol. 46, No. 2, 2000, pp. 137-155. doi:10.1016/S0378-3774(00)00080-9
[5] M. Sonka, V. Hlavac and R. Boyle, “Image Processing,
Analysis and Machine Vision,” Chapman & Hall, London, 1993.
[6] O. Mutlu, Y. Yang, A. George and C. Chelsea, “Remote Sensing of Irrigated Agriculture: Opportunities and Chal- lenges,” Remote Sensing, Vol. 2, No. 9, 2010, pp. 2274-
2304. doi:10.3390/rs2092274
[7] T. M. Lillesand and R. W. Kiefer, “Remote Sensing and Image Interpretation,” 4th Edition, John Wiley and Sons, New York, 2000.
[8] T. M. Lillesand and R. W. Kiefer, “Remote Sensing and Image Interpretation,” John Wiley & Sons, New York, 1994.
[9] T. M. Lillesand, R. W. Kiefer and J. W. Chipman, “Re- mote Sensing and Image Interpretation,” John Wiley & Sons, Inc., New York, 2004.
[10] A. Singh, “Digital Change Detection Techniques Using Remotely-Sensed Data,” International Journal of Remote Sensing, Vol. 10, No. 6, 1989, pp. 989-1003.
doi:10.1080/01431168908903939
[11] S. Jeffrey and E. John, “Geographic Information Systems, an introduction,” Prentice-Hall, Inc., Upper Saddle River, 1990.
[12] S. K. Jenson and J. O. Dominque, “Extracting Topog- raphic Structure from Digital Elevation Data for GIS Analysis,” Photogrammatery and Remote Sensing, Vol.
54, No. 11, 1988, pp. 1593-1600.
[13] S. Bouarfa and D. Zimmer, “A GIS to Investigate Water- logging and Salinity Hazards in the Mediterranean Re- gion,” International Conference on Land and Water Re- sources Management in the Mediterranean Region, Va-
lenzano, 4-8 September 1994, pp. 629-645.
[14] A. Eiumnoh and R. P. Shrestha, “Application of DEM Data to Landsat Image Classification: Evaluation in a Tropical Wet-Dry Landscape of Thailand,” Photogram- metry and Engineering Remote Sensing, Vol. 66, 2000, pp. 1297-1304.
[15] C. K. Hulchinson, “Techniques for Combining Landsat and Ancillary Data for Digital Classification Improve- ment,” Photogrammetry and Engineering Remote Sensing, Vol. 48, No. 1, 1982, pp. 123-130.
[16] A. H. Strahler, T. L. Logan and N. A. Bryant, “Improving Forest Cover Classification Accuracy form Landsat by Incorporating Topographic Information,” Proceedings of
12th International Symposium on Remote Sensing of the Environment, Manila, 1978, pp. 927-942.
[17] D. L. Civco, “Topographic Normalization of Landsat The- matic Mapper Digital Imagery,” Photogrammetry and Engineering Remote Sensing, Vol. 55, No. 9, 1989, pp. 1303-1309.
[18] M. G. Mc Donald and A. W. Harbough, “A Modular Three-Dimensional Finite-Difference Groundwater Flow Model,” Open-File Report 83-875, US Geological Survey, 1988.
[19] S. B. Hooghoudt, “Bijdragen tot de Kennis van Eenige Natuurkudige Grootheden van de Grond,” Government Printing Office, The Hague, 1940, pp. 515-707,
Evaluation of Groundwater Resources in the Suez Canal Region,” Ph.D. Thesis, Faculty of Science, Suez Canal University, 1994.
[21] H. Bouwer, “Groundwater Hydrology,” In: McGraw-Hill