RESEARCH ARTICLE
CHANGING PATTERN OF INTERNAL MIGRATION IN INDIA: SOME EVIDENCES FROM
CENSUS DATA
Vipul Kant Singh1*, Alok Kumar2, R.D. Singh1 and K.N.S. Yadava1
1 Department of Statistics, Banaras Hindu University Varanasi-221005, U.P.
2 Division of Bio- Statistics, Department of Community Medicine, Institute of Medical Sciences, Banaras Hindu University Varanasi-221005, U.P.
ARTICLE INFO ABSTRACT
Internal migration is a important element of population redistribution and equilibrium. Human mobility within the national boundary is receiving considerable attention in recent decades. The main objective of the study is to explain the changing pattern of internal migration in India over the period 1971 to 2001. Further, an attempt has been made to find out the various determinants causing the changing pattern of migration. The rate of migration among major states of India in last two decades is also worked out through transition probabilities using a stochastic model. In all the four censuses, rural-rural migration was found the dominant migration stream in India. Employment for male and marriage for female were found to be the main reasons for migration respectively. Maharashtra and Madhya Pradesh lead among all in-migrating states, while the states Utter Pradesh and Bihar occupied top place among out-migrating states.
INTRODUCTION
Movement is an essential part for development of any region or country and one of the most distinguished characteristics of human being. Migration is one of the three basic components of population growth of any area, the others being fertility and mortality. It influences size, composition and distribution of population. In middle of the 20th century volume of inter-state migration in India was low due to predominance of agriculture, rigidity of the cast system, the role of joint families, the diversity of language and culture, food habits and lack of education (Chaterjee and Bose, 1997; Nair and Narain, 1985; Zachariah, 1964). But the rapid transformation of Indian economy, improvement in level of education and that of transport and communication facilities, shift of workforce from agriculture to industry and other tertiary activities accelerated mobility among Indian people in recent times. In 2001 census, 309 million persons were migrants on the place of last residence, which constitute about 30 per cent of the total population of the country. This figure indicates an increase of around 37 per cent from 1991(226 million) and 100 per cent since 1971(159 million). Some of the main determinants of migration have been identified as high population density, surplus of labor force, high employment rates, meager incomes, dissatisfaction with housing, demand for higher schooling, rural-urban wage differentials, distance between village and city, pattern of land possession, and the prior migration patterns. The study of migration phenomena-the use of various stochastic models to explain migration- is receiving considerable attention because of the importance of
*Corresponding author: [email protected]
migration in national income and population policies (Bhagat, 2008; Mehta and Kohli, 1993; Premi, 1984). Several researchers (Kadi and Sivamurthy, 1988; Masser and Gould, 1975; Sahota, 1968) have attempted to explain the process of migration through various behavior parameters by formulating and applying different types of migration models. Of these a number of models have been derived on the basis of Zipf’s and Stouffer’s well known ‘gravity’ and ‘opportunity’ hypotheses for both developed and developing countries. Model based on these two ‘gravity’ and ‘opportunity’ hypotheses have been tested by a number of authors, but in every case the formulae have been found to be less than perfect (Langley, 1974). Migration to a particular place of destination varies according to its socio-economic, cultural and other characteristics, rather than its absolute size. In addition, a variable ‘prior migrants’ i.e. the number of people among the past migrants who stayed at the destination has also been found as a proxy to represent the pattern and volume of migration to a particular place of destination (Greenwood, 1971, Levey and Wadycki, 1973; Singh and Yadava, 1974 and 1979; Sivamurthy and Kadi, 1984; Traver and Mcleod, 1973). These authors have shown a high positive relationship between prior migrants and current migrants in migration studies.
The main objective of this paper is to explain the changing patterns of internal migration in India from 1971 to 2001. An attempt has also been made to find out the various determinants causing the pattern of migration. The variation in migration pattern has also been studied through transition probabilities among major state of India -i.e. the probability of migration from one particular state to another- in last two
ISSN:
0975-833X
Available online at http://www.journalcra.com
International Journal of Current Research
Vol. 33, Issue, 4, pp.289-295, April, 2011
INTERNATIONAL JOURNAL OF CURRENT RESEARCH
Article History:
Received 15th
December, 2010 Received in revised form
17th
January, 2011
Accepted 13th
March, 2011
Published online 27th
April 2011
© Copy Right, IJCR, 2011 Academic Journals. All rights reserved.
Key Words:
decades by applying a probability model incorporating prior migrants as one of the explanatory variable.
MATERIALS AND METHODS
The regular decennial census of India is one of the main source, which provides data on migration. In all the censuses from 1872 onward, the migration data have been collected based on “birth place”. However, since 1971 migration data were also collected on the basis of place of last residence and duration of migration. Thus the place of birth and place of last residence of a person provide information on the spatial aspects of movement, while duration of residence provides information on the temporal aspects of migration in the country (Singh, 2005). The data also covers spatial movement of persons based on crossing geographical/ administrative boundaries. Internal migration is classified into three migration streams based on migration distance as:
(i) Intra-district migration, i.e migration within the district
(ii) Inter- district migration, i.e migration from one district to another but within the same state
(iii)Inter-state migration, i.e migration from one state to another.
Migration within the district is called “short-distance” migration, migration within the state across the district is called “medium-distance” migration and migration across state boundary is called “long distance” migration. Again, considering place of birth (or last residence ) and place of enumeration, internal migration within and between rural and urban areas can be classified in four different streams i.e. (i) Rural-Rural (ii) Rural-Urban (iii) Rural (iv) Urban-Urban. In this study, migration data used are taken from the 1971, 1981, 1991 and 2001 censuses of India classified on the basis of place of birth, place of last residence and duration of stay at the place of enumeration. In order to find the estimate of transition probabilities of migration among the major states, a model given by Isserman et.al. (1985) later modified by Kadi (1986) is applied. For the sake of completeness, models are given in the appendix.
RESULTS AND DISCUSSION
Table1 gives the distribution of life time internal migration (on the basis of birth place data) for different migration streams occurred in to last four censuses i.e. 1971 to 2001. This table shows that rural-rural migration has been the most dominant migration stream in India, but its size declined over time for male and female, rural-rural migration accounting for 70 per cent of the total migration in 1971 and 63 per cent in 2001. Male rural- rural migration in 1971 was 53.2 per cent, which gradually declined to 36.4 per cent in 2001. Similarly, female rural-rural migration declined from 77.6 per cent in 1971 to 72.3 per cent in 2001.Where as the proportion of other migration streams have increased over time except urban- rural which slightly declined in 2001only. It is evident from the table that rural- urban stream accounts for about 15 to19 per cent of total migration followed by urban-urban migration stream (9 to13 per cent). In case of rural-urban male migration a gradual increasing trend has been noticed (about 27, 30, 32
and 34 per cent in1971, 1981, 1991 and 2001 respectively), while urban-urban male migration has increased to 23 per cent in 2001 from about 14 per cent in 1971. Urban- rural migration did not show any significant change and has a very low share in comparison to other streams of migration. The last row of table 1 shows the loss of rural population due to migration to urban areas. In all censuses a sex wise analysis of migration shows the loss was more pronounced for male migration rather than the female migration.
Table 2 shows the distribution of life time migration streams according to distance. From this table it is observed that the distance factor plays an important role in explaining migration flow. A distance wise analysis of migration shows that short distance (intra-district) migration has had largest share as compared to medium (inter-district) and long distance (inter-state) migration. In intra district movement the rural-rural migration stream remains the most dominant among all the four migration streams and accounts for about 48 per cent to 55 per cent. In 2001 census intra-district movement accounted for about 66 per cent among female and 45 per cent among male. Dominance of female over male migration in intra-district movement across the different rounds of census may be generally due to customary change from parental to husband’s household due to marriage (Srivastava and Sasi kumar, 2003). It is interesting to note that short distance migration has decreased over the period 1971 to 1991(about 66, 62 and 60 per cents respectively in 1971, 1981 and1991). About one-fourth of the total migration were inter-district (medium distance) between 1971to 2001. Across the four censuses, the inter-district male migrants show a slightly large share than female migrants. In the case of inter-district migration, urban wards (rural-urban and urban-urban) male movement was much higher than rural wards male (urban-rural and (urban-rural- (urban-rural) movement. It gradually increased from 15 per cent (in 1971) to about 20 per cent (in 2001). While due to marriage, migration of female towards rural area (inter-district migration) was higher than that towards urban area. In respect of inter-state migration, rural-urban male migration has increased from 8.1 per cent in 1971to 12.5 per cent in 2001, which is more than all other type of movements. Also in all streams of inter-state migration, male migration was found more extensive than female migration. Thus, it is obvious that migration in India has been inversely proportional to the distance involved. This effect was found to be most significant in case of rural-rural migration. A higher percentage of male migrants in inter-state migration may be attributed due to economic reason. A developed state particularly on economic front either due to agriculture or due to industrial development, attract more male migrants from less developed states. It may be inferred, therefore, that inter-state migration is more economically oriented.
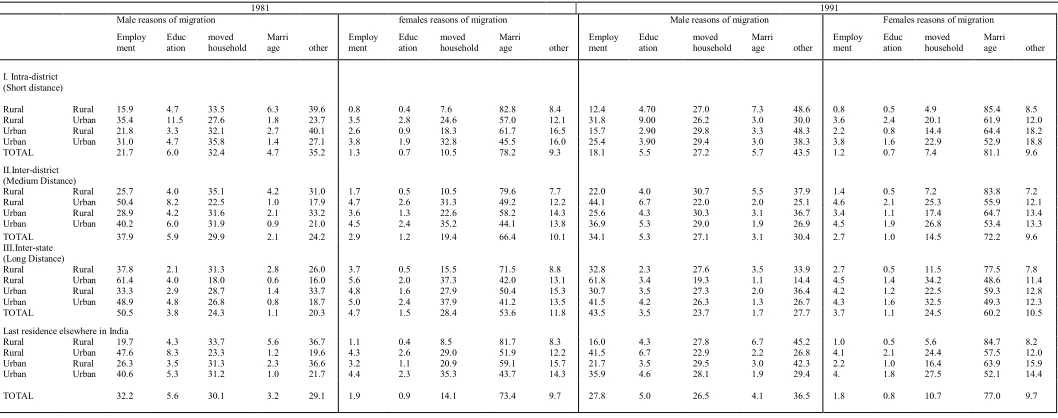
mothers moved to either their natal residence or to a place with better medical facility for delivery. Whereas the women are not treated as migrants at these temporary places or residence, the children born are treated as migrants when they accompany their parents to their place of normal residence. It is observed from table 3 that ‘employment’ for male (about 32, 28 and 36 per cents in 1981, 1991 and 2001 respectively) and ‘marriage’ for female (73, 77 and 76 per cents in 1981, 1991 and 2001 respectively) were the main reasons for migration. Also, movement on account of ‘accompanying parents’ or any other member of family was found second most important reason among males. A distance wise analysis related to male migration shows that the effect of the need for employment as a reason for migration increased significantly for intra-district
(about 22, 18 and 22 per cents), inter-district (about 38, 35 and
40 per cents) and inter-state (about 51, 43 and 55 per cents)
while the migration ‘with any family member(s)’ decreased
with distance in 1981, 1991and 2001 respectively. In case of rural to urban male migrants for employment a gradual
increasing trend has been noticed (27.7 per cent, 41.6 per cent
and 51.0 per cent respectively in1981, 1991 and 2001). While
in case of inter-district it decreased in 1991 (41.1 per cent)
with respect to 1981 (50.4 per cent) and again increased in
2001 (50.5 per cent). It may be noted that inter-state male
migration was maximum for ‘employment’ and increased during the period (1981-2001) for all types. However due to increase in the level of education male migration was found to be declining for all types of migration streams during 1981-2001. The proportion of male migration due to ‘marriage’ was very small in all censuses. It was about 3 per cent in both 1981 and 2001 censuses. Thus, it was observed that the most dominant reason for male migrants was ‘employment’
followed by the ‘move with any family member(s)’.
Among female migrants a social reason such as ‘marriage’ was found to be most important factor in all intra-district, inter-district and inter-state migration streams, which increased in 1991(77 per cent) with respect to 1981 (73.4 per cent) where as it again decreased in 2001 (75.7 per cent).
Intra-district rural-rural female migration due to marriage was
about 85 per cent in 2001 census and it increased by 2.3 per cent compared to 1981 (82.8 per cent). However, the change in female migration due to marriage was found to be higher in case of inter-state migration as compared to others. During 1981-2001 the proportion of female migrants for educational purpose was very small. Surprisingly, the proportion of female migration for employment was also found to be declining for all intra-district, inter-district and inter-state type of migration during this period.
The transition probabilities of inter-state migration for fourteen major states during 1981-91 and 1991-2001 are given in table 4 and table 5 respectively. Transition probability of migration from Karnataka to Andhra Pradesh was 0.18 in 1981-1991 which was declined to 0.15 in 1991-2001. For a better understanding, the probability value of each state is converted to corresponding percentage. The highest increase in the percentage of in-migration was found from Orissa to Maharashtra (4.5 per cent in1981-91 and 21.6 per cent in 1991-2001) followed by Karnataka. In Madhya Pradesh, a larger part of in-migrants was from the two states Orissa and Bihar with a substantial decrease during the period 1991-2001 compared to 1981-91. Uttar Pradesh, the highest populous
state of India, recorded 20.7 per cent in-migration in 1981-91 and 25per cent in-migration in1991-2001 from Madhya Pradesh followed by Bihar (18.2 per cent in 1981-91 and 21.2 per cent in 1991-2001). Whereas Maharashtra has received a large number of in-migrants from Gujarat (63 per cent in 1981-91 and 60 per cent in 1991-2001) followed by Karnataka (56per cent in 1981-91 and 62 per cent in 1991-2001). Punjab has received some in-migrants from Haryana followed by Uttar Pradesh and Rajasthan. Kerala has contributed a largest percentage change (4 per cent in 1981-91 to 9 per cent in 1991-2001) of in-migrants to Punjab during 1981-91. In case of Gujarat, the largest percentage of increase in in-migrants was from Orissa (5 per cent in 1981-1991 and 9 per cent in 1991-2001) followed by Bihar. Figure 1 shows an overview of inter-state migration flow between some major states of India during 1991-2001. Estimated values of in-migration, out-migration and net-out-migration for 14 major states of India during 1981-91 and 1991-2001 are given in table 6. From the table it is clear that basic structure of inter-state migration remained same during both the decades 1981-91 and 1991-2001.i.e. during the period 1991 and 2001 Gujarat, Haryana, Karnataka, Madhya Pradesh, Maharashtra, Orissa Punjab and West Bengal have gained population by movement of persons between the states. It is interesting to note that among the in-migrating states Maharashtra and Madhya Pradesh occupied 1st and 2nd place respectively during both the decades 1981-91 and 1991-2001. During 1981-1991 the state Karnataka and Haryana which were in 4th place and 5th place respectively among in-migrating states were in 6th and 4th place respectively in 1991-2001. The volume of in-migration to Maharashtra, Madhya Pradesh and Gujarat had been substantially higher as compared to other in-migrating states which can be explained in terms of their development due to industrialization.
Fig.1. Inter-state migration flows between some major states of India (1991-2001)
Table 1. Percentage distribution of life time internal migration stream in India 1971-2001.
Type of Migration 1971 1981 1991 2001
Male Female Total Male Female Total Male Female Total Male Female Total
Rural-Rural Rural-Urban Urban- Rural Urban-Urban 53.2 26.6 6.4 13.8 77.6 10.7 5.0 6.7 70.0 15.6 5.5 8.9 45.6 30 7.0 17.4 73.3 12.5 5.6 8.6 65.2 17.6 5.9 11.3 43.43 31.6 7.2 17.8 76.5 8.4 5.8 9.3 67.2 13.9 6.2 11.7 36.4 34.2 6.3 23.1 72.3 13.5 4.2 10.0 62.9 18.9 4.8 13.4
Total 100 100 100 100 100 100 100 100 100 100 100 100
Rural loss* 20.2 5.7 10.1 23 6.9 11.7 24.4 2.6 7.7 27.9 9.3 14.1
Sources: (i) Census of India, 1971, series-1, Part-II-D (I), Migration Tables (ii) Census of India, 1981, Series-I, Part-V-A & B(I),Migration Tables
(iii) Extracted from Migration Tables D1 and D2 of India provided by the Registrar General and commissioner, India,1991 (iv) Soft copy of India D-Series migration Tables provided by the Registrar General and commissioner, India, 2001 *“Rural loss” signifies the loss suffered by the rural population due to migration to urban areas
Table 2. Lifetime internal migration stream according to distance in India 1971-2001
Migration streams 1971 1981 1991 2001
I. Intra-district (Short distance) Rural-Rural Rural -Urban Urban - Rural Urban - Urban Sub-Total
Male Female Total Male Female Total Male Female Total Male Female Total 38.1 9.4 3.2 2.5 53.2 61.9 5.2 2.9 1.5 71.5 54.5 6.5 3.0 1.8 65.8 31.3 10.7 3.4 3.6 49 56.1 5.8 3.0 2.1 67 48.9 7.2 3.1 2.6 61.8 30.3 11.4 3.5 3.7 48.9 57.7 0.7 3.0 2.2 63.7 50 3.7 3.2 2.7 59.5 24.2 10.4 3.4 6.8 44.8 54.9 5.8 2.3 3.0 66.00 46.9 7.0 2.6 4.0 60.4 II.Inter-district (Medium Distance) Rural-Rural Rural -Urban Urban - Rural Urban - Urban Sub-Total 10.1 9.1 2.0 5.9 27.1 12.2 3.5 1.5 3.0 20.2 11.6 5.2 1.7 3.9 22.4 10.1 10.8 2.4 7.7 31 13.8 4.3 1.9 4.0 24 12.7 6.2 2 5.1 26 9.3 11.4 2.5 7.7 30.9 15.2 5.0 2.0 4.2 26.5 13.5 6.8 2.2 5.2 27.7 7.8 11.3 1.8 9.1 30.1 13.5 4.6 1.3 4.2 23.6 12.0 6.3 1.4 5.5 25.3 III.Inter-state (Long Distance) Rural-Rural Rural -Urban Urban - Rural Urban - Urban Sub-Total 5.0 8.1 1.2 5.4 19.7 3.5 2.0 0.6 2.2 8.3 3.9 3.9 0.8 3.2 11.8 4.2 8.5 1.2 6.1 20 3.4 2.4 0.7 2.5 9.0 3.6 4.2 0.8 3.6 12.2 3.8 8.8 1.2 6.4 20.2 3.6 2.7 0.7 2.8 9.8 3.7 4.4 0.9 3.8 12.8 4.3 12.5 1.2 7.2 25.1 3.9 3.2 0.5 2.8 10.4 4.0 5.6 0.7 3.9 14.3
Grand Total I,II &III 100 100 100 100 100 100 100 100 100 100 100 100
Source: Same as table 1
Table 3. Percentage distribution of migrants by reasons of migration, India 1981 -2001
1981 1991
Male reasons of migration females reasons of migration Male reasons of migration Females reasons of migration
Employ ment Educ ation moved household Marri
age other
Employ ment Educ ation moved household Marri
age other
Employ ment Educ ation moved household Marri
age other
Employ ment Educ ation moved household Marri
age other
I. Intra-district (Short distance)
Rural Rural 15.9 4.7 33.5 6.3 39.6 0.8 0.4 7.6 82.8 8.4 12.4 4.70 27.0 7.3 48.6 0.8 0.5 4.9 85.4 8.5
Rural Urban 35.4 11.5 27.6 1.8 23.7 3.5 2.8 24.6 57.0 12.1 31.8 9.00 26.2 3.0 30.0 3.6 2.4 20.1 61.9 12.0
Urban Rural 21.8 3.3 32.1 2.7 40.1 2.6 0.9 18.3 61.7 16.5 15.7 2.90 29.8 3.3 48.3 2.2 0.8 14.4 64.4 18.2
Urban Urban 31.0 4.7 35.8 1.4 27.1 3.8 1.9 32.8 45.5 16.0 25.4 3.90 29.4 3.0 38.3 3.8 1.6 22.9 52.9 18.8
TOTAL 21.7 6.0 32.4 4.7 35.2 1.3 0.7 10.5 78.2 9.3 18.1 5.5 27.2 5.7 43.5 1.2 0.7 7.4 81.1 9.6
II.Inter-district (Medium Distance)
Rural Rural 25.7 4.0 35.1 4.2 31.0 1.7 0.5 10.5 79.6 7.7 22.0 4.0 30.7 5.5 37.9 1.4 0.5 7.2 83.8 7.2
Rural Urban 50.4 8.2 22.5 1.0 17.9 4.7 2.6 31.3 49.2 12.2 44.1 6.7 22.0 2.0 25.1 4.6 2.1 25.3 55.9 12.1
Urban Rural 28.9 4.2 31.6 2.1 33.2 3.6 1.3 22.6 58.2 14.3 25.6 4.3 30.3 3.1 36.7 3.4 1.1 17.4 64.7 13.4
Urban Urban 40.2 6.0 31.9 0.9 21.0 4.5 2.4 35.2 44.1 13.8 36.9 5.3 29.0 1.9 26.9 4.5 1.9 26.8 53.4 13.3
TOTAL 37.9 5.9 29.9 2.1 24.2 2.9 1.2 19.4 66.4 10.1 34.1 5.3 27.1 3.1 30.4 2.7 1.0 14.5 72.2 9.6
III.Inter-state (Long Distance)
Rural Rural 37.8 2.1 31.3 2.8 26.0 3.7 0.5 15.5 71.5 8.8 32.8 2.3 27.6 3.5 33.9 2.7 0.5 11.5 77.5 7.8
Rural Urban 61.4 4.0 18.0 0.6 16.0 5.6 2.0 37.3 42.0 13.1 61.8 3.4 19.3 1.1 14.4 4.5 1.4 34.2 48.6 11.4
Urban Rural 33.3 2.9 28.7 1.4 33.7 4.8 1.6 27.9 50.4 15.3 30.7 3.5 27.3 2.0 36.4 4.2 1.2 22.5 59.3 12.8
Urban Urban 48.9 4.8 26.8 0.8 18.7 5.0 2.4 37.9 41.2 13.5 41.5 4.2 26.3 1.3 26.7 4.3 1.6 32.5 49.3 12.3
TOTAL 50.5 3.8 24.3 1.1 20.3 4.7 1.5 28.4 53.6 11.8 43.5 3.5 23.7 1.7 27.7 3.7 1.1 24.5 60.2 10.5
Last residence elsewhere in India
Rural Rural 19.7 4.3 33.7 5.6 36.7 1.1 0.4 8.5 81.7 8.3 16.0 4.3 27.8 6.7 45.2 1.0 0.5 5.6 84.7 8.2
Rural Urban 47.6 8.3 23.3 1.2 19.6 4.3 2.6 29.0 51.9 12.2 41.5 6.7 22.9 2.2 26.8 4.1 2.1 24.4 57.5 12.0
Urban Rural 26.3 3.5 31.3 2.3 36.6 3.2 1.1 20.9 59.1 15.7 21.7 3.5 29.5 3.0 42.3 2.2 1.0 16.4 63.9 15.9
Urban Urban 40.6 5.3 31.2 1.0 21.7 4.4 2.3 35.3 43.7 14.3 35.9 4.6 28.1 1.9 29.4 4. 1.8 27.5 52.1 14.4
[image:4.612.49.578.480.689.2]Table 3 (continued) 2001
Male reasons of migration Females reasons of migration
Employ ment
Educa tion
Marri age
moved with household
other Employ
ment
Educa Tion
Marri age
moved with household
other
I. Intra-district (Short distance)
16.7 3.2 7.1 21.8 51.3 0.7 0.2 85.1 4.5 9.4
Rural Rural
Rural Urban 37.7 5.5 1.8 25.4 29.5 2.8 1.6 59.1 23.1 13.4 Urban Rural 16.0 2.2 2.4 20.7 58.7 1.9 0.5 59.3 13.5 24.7 Urban Urban 20.9 1.5 1.0 26.6 49.9 2.4 0.8 41.9 24.4 30.5
TOTAL 22.2 3.4 4.6 23.3 46.6 1.1 0.4 80.0 7.3 11.3
II.Inter-district (Medium Distance)
Rural Rural 29.9 2.5 5.4 27.2 35.1 1.76 0.2 81.9 7.5 8.6 Rural Urban 50.4 4.4 1.0 20.3 23.9 4.32 1.2 51.4 28.8 14.3 Urban Rural 27.8 4.3 2.3 25.0 40.4 2.81 1.0 62.8 17.5 16.0 Urban Urban 36.1 3.7 0.9 27.8 31.5 3.19 1.3 48.5 29.1 17.0 TOTAL 39.4 3.7 2.2 24.7 30.1 2.6 0.6 68.9 16.0 11.8
III.Inter-state(Long Distance)
Rural Rural 48.2 1.1 2.8 24.1 23.8 3.87 0.1 74.2 13.1 8.1 Rural Urban 62.8 1.6 0.5 16.8 18.3 4.66 0.6 43.2 38.9 12.8 Urban Rural 37.4 3.4 1.5 24.5 33.2 3.77 1.0 54.2 27.2 13.8 Urban Urban 46.6 3.7 0.7 24.2 24.8 3.89 1.4 45.8 34.5 14.4 TOTAL 54.5 2.2 1.0 20.5 21.8 4.1 0.7 56.3 27.4 11.5
Last residence elsewhere in India
Rural Rural 23.3 2.8 6.18 23.2 44.5 1.1 0.2 86.1 5.5 6.9 Rural Urban 51.1 3.7 1.03 20.6 23.6 3.7 1.2 51.3 28.0 15.8 Urban Rural 23.3 3.0 2.25 22.7 48.8 2.4 0.7 59.0 16.3 21.6 Urban Urban 34.9 3.1 0.88 26.3 34.8 3.1 1.1 44.5 28.4 23.0
TOTA 35.5 3.2 2.9 23.0 35.4 1.8 0.5 75.7 11.6 10.4
Table 4. Inter-state transition probabilities of migration in India (1981-91)
States A.P. Bihar Gujarat Haryana Karnataka Kerala M.P. Mahara
shtra Orissa Punjab Rajasthan Tamil
Nadu U.P. W.B A.P.* - 0.0059 0.0254 0.0041 0.4034 0.0127 0.0527 0.2469 0.0871 0.0033 0.0089 0.1262 0.0097 0.0139 1.00
Bihar 0.006 - 0.0158 0.0306 0.0047 0.0021 0.198 0.0326 0.0738 0.0513 0.0185 0.0026 0.1823 0.3817 1.00
Gujarat 0.0168 0.0046 - 0.0067 0.021 0.0088 0.0794 0.6373 0.0064 0.0072 0.1704 0.0103 0.022 0.009 1.00
Haryana 0.0044 0.0043 0.0142 - 0.0034 0.0012 0.0695 0.018 0.0045 0.3912 0.3272 0.0014 0.152 0.0085 1.00
Karnataka 0.1771 0.0015 0.0145 0.0024 - 0.1089 0.0074 0.5694 0.002 0.0024 0.0094 0.0965 0.0058 0.0025 1.00
Kerala 0.0423 0.0078 0.0489 0.009 0.2500 - 0.0533 0.2099 0.0087 0.0043 0.022 0.317 0.0177 0.0091 1.00
M.P.* 0.0124 0.0205 0.0723 0.0189 0.0057 0.0053 - 0.3421 0.0832 0.0191 0.1949 0.0034 0.2078 0.0146 1.00
Maharashtra 0.1034 0.0033 0.3592 0.0071 0.168 0.0252 0.2087 - 0.0037 0.011 0.0382 0.0273 0.0368 0.0081 1.00
Orissa 0.1524 0.0958 0.0544 0.0073 0.0131 0.0058 0.3457 0.045 - 0.0122 0.0144 0.0052 0.0213 0.2275 1.00
Punjab 0.0083 0.014 0.0174 0.4282 0.0067 0.0041 0.05 0.0525 0.0062 - 0.2209 0.0042 0.1685 0.019 1.00
Rajasthan 0.0137 0.0071 0.238 0.2272 0.0194 0.0023 0.1875 0.0914 0.005 0.0968 - 0.0124 0.0787 0.0205 1.00
Tamil Nadu 0.1629 0.0041 0.0248 0.0033 0.3632 0.2699 0.0167 0.1222 0.0048 0.0032 0.0096 - 0.0081 0.0072 1.00
U.P.* 0.0058 0.0441 0.0696 0.1536 0.0063 0.0017 0.198 0.2491 0.0056 0.1165 0.0922 0.0025 - 0.0551 1.00
W.B* 0.0336 0.3125 0.0319 0.0219 0.0154 0.0071 0.0884 0.0808 0.149 0.0283 0.0868 0.0167 0.1275 - 1.00 *A.P. = Andhra Pradesh, M.P. = Madhya Pradesh, U.P. = Uttar Pradesh, W.B. = West Bengal
Table 5. Inter-state transition probabilities of migration in India (1991-2001)
States A.P. Bihar Gujarat Haryana Karnataka Kerala M.P. Mahara
shtra Orissa Punjab Rajasthan Tamil
Nadu U.P. W.B
A.P. - 0.0102 0.0316 0.0055 0.3818 0.0137 0.0521 0.2446 0.0759 0.0064 0.0132 0.1328 0.0167 0.0156 1.00
Bihar 0.0146 - 0.0270 0.0427 0.0082 0.0020 0.0979 0.0599 0.0601 0.0617 0.0267 0.0038 0.2122 0.3832 1.00
Gujarat 0.0212 0.0084 - 0.0066 0.0265 0.0087 0.0916 0.6050 0.0078 0.0092 0.1625 0.0145 0.0260 0.0121 1.00
Haryana 0.0075 0.0238 0.0194 - 0.0076 0.0020 0.0269 0.0298 0.0032 0.3479 0.3661 0.0032 0.1529 0.0097 1.00
Karnataka 0.1511 0.0027 0.0174 0.0029 - 0.0636 0.0107 0.6233 0.0028 0.0031 0.0086 0.1010 0.0090 0.0038 1.00
Kerala 0.0586 0.0097 0.0542 0.0119 0.2345 - 0.0535 0.1969 0.0087 0.0094 0.0224 0.3084 0.0230 0.0089 1.00
M.P. 0.0237 0.0326 0.0722 0.0136 0.0071 0.0064 - 0.2977 0.0597 0.0164 0.1988 0.0055 0.2501 0.0161 1.00
Maharashtra 0.0638 0.0040 0.3517 0.0081 0.1827 0.0246 0.2505 - 0.0046 0.0118 0.0294 0.0234 0.0359 0.0095 1.00
Orissa 0.1513 0.0827 0.0900 0.0074 0.0101 0.0041 0.2366 0.2161 - 0.0119 0.0120 0.0071 0.0258 0.1450 1.00
Punjab 0.0127 0.0188 0.0254 0.4466 0.0145 0.0042 0.0515 0.0613 0.0054 - 0.1884 0.0080 0.1387 0.0245 1.00
Rajasthan 0.0237 0.0101 0.2152 0.2078 0.0273 0.0034 0.1822 0.1280 0.0039 0.0748 - 0.0181 0.0867 0.0188 1.00
Tamil Nadu 0.1858 0.0046 0.0211 0.0038 0.3542 0.2429 0.0166 0.1267 0.0050 0.0058 0.0107 - 0.0129 0.0098 1.00
U.P. 0.0106 0.0531 0.0731 0.1402 0.0082 0.0019 0.2047 0.2734 0.0049 0.0945 0.0884 0.0041 - 0.0429 1.00
W.B 0.0385 0.3894 0.0419 0.0211 0.0175 0.0067 0.0816 0.0938 0.1072 0.0274 0.0329 0.0157 0.1264 - 1.00
Table 6. Interstate in- migration, out-migration and net- migration 1981-91 and 1991-2001
States 1981-91 1991-2001
*Inmigration Outmigration Netmigration *Inmigration Outmigration Netmigration
A.P. Bihar Gujarat Haryana Karnataka Kerala M.P. Maharashtra Orissa Punjab Rajasthan Tamil Nadu U.P. W.B.
364238 239491 664935 597535 656170 250260 1013030 1478813 236100 469061 583358 281085 546217 561795
462040 951822 278518 335653 525888 391953 544583 707347 249731 322706 664177 563294 1588457 355769
-97802 -712331 386417 261882 130282 -141693 468447 771466 -13631 146355 -80819 -282209 -1042240
206026
439613 396708 848813 761051 734742 229153 1226894 2169958 246035 553412 709716 332554 758481 730535
585793 1327073 403490 347018 691973 368288 687561 776861 311823 305548 864282 549604 2471781 446571
-146180 -930365 445323 414033 42769 -139135 539333 1393097
-65788 247864 -154566 -217050 -1713300
Pradesh), Bihar and Uttar Pradesh are found most out-migrating states during both the inter censual period. Some of the probable causes of out-migration would be due to industrially backwardness, natural calamities like droughts/floods, low agricultural development, etc.
Conclusions
This study attempted to understand the migration streams and its changing behavior in India in last four decades, 1971-2001. Based on census data, among all the four types of migration streams it has been found that the share of rural-rural migration has been a dominant migration stream with slightly declining trend from 1971 to 2001. On contrary, rural-urban migration has been increasing over the period. Nevertheless, intra-district migration has decreased while the proportions of district and state migrants have increased. In inter-state migration the percentage of rural-urban stream was found higher than other streams. ‘Employment’ among males and ‘marriage’ among female were found important factors for migration. Proportion of both male and female migrants for ‘education’ was found to be declining for all types of migration streams during 1981 and 2001 census. However, rural-urban migration of male for employment was maximum and it showed a gradual increasing trend. It was found that during 1981-1991 and 1991-2001 inter-state migration remained same. During both decades, the states Uttar Pradesh and Bihar continued to occupy 1st and 2nd place respectively among out-migrating states, while Maharashtra and Madhya Pradesh occupied 1st and 2nd respectively among in-migrating states.
Appendix
According to Isserman et.al., (1985), the migration flow between orgin (i) and destination (j) is given by
Where
= Migration probabilities between i and j during the period (t-1, t)
= Number of persons moved from state i to state j during the period
(t-1, t).
= Population in state i that survive to year t which is
= k=123………n
Where k refers to the complete set of region including i and j = Attractive index of state k in the base year (t-1)
= Attractive index of state k in the base year (b-1).
The magnitude of migration response to change relative attractiveness is represented by the parameter r. it is a close approximation to an elasticity measuring the percentage change in migration probabilities to j for each percentage change in j’s relative attractiveness. They used ‘A’ as “Economic Attractiveness “and used change in the employment index as a proxy to this.
Kadi(1986) modified the above model by replacing by i.e.,
total number of stayers among past migrants at the destination state j during the period of current flow , which determine the attractiveness because the
size of is determined by the socio-economic and geographic factor
prevailing at the destination state j during the period of current flow of migration.
Hence the model is:
i,k= 123……n i≠j & i≠k Where
= Migration probabilities between i and j during the period (t-1, t).
= Number of persons moved from state i to state j during the period
(t-1, t).
Total number of person moved out from state i to other state
during (t-1, t).
=Total number of migrants at destination j with duration of stay (10+)
years at the time t census counts.
= Total number of migrants at destination j with duration of stay (10+)
years at the time b census counts.
= Number of persons moved from state i to state j during the period
(b-1, t).
Model gives change in every migration probabilities with change in the attractiveness of any one region, all transition probabilities are
interdependent substituting all the information and assuming the
migration probabilities for the decades 1981-91 and 1991-2001 are estimated.
REFERENCES
Bhagat, R.B., 2008, Assessing the measurement of internal migration in India. Asian and Pacific migration Journal, 17(1): 91-102.
Chatterjee, Atreyi, and Ashish Bose. 1977. “Demographic Data on Internal Migration and Urbanisation from Census and NSS – An Appraisal,” in Ashish Bose, Davendra B. Gupta, and Gaurisankar Raychaudhuri (eds.), Population Statistics in India. New Delhi: Vikas Publishing House Pvt. Ltd.
Greenwood, M.J. 1971. A regression analysis of migration to urban areas of a less developed country: The case of India. Journal of Regional Science, 11: 253-262.
Isserman, A.M., Ragerson, D.A. and Beaumant, P.M. 1985. Forecasting interstate migration with limited data: A Demographic-economic approach. Journal of American Statistical Association, 80: 277-285.
Kadi, A.S. and Sivamurthy, M., 1988. Interstate Migration in India: 1971-81. Canadian Studies in Population, 15 (1): 37-50.
Kadi, A.S., 1986. A simple model for estimating interstate migration for using limited data. Paper Presented in All India Seminar on Migration Research in Context of Development, BHU, Varanasi, India.
Langley, Paul, C., 1974. The spatial allocation of migration in England and Wales: 1961-66. Scottish Journal of Political Economy, 21(3): 259-77.
Levey, M.B. and Wadycki, W.J., 1973. The influence of family and friends on geographical labour mobility. Review of Economics and Statistics, 55: 98-203.
Masser, I. and Gould, W.T.S. 1975. Inter-Regional Migration in Trophical Africa. Institute of British Geographer, London.
Mehta, B.C. and Kohli.1993. Spatial mobility of population: an Inter-District study of Rajasthan. Demography India, 22(2):247-266.
Nair, P.S. and Narain, V. 1985. Internal migration in India: Demographic knowledge and Policy Issues. IUSSP Seminar on Policy Formulation, Implementation and Evaluation: the case of East, South and South East Asia, contributed papers, Bombay, India, January 24-28. Premi, M.K. 1984, International migration in India 1961-1981.
Sahota, Gian, S. 1968. An Economic Analysis of Internal Migration in Brazil. Journal of Political Economy, 76(2): 218-245.
Singh, D.P. 2005. Spatial Migration in India: Evidence based on national sample survey data. Demography India, 34 (2): 247-266.
Singh, S.N. and Yadava, K.N.S. 1974. A study of pattern of rural-urban migration. Demography India, 3(2): 271-298. Singh, S.N. and Yadava, K.N.S. 1979. An extension of Singh
and Yadava single orgin multiple destination migration model. Journal of Scientific Research, 19(2): 19-26. Sivamurthy, M. and Kadi, A.S. 1984. Reformulation of Singh
and Yadava extended model of migration. Demography India, 13: 238-46.
Srivastava, Ravi and Sasikumar, S. K. 2003. An Overview of Migration in India, Its Impacts and Key Issues. Paper presented in Regional Conference on Migration, Development and Pro-Poor Policy Choices in Asia, held during June 22-24, Dhaka.
Traver, James, D. and Mcleod, R.D., 1973, A test and modification of Zipf’s hypothesis for predicting interstate migration. Demography, 10:259-275.
Zachariah, K.C. 1964. Historical study of internal migration in India sub continent, 1901-1931. Research monograph1, Demographic Training and Research Center, Bombay Publishing House, Bombay.