ISSN Online: 2152-2308 ISSN Print: 2152-2294
DOI: 10.4236/wet.2018.93006 Jul. 20, 2018 66 Wireless Engineering and Technology
Aperture Efficiency Study of Square Reflect
Array Antennas
Javad Nourinia, Changiz Ghobadi, Bahman Mohammadi, Farzad Alizadeh
Department of Electrical Engineering, Urmia University, Urmia, Iran
Abstract
This paper presents a detailed study of square reflect array (RA) antenna aperture efficiency (ηa). Effects of quantization-phase and limited phase-range
errors on radiation pattern, half-power beam width (HPBW) and ηa for
dif-ferent feed locations are investigated. Results show an increase in side-lobe levels (SLLs) and a slightly reduction in ηa with quantization-phase
augmenta-tion or element phase-range reducaugmenta-tion, however, the effects on HPBW are negligible. Nevertheless, the degradation in ηa is negligible when the
quantiza-tion-phase is lower than 30˚ or phase-range is more than 300˚. Parametric studies have been carried out to provide design guidelines to maximize ηa. It is
perceived that the offset-angle plays an important role to determine ηa,
espe-cially for feed with narrow beam width.
Keywords
Aperture Efficiency, Limited Phase-Range Error, Quantization-Phase Error, Reflect array Antennas, Square Aperture
1. Introduction
Reflect array (RA) antenna is comprised of a quasi-periodic set of unit elements mostly set in a regular lattice to emulate a specific phase-front transformation
[1] [2] [3]. RAs have many technological benefits compared to parabolic reflec-tors [4], like ameliorated cross-polarization performance due to the polarization sensitive elements, feed blockage reduction with center-fed offset-beam struc-ture, simply folded mechanism for packaging and transportation by division into small segments, keeping the price low with easy manufacturing process for shaped-beam RAs.
Considering the electrically large size of the RAs, composed of many elements with small size lower than a wavelength, a full-wave simulation requires a
consi-How to cite this paper: Nourinia, J., Gho-badi, C., Mohammadi, B. and Alizadeh, F. (2018) Aperture Efficiency Study of Square Reflect Array Antennas. Wireless Engineer-ing and Technology, 9, 66-78.
https://doi.org/10.4236/wet.2018.93006
Received: April 23, 2018 Accepted: July 17, 2018 Published: July 20, 2018
Copyright © 2018 by authors and Scientific Research Publishing Inc. This work is licensed under the Creative Commons Attribution International License (CC BY 4.0).
DOI: 10.4236/wet.2018.93006 67 Wireless Engineering and Technology
derably high computational time and huge resource. Similar to the look of the standard reflectors, ηa and radiation properties need to be predicted in initial RA
design procedure to judge the antenna performances. A design parameter rf (is
the focal length to aperture side length ratio) should be correctly selected. Larger
rf value results in smaller phase sensitivity to frequency variation and typically
enhances radiation performance in terms of cross-polarization level, gain band-width, and scan capability. On the other hand, it increases feed size and overall profile of RA antenna, therefore, it demands more mechanical effort to hold the antenna exactly in place [4]. A smaller rf increases variation of spatial phase
de-lays and causes large incident angles for edge elements.
The main objective of this paper is to study aperture efficiency of a square planar space-fed system. In practice, the phase of each RA element is chosen to resemble the nearest quantization phase. Besides, some phasing elements have a phase-range lower than 360˚. An investigation is presented to survey these errors on side-lobe levels (SLLs), half-power beam widths (HPBWs) and ηa of RAs. By
plotting ηa versus configuration parameters, an economical and comparatively
correct approximated design procedure ought to be introduced. Comparison between the center- and offset-fed square RAs for different feed locations is giv-en. Square apertures are suitable for development of small spacecrafts based on the Cube Sat standard (3U, equal to 30 cm), which has grown considerably in recent years for low-cost space missions [5] [6].
2. Aperture Efficiency Analysis
Figure 1 shows a typical configuration of a square RA system consist of an array of radiating elements and a feeding source. As demonstrated in Figure 1, four sets of coordinate systems are usually employed to analysis an RA. The subscript
f points out the feed coordinates where rf is the location of feed phase center. In Figure 2 the feed beam direction (FBD) is marked by Po(xo, yo,0) where the
maximum radiation of the feed horn is directed. The θo and θe are offset-angle of
feed source and incidence-angle of mnth element, respectively. The system
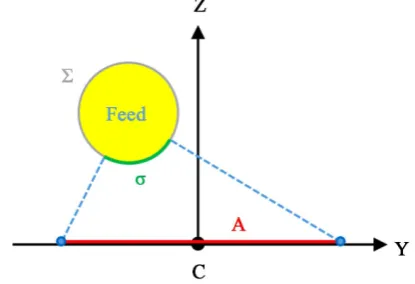
[image:2.595.209.533.599.733.2]con-figuration parameters are listed in Table 1. In Figure 3Σ points to the spherical surface centered at feed phase center. A shows the RA aperture that is specified by the aperture boundary, and surface σ shares a similar angle with A and Σ [7].
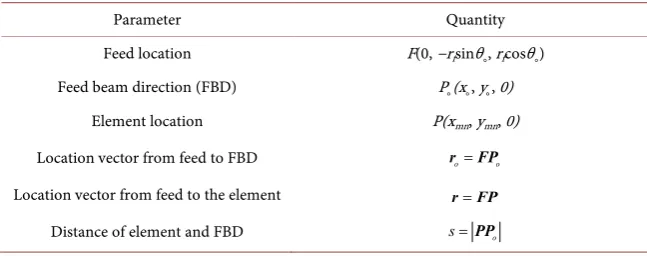
Table 1. The configuration parameters.
Parameter Quantity
Feed location F(0, −rfsinθ˳, rfcosθ˳)
Feed beam direction (FBD) P˳(x˳, y˳, 0)
Element location P(xmn, ymn, 0)
Location vector from feed to FBD r FPo= o
Location vector from feed to the element r FP=
DOI: 10.4236/wet.2018.93006 68 Wireless Engineering and Technology Figure 1. The coordinate systems of a typical reflect array antenna.
Figure 2. Configuration parameters of a typical reflect array antenna.
Figure 3. Spherical geometry of a typical reflect array antenna.
The ηa of the whole RA is presented by the product of several sub-efficiency
factors [8] [9]:
a spill ph t b x e et o
η =η ×η × × × × ×η η η η η ×η . (1)
where ηspill, ηph, ηt, ηb, ηx, ηe and ηet are the efficiencies for spill-over, phase, taper,
blockage, polarization, element and edge-taper, respectively. The ηo is the sum
efficiencies of manufacturing accuracy, environmental factors, assembling errors and measurement mechanism. The ηspill is part of radiated power emanated at
the feed on the RA aperture. The illumination efficiency (ηill) is the product of ηt
[image:3.595.266.474.407.549.2]DOI: 10.4236/wet.2018.93006 69 Wireless Engineering and Technology
and phase distribution over the RA aperture. At design frequency, the phase er-ror is almost zero once the element achieves complete phase range of 360˚. Therefore, some authors solely take into account ηt in ηill. Among these
sub-efficiencies, the product of ηspill and ηill has the major effect on ηa. Finally,
typical sub-efficiencies for RAs are tabulated in Table 2[7] [8] [9].
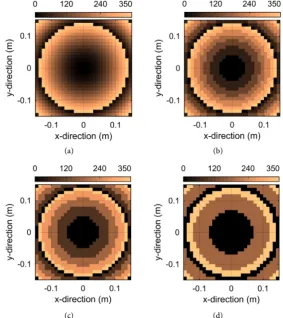
Element dimensions can be determined by the phase versus element change curve, when the necessary phase shift for each element is computed. However, element dimensions vary by a discrete value associated with the fabrication res-olution, therefore, a sustained phase control is impossible. The discrepancy be-tween desired element phase and quantized phase of the chosen element is clas-sified as quantization-phase error. In this section, a study is undertaken to inves-tigate the effects of quantization-phase errors on SLLs, HPBW and ηa. A
broad-side center-fed 30 cm square RA with sub-wavelength unit elements (lambda/3 at 10 GHz), rf = 1, qf = 8.2, and qe = 0.85 is used in this study. The feed and
ele-ment patterns are respectively modeled by the
cos
2q( )
f
θ
f and cos2eq( )
θe due to its simplicity. Figure 4 shows the phase distribution of the RA aperture at the ideal and various quantization phase, 45˚, 90˚ and 180˚ equal to 3-, 2- and 1-bit(s), respectively. Figure 5 shows the radiation pattern which calculated by array-theory method [10].
(a) (b)
[image:4.595.230.514.372.691.2]
(c) (d)
DOI: 10.4236/wet.2018.93006 70 Wireless Engineering and Technology
(a)
[image:5.595.252.495.69.427.2](b)
Figure 5. Radiation patterns for different values of: (a) quantization-phase; (b) phase-range.
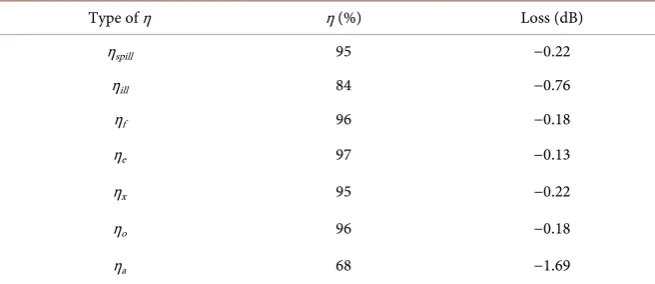
Table 2. Typical sub-efficiencies for reflect array antennas.
Type of η η (%) Loss (dB)
ηspill 95 −0.22
ηill 84 −0.76
ηf 96 −0.18
ηe 97 −0.13
ηx 95 −0.22
ηo 96 −0.18
ηa 68 −1.69
Sub-wavelength single resonance phasing elements have a phase-range below 360˚. So, some elements have unachievable phase shift. The radiation patterns for various element phase-ranges of 30 cm side-length square RA with θo= 0˚, θb
= 0˚, rf = 1, qf = 8.2, and qe = 0.85 are represented in Figure 5(b). As can be
[image:5.595.210.538.493.635.2]DOI: 10.4236/wet.2018.93006 71 Wireless Engineering and Technology
pseudo-random distribution of phase errors [11]. These effects are compared in
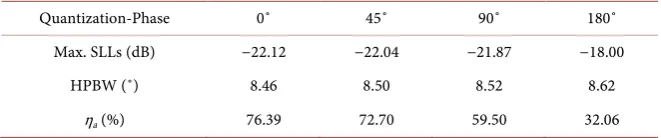
Table 3 and Table 4. It is noticed that these errors increase SLLs, but have no major effects on the HPBW. Even the 45˚ quantization-phase or 180˚ phase-range cases has similar HPBW as RA with ideal phases. It can be a very helpful to cut back to the system complexity and cost, when the HPBW is a ma-jor demand.
A parametric study has been performed for center- and offset-fed square aperture RA, with side length 30 cm, λ/3 element spacing at 10 GHz, qe = 0.85, x˳
= 0 and yo = 0, with different rf, for each case qf is considered to be maximum ηa.
In this study, the offset-feed and main beam angles are equal. The ηa is derived
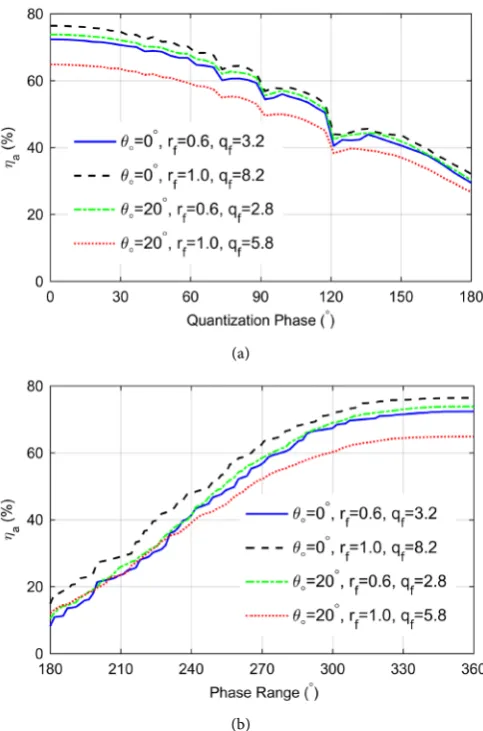
from gain value [12], which includes ηspill, ηph and ηt. In Figure 6, the acceptable
quantization-phase without ηa reduction is around 30 and the threshold for
phase-range is around 300˚. It shows reduction of ηa depends on
quantiza-tion-phase or phase-range values, however, it is independent of offset-angle and feed location. The ηa reduction occurs when the SLLs is increased which in turn
causes gain loss.
(a)
[image:6.595.252.494.323.689.2](b)
DOI: 10.4236/wet.2018.93006 72 Wireless Engineering and Technology Table 3. Effects of quantization-phase errors on reflect array antenna.
Quantization-Phase 0˚ 45˚ 90˚ 180˚
Max. SLLs (dB) −22.12 −22.04 −21.87 −18.00
HPBW (˚) 8.46 8.50 8.52 8.62
[image:7.595.208.540.190.258.2]ηa (%) 76.39 72.70 59.50 32.06
Table 4. Effects of limited phase-range errors on reflect array antenna.
Phase-Range 360˚ 300˚ 240˚ 180˚
Max. SLLs (dB) −22.12 −22.65 −23.64 −12.13
HPBW (˚) 8.46 8.58 9.00 10.82
ηa (%) 76.39 71.47 47.97 14.85
3. Aperture Efficiency Study
Parameters of square aperture RA with a side length of 10λ0 (λ0 is lambda at 10
GHz) are studied. Two designs with a θo = 0˚, qf = 8.2; and θo = 20˚, qf = 2.8 are
considered, other parameters are: xo = 0, yo = 0, and qe = 0.85. ηspill, ηill and ηa =
ηspill × ηill are plotted in Figure 7 and as shown the maximum accessible ηa value
for center-fed (76.44%) is greater than offset-fed (62.58%). Also, in Figure 7 as rf
grows the ηspill decreases due to a bigger rf reduced aperture angle of the RA
plane with respect to the feed source. In addition, ηill increases since it forms a
more uniform field distribution on the array.
For a precise design, the effects of excitation angle (θinc, φinc) for each element
ought to be considered. Figure 8 displays the range and distribution of plane wave excitation angles in the RA aperture. It can be observed that the upper part of the RA aperture has a maximum θinc. So, the element spacing should have
se-lected small enough that no distributed grating lobe radiated [1]. Comparison of
Figure 8(a) and Figure 8(b) indicates that the percentage of aperture area illu-minated with incident angle larger than 30˚ in the central case is less than 5.6% whereas in offset-feed RA is about 66.7%. Therefore, the impact of incidence an-gle is anticipated to be more significant in offset fed RAs. So, the use of sub-wavelength element appears to be necessary [13]. In the RA design process, an excitation plane wave can always be decomposed into a combination of the zero TE- and TM-waves [1]. In [14], it is indicated that magnitude of reflection components depends on both the θinc and φinc, and it ought to be considered for
every element.
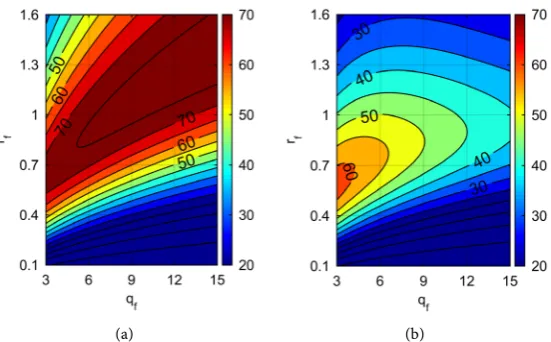
The feed position is determined by offset angle (θo) and the distance rf. Figure
9(a) and Figure 9(b) show the ηa versus rf and qf with other parameters set as: xo
= 0, yo = 0, and qe = 0.85. In Figure 9(a), in center-fed case for every rf it is
possible to find a qf that maximize ηa. However, in offset-fed RA, the maximum
of ηa is obtained just for lower rf and qf values, as presented in Figure 9(b). In
Figure 9(a), an ηa around 70% is realized for various mixtures of rf and qf,
DOI: 10.4236/wet.2018.93006 73 Wireless Engineering and Technology
(a)
[image:8.595.269.479.65.379.2](b)
Figure 7.ηill, ηspill, and ηa for square aperture. (a) θo = 0˚, qf = 8.2; (b) θo= 20˚, qf= 2.8.
(a) (b)
(c) (d)
Figure 8. Excitation angles distribution on the RA aperture θincfor (a) θo= 0˚, rf = 1; (b)
[image:8.595.264.483.412.674.2]DOI: 10.4236/wet.2018.93006 74 Wireless Engineering and Technology
[image:9.595.237.513.69.240.2]
(a) (b)
Figure 9. The ηa for square aperture versus both qf and rf.(a) θo = 0˚; (b) θo= 20˚.
placed in y-z plane, the plane of incidence, it is proper to use the coordinate (yf,
zf) for parametric study. The results are displayed in Figure 10(a) and Figure
10(b) for qf = 2.8 and qf = 8.2, respectively, other fixed parameters are: xo = 0, yo
= 0, and qe = 0.85. It is noted that once qf = 2.8, ηa is varied from 60% to 70%,
and when qf = 8.2, the maximum ηa is achieved at higher feed position. Larger qf
value yields a narrower feeding beam width. So, a larger rf ought to have an
ad-ditional uniform field distribution on the aperture. Using this contour map, one might find a correct feed location. The maximum ηa is acquired close to zf = 290
mm, as determined in Figure 10(b). The ηa keeps nearly constant until yf is
shifted to -50mm with zf fixed in 297 mm.
The contoured ηa plot versus xo and yo are depicted in Figure 11, with the
fixed parameters: rf = 1.0, θo = 0˚, qf = 8.2, and qe = 0.85 for center-fed; rf = 0.6,
θo = 20˚, qf = 2.8, and qe = 0.85 for offset-fed RA. It is noted that for offset case
maximum efficiency is obtained once the feeding beam is pointed at 13 mm away from aperture center, when ηa reaches 63%. Besides, the symmetry of the ηa
with respect to x-axis is observed. In most RAs xo = 0, and yo = 0, therefore
cen-ter elements have a stronger illumination and contribute more to total radiation. Accordingly, the useful information of an RA performance can be deduced without simulating whole structure. For example, a decent approximation of the RA gain bandwidth can be estimated by calculating the scattering from the mid-dle row of a large RA enclosed by perfectly magnetic conductor (PMC) bounda-ries [15]. For gain bandwidth enhancement, one might place elements with smaller reflection loss at the central area of the aperture. This can be done by adding a phase constant to the phase distribution over the RA aperture. Consi-dering both qf and qe results a contour plot of ηa in Figure 12 with constant
pa-rameters: rf = 1.0, θo = 0˚, xo = 0, and yo = 0 for center-fed; rf = 0.6, θo = 20˚, xo =
0, and yo = 0 for offset-fed. Note that the parameters qe solely effects ηill. Figure
12(a) and Figure 12(b) show the fact that the qe plays a smaller role in the ηa
than qf.
DOI: 10.4236/wet.2018.93006 75 Wireless Engineering and Technology
[image:10.595.240.507.67.225.2] [image:10.595.243.504.262.416.2]
(a) (b)
Figure 10. The ηa versus feed location in y-z plane. (a) qf = 2.8; (b) qf = 8.2.
[image:10.595.232.518.452.612.2]
(a) (b)
Figure 11. The ηa versus feed orientation Po(xo, yo, 0). (a) Center-fed; (b) Offset-fed.
(a) (b)
Figure 12. The aperture efficiency versus both qf and qe. (a) Center-fed; (b) Offset-fed.
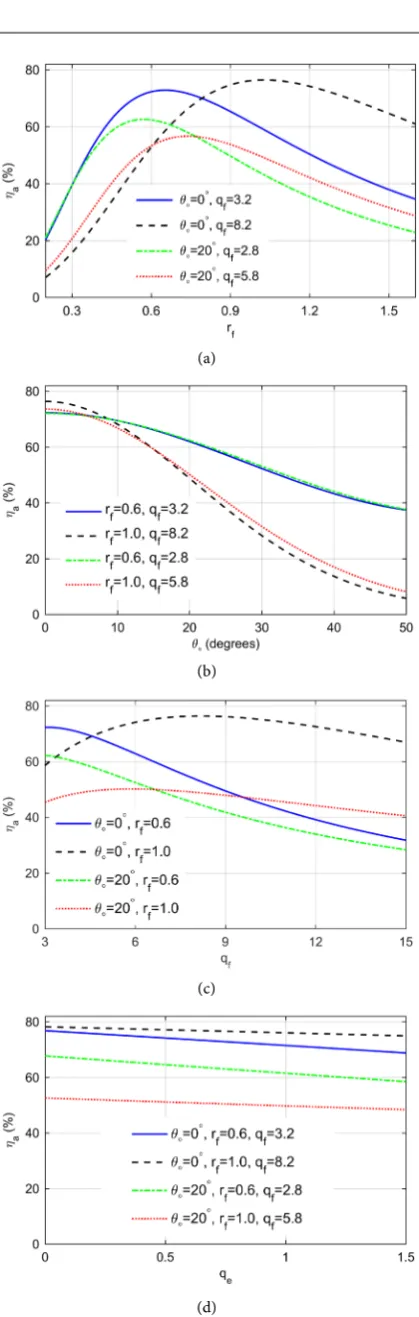
demonstrates the maximum ηa at rf = 1.02 once the feed has θo = 0˚ and qf = 8.2.
Comparison of center- and offset-cases shows the importance of right selection of RA parameters. Selecting an incorrect qf and rf for a given RA leads to a
con-siderably low ηa. Another curve, shown in Figure 13(b), provides ηa as a
DOI: 10.4236/wet.2018.93006 76 Wireless Engineering and Technology
(a)
(b)
(c)
[image:11.595.269.479.41.701.2](d)
DOI: 10.4236/wet.2018.93006 77 Wireless Engineering and Technology
maintains a certain offset angle depending on rf and qf values. For RAs with
higher rf and qf this offset-angle is around 10˚ and experience shows a maximum
of 15˚ offset-angle is allowed for acceptable ηa. The curve of feed pattern
func-tion is described in Figure 13(c). The optimum qf for center-fed case with rf =
0.6 is 3.2 and 6.3 for the 20˚ offset-fed RA with rf = 1.0. The variation of qf to
obtain a maximum ηa between center- and offset-fed for rf = 0.6 is smaller
amount than rf = 1.0. Likewise, the curve of the ηa versus qe is depicted in Figure
13(d). RAs with smaller rf and offset-fed location, the ηa is further attenuated by
the element pattern.
4. Conclusion
The quantization-phase and limited phase-range errors reduce RA antenna effi-ciency and increase SLLs, however, the HPBW remains mostly constant. The maximum acceptable quantized phase with negligible ηa diminution is around
30˚ and this threshold for limited phase-range is near 300˚. The limitations are independent of offset angle and feed location. Based on conducted parametric studies for a square aperture RA with side length 30 cm, it was observed that the appropriate selection of rf and qf has a significant effect on ηa and a center-fed
RA has the maximum ηa. However, the ηa preserves its behavior up to 15˚ for
offset-fed with smaller rf and qf.
References
[1] Huang, J. and Encinar, J.A. (2008) Reflect Array Antennas, John Wiley & Sons, Hoboken.
[2] Shaker, J., Chaharmir, M.R. and Ethier, J. (2013) Reflect Array Antennas, Analysis, Design, Fabrication, and Measurement. Artech House, Norwood, Massachusetts. [3] Nayeri, P., Yang, F. and Elsherbeni, A.Z. (2018) Reflect Array Antennas: Theory,
Designs, and Applications. John Wiley & Sons, Hoboken. https://doi.org/10.1002/9781118846728
[4] Xu, S. and Yang, F. (2015) Handbook of Antenna Technologies: Reflect Array An-tennas. Springer, Berlin.
[5] Poghosyan, A. and Golkar, A. (2017) CubeSat Evolution: Analyzing CubeSat Capa-bilities for Conducting Science Missions. Progress in Aerospace Sciences, 88, 59-83. https://doi.org/10.1016/j.paerosci.2016.11.002
[6] Hodges, R.E., Chahat, N., Hoppe, D.J. and Vacchione, J.D. (2017) A Deployable High-Gain Antenna Bound for Mars: Developing a New Folded-Panel Reflect Array for the First CubeSat Mission to Mars. IEEE Antennas and Propagation Magazine, 59, 39-49. https://doi.org/10.1109/MAP.2017.2655561
[7] Yu, A., Yang, F., Elsherbeni, A.Z., Huang, J. and Samii, Y.R. (2012) Aperture Effi-ciency of Reflect Array Antennas. Microwave and Optical Technology Letters, 52, 367-368. https://doi.org/10.1002/mop.24949
[8] Huang, J. (1995) Analysis of Microstrip Reflect Array Antenna for Microspacecraft Applications.TDA Progress Report,42-120, 158-160.
DOI: 10.4236/wet.2018.93006 78 Wireless Engineering and Technology 287-296. https://doi.org/10.1109/8.560348
[10] Nayeri, P., Elsherbeni, A.Z. and Yang, F. (2013) Radiation Analysis Approaches for Reflect Array Antennas. IEEE Antennas and Propagation Magazine, 55, 127-134. https://doi.org/10.1109/MAP.2013.6474499
[11] Yang, H., Yang, F., Xu, S., Li, M., Cao, X., Gao, J. and Zheng, Y. (2017) A Study of Phase Quantization Effects for Reconfigurable Reflect Array Antennas. IEEE An-tennas and Wireless Propagation Letters, 16, 302-305.
https://doi.org/10.1109/LAWP.2016.2574118
[12] Devireddy, B., Yu, A., Yang, F. and Elsherbeni, A.Z. (2011) Gain and Bandwidth Limitations of Reflect Arrays. Applied Computational Electromagnetics Society Journal, 26, 170-178.
[13] E'qab, R.F. and McNamara, D.A. (2016) Angle of Incidence Effects in Reflect Array Antenna Design: Making Gain Increases Possible by Including Incidence Angle Ef-fects. IEEE Antennas and Propagation Magazine, 58, 52-64.
https://doi.org/10.1109/MAP.2016.2594699
[14] Fujii, Y., Yoshimoto, S., Makino, S., Hirota, T., Noguchi, K. and Itoh, K. (2015) The Design Method of Low-Cross-Polarization Reflect Array Antenna. IEEE 2015 In-ternational Symposium in Antennas and Propagation (ISAP), Hobart, TAS, 9-12 November 2015, 765-767.
[15] Chaharmir, M.R., Shaker, J., Gagnon, N. and Lee, D. (2010) Design of Broadband, Single Layer Dual-Band Large Reflect Array Using Multi Open Loop Elements.