ISSN Print: 1945-3094
DOI: 10.4236/jwarp.2018.107040 Jul. 17, 2018 699 Journal of Water Resource and Protection
Key Technologies for an Urban Overland Flow
Simulation System to Support What-If Analysis
Guoqiang Peng
1,2,3*, Fuqiang Lu
4, Zhiyao Song
1,2,3, Zhuo Zhang
1,2,31Key Laboratory of Virtual Geographic Environment (Ministry of Education), Nanjing Normal University, Nanjing, China
2State Key Laboratory Cultivation Base of Geographical Environment Evolution (Jiangsu Province), Nanjing, China
3Jiangsu Center for Collaborative Innovation in Geographical Information Resource Development and Application, Nanjing,
China
4Collaborative Innovation Center for Digital Information Technology, Changzhou Institute of Technology, Changzhou, China
Abstract
Urban flooding poses serious threats to human life. In China, many cities have recently experienced flooding during every rainy season. Several years ago, policies, scientific methods, and engineering measures were applied to address this systematic problem. However, flooding disasters remain fre-quent in urban areas in China. Therefore, this article discusses the hu-man-earth relationship from a philosophical perspective to analyse the causes of urban water problems. This article mainly illustrates the value of the what-if analysis concept and how to use this concept to address urban flood-ing issues and improve the management of urban overland flow. However, the existing simulation models and software do not effectively support what-if analyses. In particular, most existing urban hydrological simulation models and software do not sufficiently consider the heterogeneity of geo-graphical objects on urban surfaces and lack interactions to support what-if analyses. These limitations hinder effective implementation of what-if analy-sis. This article introduces three key technologies that allow an urban over-land flow simulation system to effectively support what-if analyses: 1) urban spatial automatic discretization and topo-adjacency, which reflect the het-erogeneity of an urban area; 2) hydrological models for the simulation of the hydrologicalprocesses of the main geographical objects in the urban area; and 3) key strategies for a visual analytic platform to support what-if analyses in well-perceived way. The experiment was conducted using a community in Chongqing as a case study. The results demonstrate that the designed key technologies and functions of the proposed system can support what-if analysis and that what-if analysis is an important and useful concept for ur-ban water management.
How to cite this paper: Peng, G.Q., Lu, F.Q., Song, Z.Y. and Zhang, Z. (2018) Key Technologies for an Urban Overland Flow Simulation System to Support What-If Analysis. Journal of Water Resource and Protection, 10, 699-724.
https://doi.org/10.4236/jwarp.2018.107040
Received: May 5, 2018 Accepted: July 14, 2018 Published: July 17, 2018
Copyright © 2018 by authors and Scientific Research Publishing Inc. This work is licensed under the Creative Commons Attribution International License (CC BY 4.0).
DOI: 10.4236/jwarp.2018.107040 700 Journal of Water Resource and Protection
Keywords
Urban Flooding, Surface Heterogeneity, Spatial Discretization, Geo-Visual Analysis
1. Introduction
Most humans live in urban areas, and urban areas have been the most thor-oughly changed places from their natural environments [1] [2]. In China, hu-mans have changed natural environments extensively during the development of cities over the last 40 years, and this activity has included filling natural lakes, changing the channels of natural rivers, and increasing the extent of impervious surfaces. People tend to focus on the development of cities without considering or predicting the influence of human-induced urban construction. Therefore, the human-earth relationship has become increasingly imbalanced [3] [4] [5], resulting in many problems. Urban flooding is one of the most serious of these problems in cities, posing severe threats to human life [6] [7]. Sixty-two per cent of 351 Chinese cities surveyed experienced flooding between 2008 and 2010, and in recent years, urban flooding has become worse in China [8].
A key point to solving urban hydrological problems is toreconcile the imbal-ance in the human-earth relationship to improve the sustainability of urban de-velopment [9] [10]. Therefore, understanding, communication, and adjustment are the essential approaches necessary to reconcile the dissonance between hu-man beings and the natural environment. Specifically, for water hu-management and flood disaster prevention, understanding and following the natural behav-iour of water are essential processes for solving water problems. Many phical concepts of naturalism have illustrated this view, such as Taoist philoso-phy, which considers how to maintain human behaviour according to the alter-nating cycles of natural environment, according to the Taoism saying, “nature has its own ways” [11] [12] [13] [14]. The Dujiangyan irrigation system, for ex-ample, which is based on reasonable analysis and complies with the natural laws of the water system, represents a successful solution to a water problem. The building of the Dujiangyan irrigation system began in 256 B.C. This system still controls the water of the Minjiang River and distributes it to the fertile farmland of the Chengdu Plain [15] [16] [17] [18].
DOI: 10.4236/jwarp.2018.107040 701 Journal of Water Resource and Protection
should be based on asymptotic and repeated experiments [24] [25]. Therefore, it is essential to construct a simulation system to help understand the natural laws of urban overland flow, to help adjust and understand the influences and utility of what “humans try to do” [26] [27] [28]. What-if analysis is a simulation method with the goal of inspecting the behaviours of a complex system under some given hypotheses called scenarios [29]. What-if analysis is used to support evaluations before the actual impact of a strategic or tactical action, and decision makers need reliable provisional systems. The basic idea of what-if analysis is well suited for simulating and planning for given hypotheses in a complex
sys-tem [30] [31]. For example, for the construction of urban infrastructure, we
usu-ally change the type of surface from a grass surface to a concrete surface. Under-standing what will happen before humans change the specific surface type is helpful for urban water management. Therefore, the what-if concept is highly appropriate for improving the management of urban overland flow.
Many modelshave been developed to aid in urban water management, such as the Strom Water Management Model(SWMM) [32], Hydrological Simulation Program-Fortran(HSPF) [33], the Illinois Urban Drainage Area Simulator (ILLUDAS) [34], and other simulation models from many researchers [35] [36] [37]. However, these models do not support pre-processing of data well, and most of these models lack the ability to adopt simulation data andrequire con-siderable manual work to implement data pre-processing. For example, in the SWMM, the input file is saved as structureddocuments and requires substantial manual work to pre-process the input data for urban water simulation and, this model does not make use of the advantage of spatial data collected by surveying. In addition, the outputs of the simulation results, including dynamic representa-tions (such as the dynamic changesin water depth and velocity at different spati-otemporal points) are savedin the conventional way in the form of structured documents; however, this method is not convenient for helping people under-stand the dynamic processes and results. Furthermore, in complex urban areas, many geographical objects exist, and the interactions among these objects are very complex. For such geographical objects, it is difficult to manually imple-ment urban surface discretization and topo-adjacency (topological adjacency, a logic data structure used to depict and save the adjacency information between two adjacent geographic objects; for example, to calculate the flux exchange be-tween a building and a surface, the overlapping edge, node and cell should be recorded for the flux exchange calculation [38]).
DOI: 10.4236/jwarp.2018.107040 702 Journal of Water Resource and Protection
user interfaces (GUIs) to help process the input data and visualize the output data. The software programshave powerful capabilities to delineate water proc-esses and flooding areas based on hydrological models. Most of these software programsalso provide functions to support input data pre-processing and the representation of simulation results [39] [40], such as the support for accessing the standard geographic information system (GIS) vector data and raster data to store and delineate spatial objects, such as ESRI Shapefile, digital elevation model (DEM), and AutoCAD DXF files. However, these programs do not suffi-ciently consider the heterogeneity in urban areas. Different types of geographical objects are not simulated explicitly and independently. Therefore, people cannot understand the influence of human-induced specific urban construction activi-ties, such as constructing a building or changing an irregularly shaped area from grass cover to concrete cover. The inability of a simulation system to represent these specific construction activities hinders the potential of human-earth inter-active experiments to support what-if analysis. The what-if analysis should sup-port the influence analyses by imitating human-induced urban construction
[41]. The absence of powerful human-earth interactive experiments would im-pedethe discovery of the causes of runoff increases and the contributions of dif-ferent factors to flooding. Also, previously developed models do not support topo-adjacency automatically, which hinders the calculation of the flux exchange between different geographical objects.
To provide greater support for the analysis and understanding of urban over-land flow, the proposed simulation system includes three main components. 1) An automatic urban surface spatial discretization method supports the genera-tion of mesh grids and implementagenera-tion of spatial adjacency; this component is the basis for supporting overland flow simulations. In this proposed system, the discretization method considers the main urban geographical objects separately, which provides the basic boundary conditions and input parameters to the simulation models. Furthermore, this method is a key step in supporting the in-teractions between humans and the urban environment. 2) Hydrological models and flux exchange methods are used to simulate water processes in the complex and heterogeneous urban environment. Different geographical objects affect the dynamics and motion of water flow differently. The proposed system uses cor-responding models to simulate water motion processes around different geo-graphical objects. 3) An urban overland flow geo-visual analytic platform is used to support processing of the input data and dynamic visualization of the output data in a well-perceived way. This platform provides human-earth interaction methods and geo-visual analysis methods to help implement the what-if analy-sis.
Sec-DOI: 10.4236/jwarp.2018.107040 703 Journal of Water Resource and Protection
tion 5 introduces the key strategies of the geo-visual analytic platform used for the what-if analysis. Section 6 describes an experiment that shows the capacity of the proposed system and thefunctions to support what-if analysis for overland flow simulation.
2. Basic Idea and Overall Framework
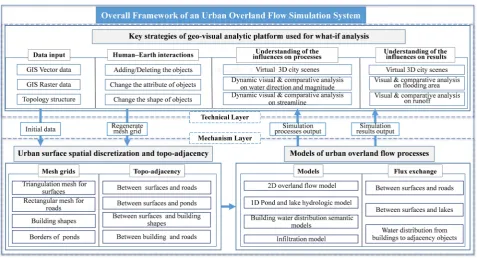
The basic idea of the proposed system is to integrate mathematical models and GIS technologies. Using GIS data and topological relations [42] to automatically implement spatial discretization and topo-adjacency, the system supports the hydrological model simulation and flux exchange between different objects. The mathematical models are used to simulate the motion mechanism of overland flow in complex and heterogeneous environments, such as overland flow on dif-ferent types of surfaces, including roads, buildings, and ponds. Based on GIS visual analysis technologies, we provide a geo-visual analytic platform to better understand overland flow via multi-interaction methods and representation methods, such as those based on human-earth interactions and dynamic visuali-zation of various factors (e.g., water flow and water depth) to help understand the influences of different scenarios caused by human-earth interactions in a virtual environment. The overall framework of the proposed system is shown in
Figure 1.
The framework of the proposed system includes three main parts.
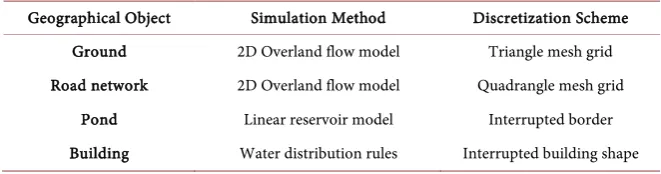
1) Urban surface spatial discretization and topo-adjacency. These factors are the basis of the model simulation. In this simulation system, to support the simulation of the 2D overland flow model, a triangulation mesh grid was used to discretize the urban surface [43]. A rectangular mesh grid was used to support the simulation of water movement processes on roads. The borders of ponds are used to support the dynamic calculation of flux exchange between ponds and surfaces. The shapes of buildings are used to store the water distribution rules associated with buildings. These four types of objects are the main influencing factors in the urban area and affect water flow differently. However, the overland flow process is continuous. Therefore, the topological adjacencies are essential for overland flow simulation and are used to calculate the flux exchange between adjacent objects. The types of topological adjacency include topo-adjacency be-tween land surfaces and roads, topo-adjacency bebe-tween land surfaces and ponds, topo-adjacency between buildings and roads, and topo-adjacency between buildings and land surfaces. Based on these four topological adjacencies, we im-plement a continuous process simulation of urban overland flow.
DOI: 10.4236/jwarp.2018.107040 704 Journal of Water Resource and Protection
Figure 1. The overall framework of the proposed system.
These flux exchange relationships include the flux exchange between land sur-faces and roads and between land sursur-faces and ponds as well as the water distri-bution around buildings.
3) An urban overland flow geo-visual analytic platform. This part of the framework is based on GIS technologies to help simulate the data input, imple-ment the human-earth interactions, and understand the simulation processes and results. These steps are used to support the what-if analysis from a technical level. This platform includes four main modules, a data input module, a hu-man-earth interaction module, a module for understanding the influences on processes, and a module for understanding the influences on results. The data input module provides an interface to support access to various GIS data for spatial discretization and model parameter abstraction. The human-earth inter-actions module allows the user to interactively change the geographical objects in the virtual environment, which allows the implementation of simulations of different scenarios. The module for understanding the influences on the proc-esses provides a clear way to help people understand water motion procproc-esses on urban land, which mainly include dynamic visual and comparative analysis of water direction and water flow magnitude. The module for understanding the influences on the results provides different visual-analysis technologies to help understand the different influences of different simulation scenarios, which mainly include flooding areas and runoff analysis.
3. Urban Surface Spatial Discretization and Topo-Adjacency
anthropo-DOI: 10.4236/jwarp.2018.107040 705 Journal of Water Resource and Protection
genichydrologic objects into a specific scheme to support the running of the model [44]. The delineation capabilities of spatial information, topological rela-tionships, and the attributes of geographical objects are the key factors that im-pact the simulation of overland flow processes. The surface spatial discretization module is used to automatically provide spatial information and attributes to simulation models. In the analysis of cases of flooding and runoff in extremely complex and heterogeneous urban environments, the heterogeneity between different objects and the heterogeneity of surface types should be considered separately. Therefore, the two main aspects in urban surface spatial discretiza-tion are 1) discretizadiscretiza-tion of the continuous surface into corresponding schemes to support the running of hydrodynamic models and 2) construction of the topo-adjacency between the different geographic objects to support the calcula-tion of the flux exchange between different geographical objects.
3.1. Related Work
With the capabilities of geographical object delineation, GIS spatial data have been widely used to support spatial discretization for hydrological simulation. Researchers have implemented spatial discretization based on GIS data in large-area watersheds, in which they have considered the heterogeneity in slopes, vegetation, rainfall, soil, etc., which are key factors that affect simulation in the watershed [45] [46]. Based on spatial and attribute data in GIS, such parameters (e.g., vegetation types, different soil types, and the heterogeneity in rainfall) can be automatically extracted for model simulation. The factors associated with hy-drologic process simulations are more complex and heterogeneous than the fac-tors in the natural watershed; therefore, the spatial discretization becomes more complex. Many pre-processing tools and conceptual data models have been proposed to support discretization at different research scales (e.g., watersheds, urban areas, and sub-catchments in urban areas). These pre-processing tools have different design ideas, which can be workflow and object oriented, and most of these tools are based on a procedural method to enhance the capability of discretizing urban spatial data [47] [48]. However, previous studies have not considered the main objects in urban areas independently, which seriously hin-ders the hydrologic simulation of complex and heterogeneous urban areas be-cause buildings, road networks, surfaces, and ponds have different impacts on overland flow processes.
pro-DOI: 10.4236/jwarp.2018.107040 706 Journal of Water Resource and Protection
grams support access to many different spatial data formats that can be used to delineate spatial information. In many applications, this method is the main way to implement spatial discretization in hydrologic process simulation. However, most discretization software also does not consider different geographical ob-jects independently. For example, the SMS treats all the geographic obob-jects as geometries, and the generation of mesh grids is based on geometricborders; thus, the model cannot recognize the objects and their topological relationships. This shortcoming requires users to take more time and have more knowledge to im-plement discretization and topo-adjacency because they must understand the structure of the input data and the discretization scheme of the hydrological model. For heterogeneous urban areas, different geographical objects have dif-ferent discretization methods. Furthermore, these tools lack automatic determi-nation of topo-adjacency for calculating the flux exchange between different ob-jects, which hinders the continuous simulation of overland flow processes in a heterogeneous environment.
3.2. Spatial Discretization
DOI: 10.4236/jwarp.2018.107040 707 Journal of Water Resource and Protection
proposed system are shown in Table 1.
3.2.1. The key Strategies in Discretization
Improving the quality of spatial discretization and topo-adjacency improves model simulations. There are three key strategies in spatial discretization: 1) The interrupted spacing of the geographical objects should be unified; this is a pre-requisite to building a one-to-one corresponding relationship between discre-tized grids (e.g., triangles or quadrangles) in adjacent objects. 2) The road net-works have the highest priority of interrupted spacing, and the length of other object spacing should be consistent with the spacing length of the roads. This requirement exists because the road networks have an obvious water catchment effect and coverage effect in urban areas and most land surfaces area are envel-oped by road networks. 3) An extensible geo-semantic store was used to save the distribution rule of buildings because too many building types exist in urban ar-eas. Each building type has a corresponding saved semantic model todepict the water distribution rule. The geo-semantic store is used to save and manage these semantic models. However, it is difficult to construct the semantic store all at once, and the extensible strategy provides a mechanism to consider infinite types of buildings.
3.2.2. Implementation of Spatial Discretization Based on GIS Data
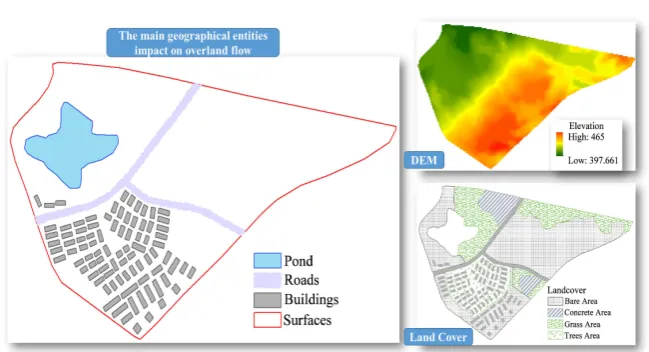
To improve the availability of a simulation engine, the Open Geospatial Consor-tium (OGC, http://www.opengeospatial.org/) standard simple feature geometry model was employed to represent geographical objects in the urban environ-ment. The ESRI Shapefile format (the most popular vector data format, which is also associated with the simple feature model) and WKB/WKT (Well-Known Binary/Well-Known Text, a widely used data format according to the simple feature model) were used to represent the spatial data [52]. All the geographical objects in this system were saved as polygons, which were used to support dis-cretization into mesh grids that were used to calculate the flux, direction and ve-locity of overland flow and to extract surface impact factors, such as the rate of infiltration, the slope, and Manning coefficient. The DEM and land cover data were used to extract the surface impact factors with spatial overlay analysis.
Fig-ure 2 shows the GIS data that were used. The basic GIS data content include
[image:9.595.208.539.637.724.2]four vector data layers, which are pond, roads, shape of buildings, surfaces, and land cover data. DEM used to provide the elevation value for discretization scheme.
Table 1. The discretization schemas of the main considered objects.
Geographical Object Simulation Method Discretization Scheme
Ground 2D Overland flow model Triangle mesh grid
Road network 2D Overland flow model Quadrangle mesh grid
Pond Linear reservoir model Interrupted border
DOI: 10.4236/jwarp.2018.107040 708 Journal of Water Resource and Protection
Figure 2. The basic GIS data used in spatial discretization.
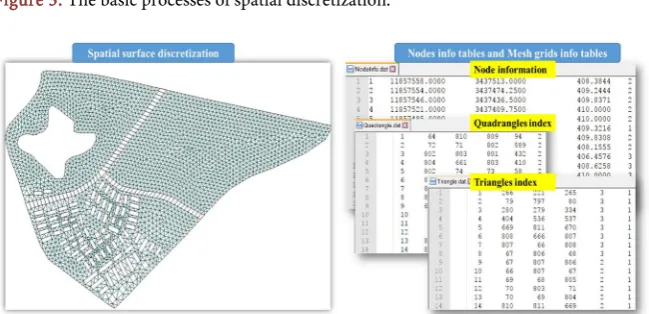
The basic processes employed in the spatial discretization include the follow-ing: 1) Set the spacing length of the geographical objects to obtain equidistant points on the borders of roads, land surfaces, ponds and shapes of buildings. Then, use the equidistant points as basic points of discretization. 2) Based on the equidistant points, generate line segments as basic control lines. To improve the quality of the mesh grids, certain methods were implemented to avoid producing line segments that were too short, especially for the shapes of the buildings. 3) Generate the mesh grids, which include quadrangular mesh grids for roads, tri-angle mesh grids for land surfaces, interrupted polygons for ponds, and inter-rupted polygons for buildings. In this proposed simulation system, a high-quality 2D triangle mesh generator was employed to generate the triangle mesh [53]; this generator is advantageous for supporting the implementation of mesh grids with hollows. 4) Output the data structure of the mesh grids. The data structure of the mesh grids includes node information (index number, coordinates, and various abstracted attributes) and node relationships (quadrangle index number and contained nodes index). For buildings and ponds, the proposed system does not support simulations of the inner motion in these two objects and only needs to save the node information to support the flux exchange calculation with adja-cent roads or land surfaces. Figure 3 shows the basic processes of spatial discre-tization. Figure 4 shows discretization of spatial surfaces and output data.
3.3. Topo-Adjacency
DOI: 10.4236/jwarp.2018.107040 709 Journal of Water Resource and Protection
Figure 3. The basic processes of spatial discretization.
Figure 4. The discretization of spatial surfaces and output data.
automatic connection between different objects in overland flow motion proc-esses. There is a prerequisite condition that all vector data should be pre-processed in order to avoid topological errors between such geographical objects.
In a standard GIS vector data management system, the different geographical objects are usually saved as different data layers, and the data layer is the basic data organization unit. Each geographic object is saved as a feature in a corre-sponding data layer. In this proposed simulation system, we designed four layers assigned to land surfaces, ponds, roads, and buildings. The main steps in the topo-adjacency workflow include finding touching geographic objects and ob-taining adjacent points on the touching borders. Furthermore, a data structure to save the topological relationships is also needed. The basic process of deter-miningtopo-adjacency includes three steps: 1) Searching the touching objects based on a topological model, such as the Dimensionally Extended Nine-Inter- section Model (DE-9IM) [55] [56]. To improve the computational efficiency and to avoid a comparison of every feature to every other feature, the spatial index of vector data in GIS is used to improve the efficiency of searching the touching objects. 2) Obtaining the points on the touching borders. These points are the generated control points that have the same spacing length. The ID of the line segment should match the spatial discretized data structure described above. The flux exchange is calculated for each line segment. 3) Designing the data struc-ture, which is used to save adjacency relationships. In each time step iteration, the flux exchange is calculated between each touching object. The data structure should easily support the logical connecting relationships between two different objects. The topo-adjacency between different objects is shown in Figure 5.
3.4. Automatic Extraction of Surface Parameters
[image:11.595.210.535.132.289.2]DOI: 10.4236/jwarp.2018.107040 710 Journal of Water Resource and Protection
Figure 5. The topo-adjacency between different objects.
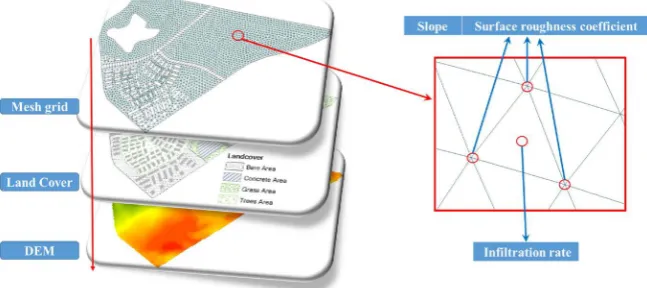
concrete and pavement, and bare surfaces. The slopes of surfaces also have an un-even distribution at different locations. The surface heterogeneity must be consid-ered in the simulation with surface parameters. These parameters include the in-filtration rate, surface roughness coefficient, and slope, which each have corre-sponding spatial coordinates. The basic idea of GIS overlay analysis is to extract different data from different layers based on the same spatial area or coordinates. Overlay analysis is an efficient method to aid in the automatic extraction of surface parameters [57]. In the simulation system proposed here, the velocity and direc-tion of overland flow are calculated at the vertices of a triangle. As such, the slope and surface roughness coefficient are extracted by the triangle nodes and are saved in the node information table. The water flux is calculated at the borders of the triangles, and thus, the infiltration rate is saved in the triangle information table, and the parameter is extracted by the coordinate of the triangle centre. The ex-traction of surface parameters by overlay analysis is shown in Figure 6.
4. Models of Urban Overland Flow Processes
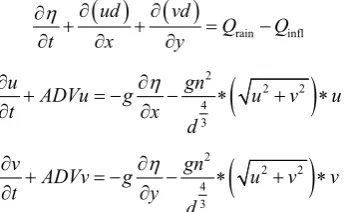
4.1. The 2D Overland Flow Model [49]
( )
( )
rain infl
ud vd
Q Q
t x y
η ∂ ∂
∂ + + =
∂ ∂ ∂ −
(
)
2
2 2
4 3
u ADVu g gn u v u
t x d
η
∂ + = − ∂ − ∗ + ∗
∂ ∂ (1)
(
)
2
2 2
4 3
v ADVv g gn u v v
t y d
η
∂ + = − ∂ − ∗ + ∗
∂ ∂
In Equation (1), where d is the water depth; η is the water surface elevation;
ADVu and ADVv denote the advection in the u and v directions, respectively; t
is the travel time for each iteration; h is the elevation; Qrain is the rainfall; Qinfl is
DOI: 10.4236/jwarp.2018.107040 711 Journal of Water Resource and Protection
Figure 6. Extraction of surface parameters by overlay analysis.
and road networks. The model can depict the water direction and magnitude in each calculation cell and can also calculatethe depth of accumulated water.
4.2. Pond Water Levels
Pond water levels dynamically change with rainfall and surface inflow:
1 in
i i i Q
E E R
A
−
= + + (2) In Equation (2), where Ei denotesthe current water level in the pond, Ei−1
denotes the water level at a previous time, Ri denotes the rainfall, Qin denotes
the inflow from a touching area, and A is the cross-sectional flow area of the pond.
4.3. Surface Infiltration Model
The land surface infiltration model is used to calculate the water infiltration for different types of surfaces. The modified Horton infiltration model isused in this system because the input parameters of this model are relatively easy to obtain
[58]. In this system, the modified Horton infiltration model wasextracted the source codes in SWMM to implement the infiltration model.
4.4. Water Distribution Rules for Buildings
ob-DOI: 10.4236/jwarp.2018.107040 712 Journal of Water Resource and Protection
jects [59]. There are many different geo-semantic models, such as CityGML [60]
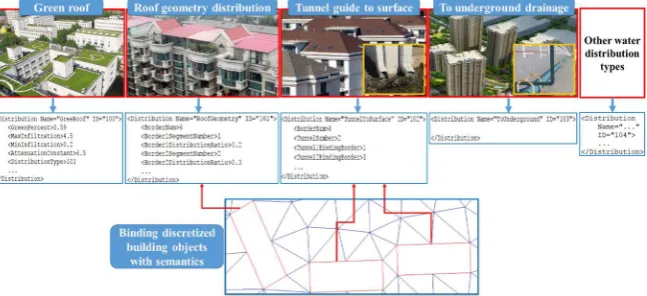
and the Building Information Model [61], which are used to represent different geographical objects in urban areas [62]. These models are used to improve the water distribution rules for defining and making connections between adjacent meshes. This article proposes a semantic modelling method to implement the water distribution rule. This approach includes a semantic model base, which is used to save the different semantics used to delineate the water distribution rules of buildings; each building should be bound with a corresponding semantic model. These semantic models contain water flux calculation parameters such as lengths of borders, areas of buildings, and roof types. Each semantic model has a corresponding procedural semantic interpreter that is used to extract the pa-rameters in a procedural way and to calculate the flux of the water distribution. The template of semantics in the semantic model base can be dynamically in-creased and modified for uncertain water distribution rules associated with buildings. A demonstration of the semantic models for the water distribution rules applicable to buildings is shown in Figure 7.
5. Key Strategies for the Geo-Visual Analytic Platform Used
for What-If Analysis
For supporting the what-if analysis, the design and implementation of the simu-lation system are important aspects. There are two keyissues for supporting what-if analysiswith technical methods: 1) implementing human interactive changes to the geographical environment in a virtual environment (specifically, implementing human-induced changes in an urban environment via a 3D vir-tual environment) and 2) helping people understand the influences by hu-man-induced changes [63] [64].
[image:14.595.214.538.545.693.2]Therefore, key strategies are used to support these two issues. These strategies include the following. 1) To support the what-if analysis based on the method of human-earth interactions, the simulation platform provides interfaces for the interactive changesof geographical objects to implement changes in the urban
DOI: 10.4236/jwarp.2018.107040 713 Journal of Water Resource and Protection
environment. The urban spatial discretization programs and simulation models can perform the data pre-processing of simulations automatically based on new simulation scenarios. 2) To help people understand the processes of water flow in a well-perceived way, a 3D visual analytic platformwas developed. This plat-form integrates the mechanism of water flow and visualization technology to support the dynamic visualization of water processes in a complex urban envi-ronment. These platformprovides geo-analytic methods help people understand the influences of human-induced changes to the urban environment via geo-visual analysis and comparative analysis.
5.1. Human-Earth Interactions
The implementation of changes in the urban environment and the identification of feedbacks are essential processes in what-if analysis. From the perspectives of psychology and sociology, interactions between people are an important method to reconcile dissonance. However, from the earth system perspective, it is too costlyto perform these experiments in anactual physical geographic environ-ment. With the development of multi-channel interactions and representation-techniques in GIS, overland flow simulation experiments can be conducted in a 3D virtual environment [65].
As described above, the hydrological factors in an urban environment are de-lineated by standard GIS vector data and raster data. These data are discretized into corresponding schemes to support the model while it is running. The data parsing programs, spatial discretization programs, and topo-adjacency programs can be reused in the object-oriented programming method. Thus, in the pro-posed system, users can interactively change the geographical objects by chang-ing the spatial data and attribute data of the geographic objects to implement human-earth interactions. The interactions in this proposed system include adding/deleting objects, changing the attributes of objects, and changing the shapes of objects. These changes are used to imitate the construction of a real city. The addition/deletion of objects includes adding/deleting ponds, buildings, and roads. In the real world, such construction is commonin urban areas, and the addition/removal of objects has important impacts on urban overland flow. Changing the attributes of objects includes changing the type of surface, the type of roof, and the water depth of a pond. Changing the shapes of objects includes changing the shape of a pond and the shape of a surface.
DOI: 10.4236/jwarp.2018.107040 714 Journal of Water Resource and Protection
5.2. Understanding the Influences in a Well-Perceived Way
In conventional representations of model outputs and simulation results, it is difficult to clearly understand the overland flow processes because the outputs of the simulation processes from mathematical models are often saved as a series of digital numbers and characters in a specific data structure. This process makes it difficult to understand most of the outputs directly. As such, there is a need for a better and more graphical way to understand and share the outputs of simula-tions [66] [67]. In a 3D virtual scene, users can watch the dynamic scene from any perspective, and all the geographical objects are clearly represented. For example, 3D buildings and topography are useful in better understanding the impacts of flooding. In addition to producing avirtual 3D representation of a city, the 3D dynamic visual analytic methods can improve understanding of the overland flow process and flooding results by revealing 1) the influences on overland flow processes and 2) the influences on the results.
5.2.1. Understanding the Influences on Overland Flow Processes
To facilitate a better understanding of the influences on processes, the designed strategies include the following. 1) The visualization and comparative analysis of the dynamic water direction and magnitude is performed for each calculation unit. The visualization of the water direction and magnitude for each unit can produce a representation of the water motion mechanism at a specific moment. The com-parative analysis is used to compare the different motion mechanisms of different simulation scenarios. 2) The dynamic visualization and comparative analysis of dynamic streamlines is also performed. Streamline analysis is an important hy-drologic analytical method that is used to help understand the movement proc-esses of the water volume from its source to its destination. The water track algo-rithm was used to record the water motion routes for each simulation unit [68].
5.2.2. Understanding the Influences on the Results of Flow Concentration
DOI: 10.4236/jwarp.2018.107040 715 Journal of Water Resource and Protection
6. Prototype System and Experiments
6.1. Development of the Prototype System
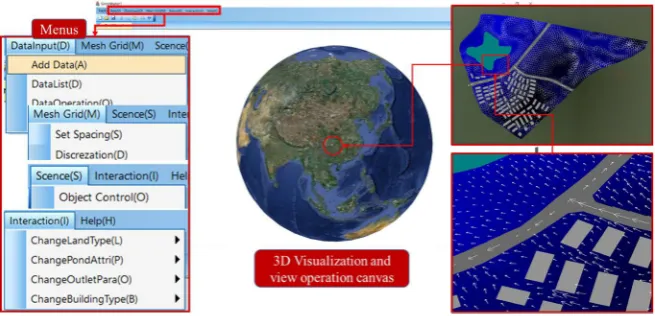
According to the methods mentioned above, C++ STL was employed to imple-ment the modules of data access, spatial discretization, numerical calculation, visualization and interactions. MFC 2012 was used to develop the GUIs, and OpenGL was used to develop the 3D visualization drawing interfaces. GDAL was used to parse the GIS data and implement the topological analysis. Additionally, some open source libraries, such as PROJ4 and GEOS, were used to help imple-ment the virtual 3D earth for visualization and interactions. The prototype sys-tem is shown in Figure 8. The prototype system is a stand-alone software pro-gram, and all the methods mentioned above are implemented in this system by theobject-oriented programming method. The main menus of this system in-clude DataInput, which is used to handle the spatial data, MeshGrid, which is used to call the spatial discretization and topo-adjacency functions, and Scene, which helps the user control the 3D scene, such as showing/hiding the visu-alobjects. Interactions are used to implement the interactive changes to the geo-graphical objects and simulation scenarios. The prototype system and main menus are shown in Figure 8.
6.2. Experiments
The experiments are based on a 3.9 km2 urban community undergoing active
construction in Chongqing city, China. This area includes four typical urban geographical objects, i.e., buildings, roads, ponds and different types of urban surfaces. The resolution of theDEM is 1 m, and the scale of all thevector data is 1:5000. The number of discretized triangles is 1944, and the number of discre-tized quadrangles for roads is 276. The main computational resources for this experiment are an Intel I7 with a 2.8 GHz CPU, 16 GB RAM, and anNvidia GTX 1060 graphics device.
In an active construction area, the construction always involves changesto the land type. A block usually contains different land types. The shapes of different land types and green infrastructure are irregular geographicalboundaries, espe-cially for some green infrastructure. Therefore, the GUI of the graphical editing programs can be used to change the geographical boundaries. Figure 9 shows an example of human-earth interaction after changing the geometry. The control points are the vertexes of borders. By moving the control points, the users can change of the shape of the borders. In this experiment, the grass area is in-creased, and the concrete area is decreased. In this change process, the topologi-cal relation between these two features is revised dynamitopologi-cally. After such a shape change, the system calls the spatial discretization program automatically to re-generate the mesh grids for new simulation.
DOI: 10.4236/jwarp.2018.107040 716 Journal of Water Resource and Protection
[image:18.595.208.539.261.407.2] [image:18.595.209.538.438.584.2]Figure 8. The prototype system and main menus.
Figure 9. Example of changing the geometry of an object.
Figure 10. Example of changing the land surface type.
DOI: 10.4236/jwarp.2018.107040 717 Journal of Water Resource and Protection
specialized knowledge; thus, this work isdifficult for normal users. In the pro-posed system, the users only need to handle the data editing in a graphical way, which is relatively easierfor normal users. These two experiments are used to il-lustrate the potential effects of “if humanschanged the environment in some way” inthe what-if analysis concept.
An experiment to better understand overland flow processes was also per-formed. Figure 11 shows the visualization and comparative analysis of flow di-rection and magnitude. In a previous experiment, the land type of a block was changed from concrete area into grass area, and the simulation presented here was based on the two scenarios. The hypotheticalprecipitationin this simulation is 54 mm in 2 hours, and the simulation time step is 30 seconds. The screenshot was captured on the 180th iteration calculation. Figure 11 shows that after the change in the land type from concrete land to grass land, the magnitude of the water flow was decreased at that specified time in the simulation. This figure was from the geo-visual analytic platform, which integrated mathematical and phys-ics models, geo-visual analytphys-ics technologies. Based on this platform, the dy-namic visualization can be implemented without data transfer from hard disk. All the processes are competed in random-access memory. This is an effective way to improve the convenient of the simulation.
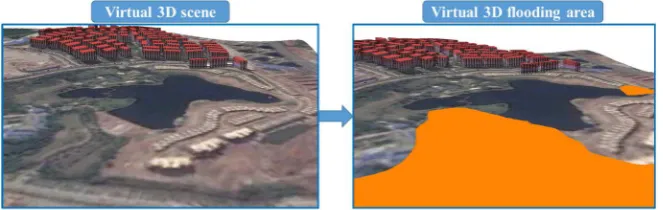
Virtual 3D models based on a virtual environment are shown in Figure 12. This system supports dynamic construction and drawing of 3D models by OpenGL. Some APIs are used to support inputs and to visualize the 3D models from other 3D model construction software programs, such as CityEngine and3ds Max.
Figure 12 shows the simulated flooding area associated with a hypothetical
ex-treme precipitation event. In thissimulation, the flooding was due tooverflow from the pond. Such 3D visualization programs can help to understand the flooding results. The experiments shownin Figure 11 and Figure 12 are useful for understanding the influences on the processes and the results.
7. Conclusions and Future Work
DOI: 10.4236/jwarp.2018.107040 718 Journal of Water Resource and Protection
Figure 11. Visualization and comparative analysis of flow direction and magnitude.
Figure 12. The 3D representation of avirtual 3D scene and flooding area.
pre-processing work for simulation scenarios can be implemented conveniently. Furthermore, virtual interaction and representation techniques are helpful for conducting what-if experiments. The experiments demonstrated that what-if analysis is an important and useful concept for urban water management, and the proposed system can effectively support the what-if analysis.
Although it is insufficient from the scientific perspective, this article only dis-cusses the key methods of the proposed system and the capability of the system. Thus, nonumerical applications are performed in this study to demonstrate the system’s simulation accuracy, because the area of flooding in complex urban ar-eas is difficult to capture, and satellite imagescontain many errors when used to collect data during stormy weather. Flux surveying also depends on uncertain conditions, such as weather conditions and equipment. We will try to collect observational data for validation via photographing or flux surveying. In future work, we will illustrate the calculation methods of the models and coupling methods between adjacent geographic objects. For accuracy validation, we will couple drainage simulation models with the simulation system. In that research, we will perform applied experiments to validate the accuracy of the simulations, and the experiments will be based a larger and more comprehensive area.
[image:20.595.208.540.266.371.2]DOI: 10.4236/jwarp.2018.107040 719 Journal of Water Resource and Protection
buildings. The complexity and heterogeneity of urban environments are consid-erable challenges for urban hydrological modelling and simulation. Existing modelling methods and simulation system software make it difficult to support the model construction, implementation and maintenance of extremely complex and heterogeneous urban water simulation systems. Additionally, the simulation system involves GUI interactions and visualizations. Therefore, a more flexible and maintainable modelling method and software framework should be pro-posed to solve this issue.
Acknowledgements
The work described in this article involves many data and programming method and was supported by the following research programs: The National Basic Re-search Programme of China (973 Program) [grant number 2015CB954102]; the National Natural Science Foundation of China [grant number 41231173].
Author’s Contributions
Guoqiang Peng provided the initial idea for this study; Guoqiang Peng and Fu-qiang Lu designed and performed the experiment; Zhiyao Song and GuoFu-qiang Peng analysed the results of the experiment; Guoqiang Peng and Zhuo Zhang wrote the paper.
Conflicts of Interest
The authors declare no conflict of interest.
References
[1] Rockström, J., Steffen, W., Noone, K., Persson, Å., Chapin III, F.S., Lambin, E.F., Lenton, T.M., Scheffer, M., Folke, C., Schellnhuber, H.J. and Nykvist, B. (2009) A Safe Operating Space for Humanity. Nature, 461, 472-475.
[2] United Nations (2011) World Urbanization Prospects—The 2011 Revision. New York.
[3] Kalnay, E. and Cai, M. (2003) Impact of Urbanization and Land-Use Change on Climate. Nature, 423, 528-531. https://doi.org/10.1038/nature01675
[4] Foley, J.A., DeFries, R., Asner, G.P., Barford, C., Bonan, G., Carpenter, S.R., Chapin, F.S., Coe, M.T., Daily, G.C., Gibbs, H.K. and Helkowski, J.H. (2005) Global Conse-quences of Land Use. Science, 309, 570-574.
[5] Yang, P., Ren, G. and Yan, P. (2017) Evidence for a Strong Association of Short-Duration Intense Rainfall with Urbanization in the Beijing Urban Area.
Journal of Climate, 30, 5851-5870. https://doi.org/10.1175/JCLI-D-16-0671.1 [6] Suriya, S. and Mudgal, B.V. (2012) Impact of Urbanization on Flooding: The
Thi-rusoolam Sub Watershed—A Case Study. Journal of Hydrology, 412, 210-219. https://doi.org/10.1016/j.jhydrol.2011.05.008
[7] Aerts, J.C., Botzen, W.W., Emanuel, K., Lin, N., de Moel, H. and Michel-Kerjan, E.O. (2014) Evaluating Flood Resilience Strategies for Coastal Megacities. Science, 344, 473-475. https://doi.org/10.1126/science.1248222
DOI: 10.4236/jwarp.2018.107040 720 Journal of Water Resource and Protection Urban Flooding in China: Main Causes and Policy Recommendations. Hydrological Processes, 30, 1149-1152. https://doi.org/10.1002/hyp.10717
[9] Lu, P., Shen, Y.T. and Lin, T.H. (2017) Environmental Risks or Costs? Exploring Flooding and the Urban Heat Island Effect in Planning for Policymaking: A Case Study in the Southern Taiwan Science Park. Sustainability, 9, Article No. 2239. https://doi.org/10.3390/su9122239
[10] Hilde, T.W. (2018) Green Infrastructure for Disaster Resilience: Exploring Connec-tions with Scenario Planning. Doctoral Dissertation.
[11] Goodman, R. (1980) Taoism and Ecology. Environmental Ethics, 2, 73-80. https://doi.org/10.5840/enviroethics19802115
[12] Ip, P.K. (1983) Taoism and the Foundations of Environmental Ethics. Environ-mental Ethics, 5, 335-343. https://doi.org/10.5840/enviroethics19835414
[13] Ames, R.T. (1986) Taoism and the Nature of Nature. Environmental Ethics, 8, 317-350. https://doi.org/10.5840/enviroethics19868438
[14] Higgins, L.T. and Zheng, M. (2002) An Introduction to Chinese Psychology—Its Historical Roots until the Present Day. The Journal of Psychology, 136, 225-239. https://doi.org/10.1080/00223980209604152
[15] Li, K. and Xu, Z. (2006) Overview of Dujiangyan Irrigation Scheme of Ancient China with Current Theory. Irrigation and Drainage, 55, 291-298.
https://doi.org/10.1002/ird.234
[16] Cao, S., Liu, X. and Er, H. (2010) Dujiangyan Irrigation System—A World Cultural Heritage Corresponding to Concepts of Modern Hydraulic Science. Journal of Hy-dro-Environment Research, 4, 3-13. https://doi.org/10.1016/j.jher.2009.09.003 [17] Khan, S., Tariq, R., Yuanlai, C. and Blackwell, J. (2006) Can Irrigation Be
Sustaina-ble? Agricultural Water Management, 80, 87-99. https://doi.org/10.1016/j.agwat.2005.07.006
[18] Zhang, S., Yi, Y., Liu, Y. and Wang, X. (2012) Hydraulic Principles of the 2,268-Year-Old Dujiangyan Project in China. Journal of Hydraulic Engineering, 139, 538-546. https://doi.org/10.1061/(ASCE)HY.1943-7900.0000675
[19] Leandro, J., Schumann, A. and Pfister, A. (2016) A Step towards Considering the Spatial Heterogeneity of Urban Key Features in Urban Hydrology Flood Modelling.
Journal of Hydrology, 535, 356-365.
[20] Yin, J., Yu, D. and Wilby, R. (2016) Modelling the Impact of Land Subsidence on Urban Pluvial Flooding: A Case Study of Downtown Shanghai, China. Science of the Total Environment, 544, 744-753.
https://doi.org/10.1016/j.scitotenv.2015.11.159
[21] Quimpo, R.G. (1984) Spatial Heterogeneity and Models of Surface Runoff. Journal of Hydrology, 68, 19-28.
[22] Irwin, E.G. and Bockstael, N.E. (2007) The Evolution of Urban Sprawl: Evidence of Spatial Heterogeneity and Increasing Land Fragmentation. Proceedings of the Na-tional Academy of Sciences, 104, 20672-20677.
https://doi.org/10.1073/pnas.0705527105
[23] Chang, H.S. and Chen, T.L. (2016) Spatial Heterogeneity of Local Flood Vulnerabil-ity Indicators within Flood-Prone Areas in Taiwan. Environmental Earth Sciences, 75, 1484. https://doi.org/10.1007/s12665-016-6294-x
[24] Klosterman, R.E. (1999) The What If? Collaborative Planning Support System. En-vironment and Planning B: Planning and Design, 26, 393-408.
DOI: 10.4236/jwarp.2018.107040 721 Journal of Water Resource and Protection [25] Lin, H., Chen, M. and Lu, G. (2013) Virtual Geographic Environment: A Work-space for Computer-Aided Geographic Experiments. Annals of the Association of American Geographers, 103, 465-482.
https://doi.org/10.1080/00045608.2012.689234
[26] Arsham, H., Feuerverger, A., Mcleish, D.L., Kreimer, J. and Rubinstein, R.Y. (1989) Sensitivity Analysis and the “What If” Problem in Simulation Analysis. Mathemati-cal and Computer Modelling, 12, 193-219.
https://doi.org/10.1016/0895-7177(89)90434-2
[27] Fletcher, T.D., Andrieu, H. and Hamel, P. (2013) Understanding, Management and Modelling of Urban Hydrology and Its Consequences for Receiving Waters: A State of the Art. Advances in Water Resources, 51, 261-279.
https://doi.org/10.1016/j.advwatres.2012.09.001
[28] Wu, X., Wang, Z., Guo, S., Liao, W., Zeng, Z. and Chen, X. (2017) Scenario-Based Projections of Future Urban Inundation within a Coupled Hydrodynamic Model Framework: A Case Study in Dongguan City, China. Journal of Hydrology, 547, 428-442. https://doi.org/10.1016/j.jhydrol.2017.02.020
[29] Rizzi, S. (2009) What-If Analysis. Encyclopedia of Database Systems. Springer, Ber-lin, 3525-3529.
[30] Golfarelli, M., Rizzi, S. and Proli, A. (2006) Designing What-If Analysis: Towards a Methodology. Proceedings of the 9th ACM International Workshop on Data Wa-rehousing and OLAP, Arlington, 10 November 2006, 51-58.
https://doi.org/10.1145/1183512.1183523
[31] Pettit, C., Keysers, J., Bishop, I. and Klosterman, R. (2008) Applying the What If? Planning Support System for Better Understanding Urban Fringe Growth. In:
Landscape Analysis and Visualisation, Springer, Berlin, Heidelberg, 435-454. [32] Brown, L.A. (1976) National Symposium on Urban Hydrology and Sediment
Con-trol. Proceedings: National Symposium on Urban Hydrology, Hydraulics, and Se-diment Control, Vol. 111, Lexington, 27-29 July 1976, 99.
[33] Bicknell, B.R., Imhoff, J.C., Kittle Jr., J.L., Jobes, T.H., Donigian Jr., A.S. and Johan-son, R. (2001) Hydrological Simulation Program-Fortran: HSPF Version 12 User’s Manual. AQUA TERRA Consultants, Mountain View.
[34] Terstriep, M.L. and Stall, J.B. (1974) The Illinois Urban Drainage Area Simulator, ILLUDAS. Bulletin (Illinois State Water Survey) No. 58.
[35] Ogden, F.L., Garbrecht, J., DeBarry, P.A. and Johnson, L.E. (2001) GIS and Distri-buted Watershed Models. II: Modules, Interfaces, and Models. Journal of Hydro-logic Engineering, 6, 515-523.
https://doi.org/10.1061/(ASCE)1084-0699(2001)6:6(515)
[36] Mignot, E., Paquier, A. and Haider, S. (2006) Modeling Floods in a Dense Urban Area Using 2D Shallow Water Equations. Journal of Hydrology, 327, 186-199. https://doi.org/10.1016/j.jhydrol.2005.11.026
[37] Xie, J., Chen, H., Liao, Z., Gu, X., Zhu, D. and Zhang, J. (2017) An Integrated As-sessment of Urban Flooding Mitigation Strategies for Robust Decision Making. En-vironmental Modelling & Software, 95, 143-155.
https://doi.org/10.1016/j.envsoft.2017.06.027
[38] Lin, B., Zhou, L., Xu, D., Zhu, A.X. and Lu, G. (2018) A Discrete Global Grid Sys-tem for Earth SysSys-tem Modeling. International Journal of Geographical Information Science, 32, 711-737. https://doi.org/10.1080/13658816.2017.1391389
Dy-DOI: 10.4236/jwarp.2018.107040 722 Journal of Water Resource and Protection namic Flow Interactions between Storm Sewer System and Overland Surface for Different Land Covers in Urban Areas. Journal of Hydrology, 524, 662-679. https://doi.org/10.1016/j.jhydrol.2015.03.014
[40] Bisht, D.S., Chatterjee, C., Kalakoti, S., Upadhyay, P., Sahoo, M. and Panda, A. (2016) Modeling Urban Floods and Drainage Using SWMM and MIKE URBAN: A Case Study. Natural Hazards, 84, 749-776.
https://doi.org/10.1007/s11069-016-2455-1
[41] Lin, H., Batty, M., Jørgensen, S.E., Fu, B., Konecny, M., Voinov, A., Torrens, P., Lu, G., Zhu, A., Wilson, J.P. and Gong, J. (2015) Virtual Environments Begin to Em-brace Process-Based Geographic Analysis. Transactions in GIS, 19, 493-498. https://doi.org/10.1111/tgis.12167
[42] Egenhofer, M.J. and Herring, J. (1990) Categorizing Binary Topological Relations between Regions, Lines, and Points in Geographic Databases. The 9-Intersection: Formalism and Its Use for Naturallanguage Spatial Predicates.
[43] Cea, L., Legout, C., Darboux, F., Esteves, M. and Nord, G. (2014) Experimental Va-lidation of a 2D Overland Flow Model Using High Resolution Water Depth and Velocity Data. Journal of Hydrology, 513, 142-153.
https://doi.org/10.1016/j.jhydrol.2014.03.052
[44] González, V.I., Carkovic, A.B., Lobo, G.P., Flanagan, D.C. and Bonilla, C.A. (2016) Spatial Discretization of Large Watersheds and Its Influence on the Estimation of Hillslope Sediment Yield. Hydrological Processes, 30, 30-39.
https://doi.org/10.1002/hyp.10559
[45] Dongquan, Z., Jining, C., Haozheng, W., Qingyuan, T., Shangbing, C. and Zheng, S. (2009) GIS-Based Urban Rainfall-Runoff Modeling Using an Automatic Catch-ment-Discretization Approach: A Case Study in Macau. Environmental Earth Sciences, 59, 465-472. https://doi.org/10.1007/s12665-009-0045-1
[46] Tarasova, L., Knoche, M., Dietrich, J. and Merz, R. (2016) Effects of Input Discreti-zation, Model Complexity, and Calibration Strategy on Model Performance in a Data-Scarce Glacierized Catchment in Central Asia. Water Resources Research, 52, 4674-4699. https://doi.org/10.1002/2015WR018551
[47] Liu, Y., Zhang, W. and Zhang, Z. (2015) A Conceptual Data Model Coupling with Physically-Based Distributed Hydrological Models Based on Catchment Discretiza-tion Schemas. Journal of Hydrology, 530, 206-215.
https://doi.org/10.1016/j.jhydrol.2015.09.049
[48] Berry, P., Bonduá, S., Bortolotti, V., Cormio, C. and Vasini, E.M. (2014) A GIS-Based Open Source Pre-Processor for Georesources Numerical Modeling. Environmental Modelling & Software, 62, 52-64. https://doi.org/10.1016/j.envsoft.2014.08.011 [49] Lee, S., Nakagawa, H., Kawaike, K. and Zhang, H. (2016) Urban Inundation
Simu-lation Considering Road Network and Building Configurations. Journal of Flood Risk Management, 9, 224-233. https://doi.org/10.1111/jfr3.12165
[50] Schubert, J.E., Sanders, B.F., Smith, M.J. and Wright, N.G. (2008) Unstructured Mesh Generation and Landcover-Based Resistance for Hydrodynamic Modeling of Urban Flooding. Advances in Water Resources, 31, 1603-1621.
https://doi.org/10.1016/j.advwatres.2008.07.012
[51] Chen, Y., Zhou, Q., Li, S., Meng, F., Bi, X., Wilson, J.P., Xing, Z., Qi, J., Li, Q. and Zhang, C. (2014) The Simulation of Surface Flow Dynamics Using a Flow-Path Network Model. International Journal of Geographical Information Science, 28, 2242-2260. https://doi.org/10.1080/13658816.2014.917312
DOI: 10.4236/jwarp.2018.107040 723 Journal of Water Resource and Protection Geographic Information-Simple Feature Access—Part 1: Common Architecture. OGC Document.
[53] Cheng, S.W., Dey, T.K. and Shewchuk, J. (2012) Delaunay Mesh Generation. CRC Press, Boca Raton.
[54] Yue, P., Di, L., Wei, Y. and Han, W. (2013) Intelligent Services for Discovery of Complex Geospatial Features from Remote Sensing Imagery. ISPRS Journal of Photogrammetry and Remote Sensing, 83, 151-164.
https://doi.org/10.1016/j.isprsjprs.2013.02.015
[55] Clementini, E. and Di Felice, P. (1995) A Comparison of Methods for Representing Topological Relationships. Information Sciences—Applications, 3, 149-178. https://doi.org/10.1016/1069-0115(94)00033-X
[56] Strobl, C. (2017) Dimensionally Extended Nine-Intersection Model (de-9im). In:
Encyclopedia of GIS, Springer, Cham, 470-476. https://doi.org/10.1007/978-3-319-17885-1_298
[57] Kim, S.W., Park, J.S., Kim, D. and Oh, J.M. (2014) Runoff Characteristics of Non-Point Pollutants Caused by Different Land Uses and a Spatial Overlay Analysis with Spa-tial Distribution of Industrial Cluster: A Case Study of the Lake Sihwa Watershed.
Environmental Earth Sciences, 71, 483-496. https://doi.org/10.1007/s12665-013-2933-7
[58] Bauer, S.W. (1974) A Modified Horton Equation for Infiltration during Intermit-tent Rainfall. Hydrological Sciences Journal, 19, 219-225.
https://doi.org/10.1080/02626667409493900
[59] Janowicz, K., Schade, S., Bröring, A., Keßler, C., Maué, P. and Stasch, C. (2010) Se-mantic Enablement for Spatial Data Infrastructures. Transactions in GIS, 14, 111-129. https://doi.org/10.1111/j.1467-9671.2010.01186.x
[60] Kolbe, T.H., Gröger, G. and Plümer, L. (2005) CityGML: Interoperable Access to 3D City Models. In: Geo-Information for Disaster Management, Springer, Berlin, Hei-delberg, 883-899. https://doi.org/10.1007/3-540-27468-5_63
[61] Azhar, S., Nadeem, A., Mok, J.Y. and Leung, B.H. (2008) Building Information Modeling (BIM): A New Paradigm for Visual Interactive Modeling and Simulation for Construction Projects. 1st International Conference on Construction in Devel-oping Countries, 4 August 2008, Vol. 1, 435-446.
[62] Zhu, J., Zhang, H., Yang, X., Yin, L., Li, Y., Hu, Y. and Zhang, X. (2016) A Colla-borative Virtual Geographic Environment for Emergency Dam-Break Simulation and Risk Analysis. Journal of Spatial Science, 61, 133-155.
https://doi.org/10.1080/14498596.2015.1051148
[63] Liu, M., Zhu, J., Zhu, Q., Qi, H., Yin, L., Zhang, X., Feng, B., He, H., Yang, W. and Chen, L. (2017) Optimization of Simulation and Visualization Analysis of Dam-Failure Flood Disaster for Diverse Computing Systems. International Journal of Geograph-ical Information Science, 31, 1891-1906.
https://doi.org/10.1080/13658816.2017.1334897
[64] Chen, M., Lin, H., Wen, Y., He, L. and Hu, M. (2012) Sino-VirtualMoon: A 3D Web Platform Using Chang’e-1 Data for Collaborative Research. Planetary and Space Science, 65, 130-136. https://doi.org/10.1016/j.pss.2012.01.005
DOI: 10.4236/jwarp.2018.107040 724 Journal of Water Resource and Protection [66] Lienert, C., Weingartner, R. and Hurni, L. (2009) Real-Time Visualization in Oper-ational Hydrology through Web-Based Cartography. Cartography and Geographic Information Science, 36, 45-58. https://doi.org/10.1559/152304009787340188 [67] Lienert, C., Weingartner, R. and Hurni, L. (2011) An Interactive, Web-Based,
Real-Time Hydrological Map Information System. Hydrological Sciences Journal, 56, 1-6. https://doi.org/10.1080/02626667.2010.536766
[68] Liu, W.C., Chen, W.B. and Hsu, M.H. (2011) Using a Three-Dimensional Par-ticle-Tracking Model to Estimate the Residence Time and Age of Water in a Tidal Estuary. Computers & Geosciences, 37, 1148-1161.