Safety Standards in Industrial Applications: A
Requirement for Fail-Safe Systems
E. Theocharis
Dept. of Industrial Designand Production Engineering University of West Attica,
Athens, Greece
M. Papoutsidakis
Dept. of Industrial Designand Production Engineering University of West Attica,
Athens, Greece
C. Drosos
Dept. of Industrial Designand Production Engineering, University of West Attica,
Athens, Greece
G. Chamilothoris
Dept. of Industrial Designand Production Engineering, University of West Attica,
Athens, Greece
ABSTRACT
This document considers the requirements of the safe operation of an industrial automation. It analyzes the detecting and reducing procedures of dangerous situations. It also describes the European legislations which need to be followed for designing, procurement, purchase or use of the industrial equipment in the European Union, but also in several other countries outside the European Union, to have an effective safe operation.
Keywords
Fail Safe Systems, Machinery Directives, Algorithms.
1.
INTRODUCTION
The European Directives and the Legislation define the substantial safety and the requirements of industrial
equipment. The safety requirements of the European Union under the Article 95 which states the free movement of products and under the Article 137 on the safe workplace are
defined with the following
[image:1.595.328.527.377.491.2]instructions.
Fig 1: Instructions Article 95 / Article 137
The Safety Standards are distinguished hierarchically into three levels:
1. Basic Safety Standards
They address basic engine design principles.
2. Generic Safety Standards
They address general safety issues and special protection equipment.
3. Machine Safety Standards
Special safety features of certain machinery categories, such as Low-Voltage, Pressers, etc.
2.
APPLICATION OF MACHINERY
DIRECTIVES ON A PRODUCTION
LINE
The phases required for a safety production line are: 1. Risk Assessment
2. Risk Estimation 3. Verification
[image:1.595.54.274.382.597.2]For a better understanding of the standards, we will design a machine following these standards. Figure 2 presents the machine we need to design.
Fig 2: Line production
The use of the machine (line production) is for transporting the containers (through the robotic arm) from the pallet to the conveyor belt, then drive (through the conveyor belt) to the filling point, where at that point they fill up and then drive to the next machine (line production).
Our machine has the following technical features: Three-phase supply: 400VAC , 50Hz Operating temperature: from 0°C to 50°C Indoor usage: IP54
Maximum box weight: 20 kilos
Action radius of the robotic arm: 2,5m X 2,5m
Use only by qualified personnel, skilled only with supervision and without visitor access
Duration of operation: 200.000 hours
2.1
Risk Assessment
To analyze the Risk, we need to define, identify and estimate the limits of the machine. These estimations should be supported by qualitative or quantitative assessment of the risk, related to the risks posed by the machines. [1]
Article 95
Etc. Machineries
Directive 2006/42/EC Directive 2014/30/EU
Constructor
Guidelines on health and safety at work
Directive89/655/EC
Constructor
2.1.1
Determination of the Machine
The risk assessment begins with setting some machine limits, taking into account all the phases of the machine's life. That means determining the characteristics and performance of a machine or a series of machines in an integrated process and the related people in the surrounding area and products. To wit, we should define the following:
The limits of the machine: physical limits of the machine, the human / machine interfaces, the power supply, The time limits: life span, maintenance intervals,
operating phases.
And the user groups: education, experience, skills and visitors.
2.1.2
Risk Identification
Risk identification must be done for all the phases of the machine's life, which are assemblage, transportation, installation, commissioning and operation. The possible dangers we might face are squish, crashing, cutting, compressing, pulling, scrubbing, abrasion.
The possible dangers to the machine in our example are: Robotic Arm: pushing and crashing
Conveyor Belt: pushing and crashing Filling System: crashing and compression
2.1.3
Estimation of Risks
To estimate the risks, we need to know if there is a requirement to access the hazardous area, the duration of the exposure, the number of people, the frequency of access, if the probability of a dangerous occurrence is low, medium or high, if the machine's type of movement is sudden, fast or slow, what are the qualifications of the individuals, ability for updates and escape.
2.1.4
Evaluation of Risks
[image:2.595.309.548.102.234.2]The machine's evaluation should initially be done per subsystem. In our example we have two subsystems which are:
Table 1. Robotic Arm
Damage Severity Possibility of occurrence
Α Β C D
1 Necessary First Aid
2 Necessary Treatment by a
doctor
3 Broken limbs or cut fingers
4 Death, loss eyes or arms 4B
[image:2.595.313.553.257.692.2]A: Very Possible B: Possible C: Impossible D: Very Impossible
Table 2. Transportation and Filling
Damage Severity Possibility of occurrence
Α Β C D
1 Necessary First Aid
2 Necessary Treatment by a
doctor
3 Broken limbs or cut fingers 3B 4 Death, loss eyes or arms
A: Very Possible B: Possible C: Impossible D: Very Impossible
Overall, for our machine we have:
Table 3. Overall
Damage Severity
Possibility of occurrence
Α Β C D
1 Necessary First Aid
2 Necessary Treatment by a
doctor
3 Broken limbs or cut fingers 3B 4 Death, loss eyes or arms 4B
A: Very Possible B: Possible C: Impossible D: Very Impossible
2.2
Risk Estimation
Fig 3: Methodology of Risk Estimation
After the Risk Estimation, we need to apply techniques with which we will reduce the risk. In the following Figure 3, the methodology we need to follow to detract the risk is given. [1] *Technical measures in our example could be placing a protective fence for the arm and the filler.
START
Has the risk been adequately reduced?
Risk reduction by safeguarding measures * Safe Design
Yes
No
Inform users about residual risks
New Risk Assessment
END
Has the risk been adequately reduced?
Yes
No
Yes Has the risk been
adequately reduced?
[image:2.595.49.286.511.624.2] [image:2.595.48.286.654.769.2]2.3
Standard Based Verification
Fig 4: Safety standards on industry
For the operation safety of the machines, there are the following standards with different safety levels:
2.3.1
IEC 61508
The IEC 61508 template determines a general approach for all safe life cycle activities for systems consisting of electrical, electronically programmable electronic components and used to perform safety functions. This unified approach was adopted in order to develop a rational and consistent technical policy for all safety-related systems. The main objective is to facilitate the development of products and of international standards products based on the IEC 61508 series. It has been designed, while keeping in mind, that the framework must be strong and comprehensive enough to cover future developments.
Below the umbrella of the IEC 61508 templates are: [2], [16], [20]
IEC 61511
EN ISO 13849-1 Performance Levels PL a - e IEC 62061 Safety Integrity Levels SIL 1- 3 The use of IEC 61511 is selected for Process Industry, whilst the EN ISO 13849-1 and IEC 62061 are for Manufacturing Industry. The EN ISO 13849-1 is selected for low complexity Safety systems, whilst the IEC 62061 is selected for complex Safety systems which use Safety PLCs. All three templates follow the same steps: [3]
Assess the Risks
Allocate the safety measures Design Architecture Validate
2.3.2
IEC 61511
The Safety Instrumented Systems (SISs) have been used for many years to perform safety features to process industries. If the instruments are to be used for SIF, it is necessary to achieve certain minimum standards and performance levels. The IEC 61511 occupies with Safety Instrumented Systems (SISs) application and Safety Integrity Levels (SILs) for Process Industries. The typical levels of protection and risk mitigation are shown in the Figure 5 below. [4], [15]
Fig 5: Levels of protection and risk mitigation
2.3.3
EN ISO 13849-1 Performance Levels PL a e
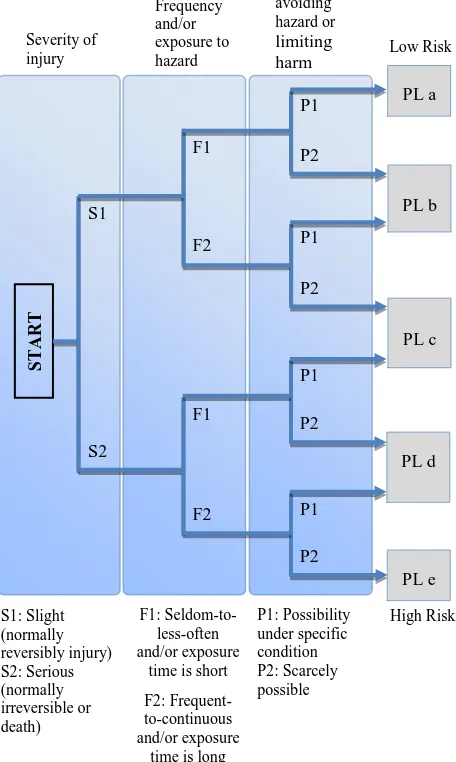
[image:3.595.54.260.90.292.2]The following Figure 6 shows the methodology for Risk estimation with the EN ISO 13849-1 template. [5]
Fig 6: Performance Levels PL a – e
S1: Slight (normally reversibly injury) S2: Serious (normally irreversible or death)
F1: Seldom-to-less-often and/or exposure
time is short
F2: Frequent-to-continuous and/or exposure
time is long
P1: Possibility under specific condition P2: Scarcely possible
High Risk
S
TAR
T
S1
S2
F1
F2
P1
P2
P1
P2
F1
F2
P1
P2
P1
P2 Severity of
injury
Frequency and/or exposure to hazard
Possibility of avoiding hazard or limiting
harm Low Risk
PL a
PL b
PL c
PL d
PL e PROCESS
CONTROL & MONITORING Basic process control system Monitoring systems (process alarms)
Operator supervision
PREVENTION
Mechanical protection system Process alarms with operator corrective action
Safety instrumented systems MITIGATION Mechanical mitigation systems
Safety instrumented systems
Operator supervision PLANT EMERGENCY RESPONSE
Evacuation procedures
COMMUNITY EMERGENSY RESPONSE Emergency broadcasting
IEC 61508
Ma
n
u
fa
ctu
rin
g
Ind
u
str
y
Pro
ce
ss
Ind
u
str
y
ISO 13849
IEC 62061
[image:3.595.318.546.360.741.2]The levels of EN ISO 13849-1 are also defined from the average probability of a hazardous breakdown per hour as shown below:
Table 4. Performance Levels of ISO 13849-1
Performance level (PL)
Average probability of a hazardous breakdown per hour (1/h)
a > 10-5 to < 10-4 b > 3x10⁻⁶ to < 10-5
c > 10-6 to 3x10⁻⁶
d > 10-7 to 10-6
e > 10-8 to 10-7
2.3.4
IEC 62061 Safety Integrity Levels SIL 1- 3
[image:4.595.48.288.124.237.2]In this model, the severity of the potential damage is estimated at 1-4 levels, and then the probability of occurrence of the dangerous event is evaluated by looking at 3 additional parameters, where their summation gives us the class. The tables show us the levels and the parameters that define the Levels SIL 1-3. [6]
Table 5. Severity of injury
Severity of injury S
Non-reversible: Death, eye or arm loss 4 Non-reversible: Permanent limb loss 3 Reversible: Necessary medical treatment 2 Reversible: Necessary first Aid 1
Table 6. Frequency / Duration of exposure
Frequency / Duration of exposure F
≥ 1 per h 5
< 1 per h to ≥ per day 5 < 1 per day to ≥ per 14 days 4 < 1 per 14 days to ≥ per year 3
< 1 per year 2
Table 7. Probability of occurrence
Probability of occurrence W
Very High 5
Likely 4
Possible 3
Rarely 2
Negligible 1
Table 8. Possibility of prevention
Possibility of prevention P
Weak 4
Strong 3
Possible 2
Table 9. Classes of SIL
Severity of injury
Class = F + W + P
S 4 5-7 8-10
11-13
14-15
Not Reversible: Death, loss eyes
or arms
4 SIL 2
SIL 2
SIL 2
SIL 3
SIL 3 Not Reversible:
Broken limbs or cut fingers
3 SIL
1 SIL
2 SIL
3 Reversible:
Necessary Treatment by a
doctor
2 SIL
1 SIL
2
Reversible: Necessary First
Aid
1 SIL
1
2.4
Use of Standards
The confirmation of a SIL or a PL class depends on many factors that are the following: [3, 5]
Τ1 = interval test or life span (whichever is smaller) T2 = diagnostic test interval
MTTF = average time until the error
MTTFd = average time until the hazardous error DC = diagnostic coverage
β = sensitivity to common causes of failure
βD = calculating sensitivity to common causes of failure
λ = failure percentage (per hour) λD = dangerous failure rate
λDD = detectable rate of dangerous failure λDU = undetectable rate of dangerous failure λSD = detectable safe failure rate
λSU = undetectable safe failure rate
The control of the verification of standards depends on their subsystems and their architecture.
2.4.1
EN 62061 Standard
[image:4.595.48.287.343.726.2]Subsystem A (serial order)
The components of subsystem A are in serial order, in this arrangement the probabilities of dangerous data failures are added.
Subsystem B (parallel arrangement (redundant) without diagnostic function)
The components of the subsystem B are in a parallel configuration without diagnostic function and the possibility of a hazardous error is given by the following formulas. When the architecture includes a single error tolerance, there is a possibility of a common cause of failure and must be taken into account. Such an arrangement can be made on actuators.
Subsystem C (arrangement with diagnostic function)
The following diagram shows the functional representation of a zero fault tolerance system with diagnostic function. Diagnostic coverage is used to reduce the likelihood of material damage to the material. The definition of diagnostic coverage is the ratio of the rate of detected dangerous failures as compared to the percentage of all dangerous failures. Such a device can be found in sensors.
Subsystem D (arrangement with diagnostic function)
Subsystem D is unitary with fault tolerance to diagnostic functions, all system failures are affected by design of subsystem elements. We can find such an arrangement through the Controllers.
The probability of dangerous errors in systems with similar elements is calculated as following:
The probability of dangerous errors in systems with dissimilar is calculated as following:
Safe failure fraction
[image:5.595.56.283.538.665.2]The safe failure fraction is similar with the diagnostic coverage, but also takes into account any inherent tendency of failure to a safe situation. For example, when a fuse is burned, there is a failure, but it is very likely that the failure will be in an open circuit, which, in most cases, would be a "safe" failure. The SFF is (the sum of the "safe" damage rate plus the percentage of detected dangerous failures) divided by (the sum of the ''safe'' damage rate plus the percentage of detected and unidentified dangerous failures). It is important to realize that the only types of problems that need to be considered are those that could have an impact on a safe function.
Table 10. Hardware Fault Tolerance
Safe failure fraction
(SFF)
Hardware Fault Tolerance
0 1 2
<60% Not Allowed SIL 1 SIL 2
60%<90% SIL 1 SIL 2 SIL 3
90%<99% SIL 2 SIL 3 SIL 3
≥99% SIL 3 SIL 3 SIL 3
2.4.2
EN ISO 13849-1 Standard
At this point, we will analyze a simplified but practical guide on how to implement the control systems, by category, that is an integral part of ISO13849-1 as defined architectures. Category B
Category B should be considered as the basic foundation on which all other categories are built. It does not have any
Subsystem Component 1
λDe1
Common cause of failure
Subsystem Component 1
λDe1
Subsystem Component n
λDen
Subsystem Component 1
λDe1
Common cause of failure Subsystem
Component 1 λDe1
Subsystem Component n
λDen
Den De
D
1
h PFHDD1
2 / ) ( ) 1
( 1 2 1 1 2
2
De De De
De
D T
h PFHDD1
) 1 ( ... ) 1 ( 1
1 Den n
De
D DC DC
h
PFH
D
D
1
(1 ) ( 22
2 1 2 1 2 T DC DC De De
D
h
PFH
D
D
1
h
PFH
D
D
1
TOTAL DD SU SD SFF
( )/22 ) 2
( 1 2 1 1 2
2
1 De De De
De
T DC
DC
Subsystem Component 2
λDe2
Diagnostic functions
Subsystem Component 2
λDe2
Diagnostic functions
De
De
DeD DC T
T
DC
further special arrangements or safety structures to the Basic Safety Principles as referenced in ISO 13849-2. These represent, generally, good tactics in designing and selecting materials.
Category 1
Category 1 requires the use of properly tested components and good safety principles. The use of properly tested components is designed to minimize the possibility of loss of a safe operation, but note that a single error can still lead to the loss of a safe operation.
Category 2
In addition to complying with Category B requirements and using properly tested safety principles, the safety system shall be tested to meet Category 2. The tests shall be designed to detect errors in the safety related parts of the control system. If there are no errors detected, the machine is allowed to operate. If errors are detected, the error response function must ensure that the machine remains in a safe state.
Category 3
In addition to complying with Category B requirements and properly tested safety principles, Category 3 requires the safe operation to be performed successfully in the presence of only one error. Some defects, such as cross-errors, which do not cause an immediate loss of safe security, may not be detected. This means that an accumulation of undetected damage can lead to loss of safe operation, for Category 3.
Category 4
In addition to complying with Category B requirements and properly tested safety principles, unlike Category 3, where the accumulation of errors can lead to a loss of safe operation, Category 4 requires safe operation to be performed in the event of accumulating faults. In practice, this is usually achieved by having a high-level diagnosis to ensure that all relevant errors are detected prior to any accumulation.
2.4.3
EN ISO 13849-1 Standard
The EN ISO 13849-1 describes a method determining PL, which is achieved by combining the following: [3], [5]
Mean Time To dangerous (MTTFd) Diagnostic Coverage
Common Cause Factors (CCF) Category
MTTFd
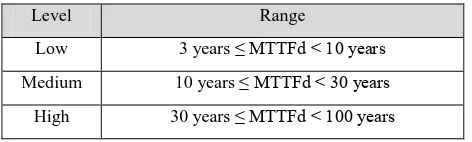
[image:6.595.53.289.629.700.2]The MTTFd as shown in the table below, is divided into 3 levels:
Table 11. MTTFd Range
Level Range
Low 3 years ≤ MTTFd < 10 years Medium 10 years ≤ MTTFd < 30 years
High 30 years ≤ MTTFd < 100 years
For pneumatic, mechanical and electromechanical components (pneumatic valves, relays, switches, position switches, etc.). It may be difficult to calculate the average time for dangerous damage (MTTFd). Most manufacturers of these components give only the average number of cycles
until 10% of these components fails dangerously (B10d). The average number of cycles until 10% of these components fail dangerously (B10d) must be determined by the component manufacturer in accordance with the relevant product standards for the test methods (e.g. IEC 60957-5-1, ISO 19973, IEC 61810). Defective component failure functions must be defined, e.g. stick to the final position or change switching times. The operating time of the component (T10d) is the average time until 10% of the components fail. The MTTFd calculation is done as following:
Where
dop= average function in days per year
hop= average function in hours per day
tcycle= average time between the beginning of two successive
cycles of the element. (e.g. Switching a valve) in seconds per cycle.
Example
If we have a transistor with the following principles: dop = 180 days per year.
hop = 12 hours per day.
tcycle =8 seconds per cycle.
B10d = 50 million cycles.
Diagnostic Coverage
Both standards require the user to quantify the amount of diagnostic coverage of the associated security control functions. This is defined as the reduction in the probability of dangerous material damage, resulting from the operation of the automatic diagnostic tests
When a fault is detected, the monitoring mechanisms shall handle the fault by initiating an appropriate action which is application dependent. For many applications within the machinery sector such an appropriate action is to initiate a so called safe-state (i.e. the safety-function is performed). The term safe-state implies that the control system removes the hazard instantly (e.g. by immediately stopping/preventing hazardous movement of a part of a machine by remove the power to a motor). For other machines or applications other actions may be more appropriate, such as issuing an alarm. In order to confirm that a required level of performance has been achieved, it is necessary to compare the architectural and diagnostic coverage with the MTTFd.
cycle op op op
t
h
s
h
d
n
3600
/
op d d
n
B
T
1010
year
cycle
n
op9
,
72
10
/
8
3600
12
180
5
year
T d 51,4
10 72 , 9
10 50
5 6
10
year
MTTF
d514
1
,
0
7
,
115
DTOTAL DD
DC
h
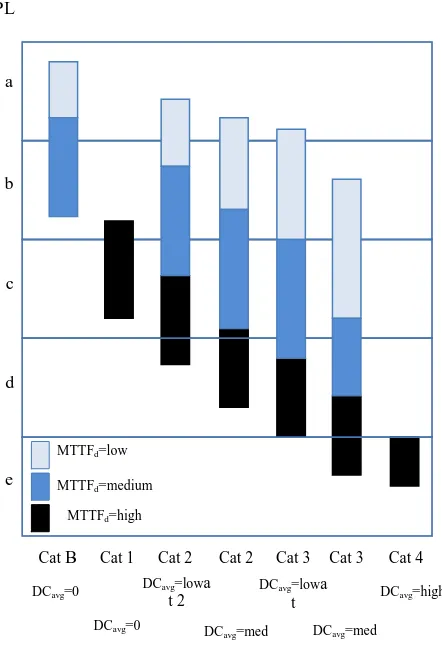
Fig 7: MTTFd - Diagnostic coverage
Common cause failures (CCF)
We call CCF the damage that is the result of one or more events and causes simultaneous failures of two or more separate components in a multi-component system and results in the failure of a safety-related control function.
The standard EN ISO 13849-1 requires the performance level of the control system to be determined with estimation of CCF as one important aspect. An assessment of CCF is necessary for every safety validation, but can be performed in different ways.
The standard provides a (qualitative) procedure for estimating the CCF measures implemented a category 2, 3 or 4 structures. The procedure is presented by following scoring table.
In order to fulfill the requirements a score of minimum 65 points or better is needed. For each listed measure, only the full score or nothing can be claimed. If a measure is only partly fulfilled, the score according to this measure is zero. The maximum score is 100 points.
Table 12. CCF Measures
No Measure against CCF Max
Score
Achieved Score
1 Separation/segregation 15 15
2 Diversity 20 15
3.1 Design: Protection against overvoltage, current, etc
15 15
3.2 Design: Components are well tried
5 5
4 Assessment/analysis 5 0
5 Competence/training 5 0
6.1 Environmental: EMC 25 25
6.2 Environmental: Other influencers
10 0
Total 100 75
3.
CONCLUSION
Based on the above analysis, we realize that we have all the necessary instructions and regulations so that the automation systems (simple or complex) can safely operate, even in cases of failure of their data. Every manufacturer of industrial automation can (with the existing technology) and must adhere to the safe operating regulations.
4.
ACKNOWLEDGMENTS
All authors would like to thank the University of West Attica and specifically the Post Graduate Program of Studies (MSc) "New Technologies in Shipping and Transport", for the financial support provided to them to undertake this research project.
5.
REFERENCES
[1] EN ISO 12100 (Safety of machinery - General principles for design - Risk assessment and Risk reduction). [2] IEC 61508-3 (Functional Safety of Electrical/
Electronic/Programmable Electronic Safety – Related Systems).
[3] https://www.tuv-sud.co.uk/uploads/images/ 1397220180236544250395/sil-or-pl.pdf.
[4] IEC 61511 (Safety instrumented systems for the process industry sector).
[5] EN ISO 13849-1(Safety of machinery - Safety-related parts of control systems).
[6] IEC 62061 (Safety of machinery).
[7] https://www.itk.ntnu.no/sil/OLF-070-Rev2.pdf. [8] https://www.festo.com/rep/en-us_us/assets/pdf/
FESTO_eGuide_final2.pdf.
[9] https://www.mts.com/cs/groups/public/documents/library /mts_4036317.pdf.
[10] https://www.industry.siemens.com/topics/global/en/safet
y-integrated/machine-safety/safety-evaluation-tool/Pages/Default.aspx.
[11] https://www.dguv.de/ifa/praxishilfen/practical-solutions-machine-safety/software-sistema/index.jsp
PL
a
b
c
d
e
Cat B Cat 1 Cat 2 Cat 2 Cat 3 Cat 3 Cat 4 DCavg=0
DCavg=0
DCavg=lowa
t 2
DCavg=med
DCavg=lowa
t
DCavg=med
DCavg=high
MTTFd=low
MTTFd=medium
[image:7.595.314.543.82.320.2][12]Tham M.T., Warwick K. “Fail-Safe Control Systems” ISBN 9789401066778.
[13]D. Smith, K. Simpson, "Safety Critical Systems Handbook – A Straightforward Guide to Functional Safety, IEC 61508 (2010 Edition) and Related Standards", 3rd Edition, ISBN 9780080967813.
[14]M. Punch, "Functional Safety for the Mining Industry – An Integrated Approach Using AS(IEC)61508, AS(IEC)62061 and AS4024.1." (1st Edition, ISBN 9780980766004.
[15]H. Hartmann, H. Thomas, E. Scharpf, "Practical SIL Target Selection - Risk Analysis per the IEC 61511 Safety Lifecycle", ISBN 9781934977033.
[16]M. Medoff, R. Faller, "Functional Safety - An IEC 61508 SIL 3 Compliant Development Process, (Third Edition)" ISBN 9781934977088.
[17]Dave Macdonald “Practical Industrial Safety, Risk
Assessment and Shutdown Systems”, ISBN 99780750658041.
[18] ALLEN-BRADLEY, SAFEBK-RM002C-EN-P, Safety related control systems for machinery.
[19] 2006/42/EC (Machinery Directive).
[20] IEC 61508 (Functional safety of electrical/electronic/programmable electronic safety related systems).
[21] https://search-ext.abb.com/library/Download.aspx? DocumentID=2TLC172003M0204&LanguageCode=en &DocumentPartId=&Action=Launch.
[22] https://www.industry.siemens.com/topics/global/en/safet
y-integrated/machine-safety/why-safety/Pages/default.aspx.