Development of an Electronic Examination System using
a Client Server Model
O. E. Oduntan
, PhD Dept. of Computer ScienceThe Federal Polytechnic, Ilaro, Ogun State
O. O. Ojuawo
Dept. of Computer Science
The Federal Polytechnic, Ilaro, Ogun State
ABSTRACT
Examination is a process which is mandatory for assessment and evaluation of performances in any educational setting, ranging from primary to tertiary institution. Infrastructures such as examination halls, exam documents, verification methods and effective grading systems are required to effectively conduct a good exam. This study focuses on the conduct of examination using an electronic approach. This involves the development of an electronic examination system using the Client –Server approach on an intranet environment to cater for questions presented in multiple choice multiple answers and multiple choice single answer. The performance of this approach was performed by implementing the developed application on different localhost operating system such as Linux and Windows using Xampp, Wamp and Lamp. A comparative analysis of data on students score from the paper pencil test(PPT) and the electronic examination system(EES) exam was be performed using the Pearson Coefficient Correlation. Results showed that students’ performance in the computer based test is better than the performances in the paper pencil test.
Keywords
Examination, Electronic Examination, Paper Pencil Test, Client-Server Approach, Intranet and Students’ performance
1.
INTRODUCTION
Evaluation of student’s performance which is carried out by periodically testing students is a key issue in the educational sector. When students are evaluated either through continuous assessment or examinations, they need to be graded to rate their performances (Allen, 2004).An examination is a test to show the knowledge and ability of a student. A student who takes an examination is a candidate. The person who decides how well the student has performed is the examiner. It is commonly known as exam, is a test to see how good somebody is at something.
It is widely acknowledged that assessment through examination, drives student learning and directs student’s effort, therefore, it must be planned accordingly and must be an integral part of course design. Assessment tasks influence the direction and quality of student learning hence it’s a crucial part of the learning process, which help examiners to judge the effectiveness of teaching and as a tool to help individuals improve on their performances in the future (Burstein et al. 2001).
There are different approaches to assessing or examining students; there are the Paper-Pencil test approach, the online computer based test, use of electronic examination system. For instance, an examination may be a written test, an
on-screen test or a practical test. An electronic exam (also called a Computer Based Assessment – CBA, Computer Based Testing – CBT or e-exam for short) is a test conducted using a personal computer (PC) or an equivalent electronics device, in which the delivery, responses and Assessment is effected
electronically.
This study delves into the design and implementation of an electronic examination system using the Client –Server Approach on an intranet environment for cater for questions presented in multiple choice multiple answers and multiple choice single answer. The performance of this approach was performed by implementing the developed application on different localhost operating system such as linux, windows etc, using Xampp, Wamp and Lamp.
Available, try the font named Computer Modern Roman. On a Macintosh, use the font named Times. Right margins should be justified, not ragged.
2.
LITERATURE REVIEW
According to Burstein, Leacock and Swartz, (2001), assessment is a crucial part of the learning process. It enables students to gauge their progress, tutors to judge the effectiveness of teaching, and can also be used as a teaching tool, to give individuals or groups feedback designed to enable them to improve their performance in the future.
In Nigeria, students spend six years in Secondary School that is 3 years of JSS (Junior Secondary School), and 3 years of SSS (Senior Secondary School). By Senior Secondary School Class 2 (SS2), students are taking the GCE O’Levels exam, which is not mandatory, but most students take it to prepare for the Senior Secondary Certificate Examination. The Senior Secondary School ends on the WASSCE. Junior Secondary School is free and compulsory. It leads to the Basic Education Certificate Examination. (BECE), which opens the gate to
Senior Secondary School
(https://en.wikipedia.org/wiki/education). SSS curriculum is based on 6 core subjects completed by 2 or 3 elective subjects.
The General Certificate of Education Examination (GCE) was replaced by the Senior Secondary Certificate Examination (SSCE). The SSCE is conducted at the end of the Secondary School studies in May/June. The GCE is conducted in October/November as a supplement for those students who did not get the required credits from their SSCE results. The standards of the two examinations are basically the same.
Meanwhile, more educators and researchers have shown interest in investigating the factors that influence students’ CBT performance. There are many factors related to student characteristics, which includes student demographic attributes, learning style, computer familiarity and test anxiety (Hanna and Dettmer, 2004).
Previous research showed that more people anticipated problems with the computer assisted assessment than actually had them (Erle,et. al., 2006). Their research also showed that despite fewer students being confident about CBT before completing the assessment more students stated a preference for CBT afterwards. Previous study conducted indicated a preference for CBT over PPT (Fyfeet, al., 2005). Some studies reported the main disadvantage as being increased anxiety amongst those unfamiliar with use of computer (Erle, et, al.,2006) and as such students agreed that they are “technophobic”. The challenge to test examinees by means of microcomputers demands appropriate software design.
Researchers also examined the relationship between student learning styles, online learningand testing. It should be mentioned that scholars define learning styles differently, and there is currently no widely accepted definition of what a learning style is. In a study by Johnson (2007) about learning style under two web-based study conditions, four learning styles (active-reflective, visual-verbal, sequential-global, and sensing-intuitive) were considered and it was found that students who were more active than reflective expressed a preference for face-to-face study groups rather than online study groups and for online quizzes. Ames’s study (2003) used Gregorc’s definition of four distinct learning styles (Abstract Sequential (AS), Abstract Random (AR), Concrete Sequential (CS), and Concrete Random (CR)). The findings indicate that computer-based or computer-assisted instruction may not be optimal for all students. In their study to investigate the effects of formative assessment and learning style on student achievement in a Web-based learning environment. Wang and Huang (2006) used another four learning modes (concrete experience (CE), reflective observation (RO), abstract conceptualization (AC), and active experimentation (AE)). Results showed that both learning style andformative assessment strategy are significant factors affecting student achievement in a Web-based learning environment.
A few studies have examined the relationship between CBTs and student test anxiety. Results from these studies seem consistent, providing no support that CBTs will induce additional anxiety or impact performance levels (Cassady and Cridley, 2005; Stowell and Bennett, 2010). Shermis and Lombard (1998) also found for a written English exam, computer anxiety was not statistically significant for performance on the written English essay.
3.
MATERIALS AND METHOD
In software architecture, there may be many layers between the hardware and end user. Each can be spoken of as having a front end and a back end. The front is an abstraction, simplifying the underlying component by providing a user-friendly interface, while the back usually handles business logic and data storage. The front end (or "client") side is any component manipulated by the user. The server-side (or "back end") code usually resides on the server.
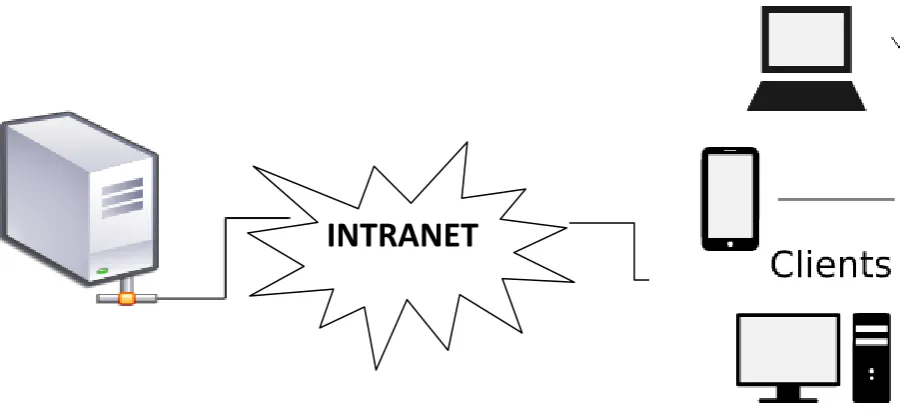
In this study, a Client-Server Model was implemented. In figure 1: The Server indicates the back end which involves the
use of Scripting, languages like Java scripts, PHP, Automated testing frameworks for the language being used, Database administration, Scalability, Security concerns such as authentication and authorization, Data transformation and Backup methods and software was performed. The Client signifies the front end, which involved the use of Markup and web languages such as HTML, CSS, JavaScript, and ancillary libraries commonly used in those languages such as Sass or JQuery, Asynchronous request handling and AJAX, Cross-browser compatibility issues and workarounds, Search engine optimization, Basic usage of image editing tools such as GIMP, Specialized web editing software like Dreamweaver was used.
In the design of the electronic examination system, procedures such as: Collecting of softcopy examination questions from examiners, Authoring of the collected questions to computer based examination format. Creating a database of student’s records and examination questions, Uploading of Questions and setting up an examination, Students’ login for examination and Downloading of examination scores were taken.
3.1
Performance Evaluation
In this study, a comparative analysis of data on students score from the PPT and the CBT exam will be performed using the Pearson Coefficient Correlation.
Pearson moment correlation(r) signifies the degree of relationship that exists between dependent variable and independent variable. In this study, the dependent variable is the Pencil-Paper test (PPT) denoted as X, while the independent variable is the Computer Based Test (CBT) denoted as Y.
Equation 1 represents the Pearson correlation coefficient formula, the valid result for r lies between -1 and +1. If the result lies between 0 and 1, it shows that there is a positive correlation that is X increases as Y increases. If r=1, it shows that the result is perfect positive. If r is between 0.5 and 1, it shows a high positive correlation, when r is between 0 and 0.49, it exhibit a low positive correlation. When r = -1, it shows a perfect negative correlation that is the rate at which the dependent variable increases is exactly equal to the rate at which the independent variable decreases. When r is between -0.49 and -1, is exhibit a strong negative correlation. Below is the Pearson coefficient correlation formular
(1)
Figure 1: The Client –Server Model of Electronic Examination System
4.
4. RESULTS AND DISCUSSION
The Developed Electronic Examination system was implemented on a localhost such as Xampp Server and Lampp Server. An intranet WIFI was designed for the testing and
implementation of the system. A Graphics User Interface (GUI) was designed and implemented for the client to enable and enhance user friendliness. Figure 2, is a GUI screen shot of the start up page, when clicked by the client-student, it launches into the Login page shown in Figure 3.
Figure 2: A snapshot of the Start-up Page
The developed Electronic Examination System entails an instruction page as shown in Figure 4, which comprises the student identity, the colour hints, the blue colour indicates question that have not visited. The red colour button represents questions that have been visited and not answered. The green coloured button indicates questions visited and answered. Other buttons are the previous, next and submit button. A timer is also incorporated into the application. Figure 5, is a screen shot of the questions page, it entails the question, the timer
4.1
Performance Analysis
In this study, data were collected from students who wrote the PPT and CBT exams of UTME in the year 2013 and 2014. Table 1 is a comprehensive table showing the student’s performance in CBT and PPT exams conducted by Joint Admission Matriculation Board. A sample of fifty students scores were randomly collected from the Yewa South Local Government Area of Ogun State. These sets of students wrote
UTME exam using the PPT mode of testing in either of the year 2013 or 2014. Therefore, a particular student represented below has a UTME score for both PPT and EES exam.
Figure 3: Screenshot of User Login Page
[image:4.595.80.515.333.543.2]Table 1: Students Scores in PPT and EES
Students EES(X) PPT(Y)
1 170 200
2 200 156
3 125 156
4 167 180
5 179 170
6 200 201
7 210 150
8 178 183
9 164 148
10 144 195
11 177 182
12 160 133
13 165 195
14 142 169
15 169 132
16 149 136
17 174 174
18 189 178
19 174 183
20 210 207
21 183 140
22 164 179
23 160 170
24 144 189
25 176 142
26 179 114
27 177 189
28 179 175
29 184 120
30 191 157
31 182 144
32 168 155
33 148 167
34 174 137
35 178 220
36 175 198
37 165 183
38 182 169
39 192 174
40 139 132
41 155 144
42 175 170
43 125 160
44 137 149
45 176 174
46 220 145
47 179 175
48 220 164
49 179 154
50 199 168
The correlation co-efficient r of 0.087993 which is approximately 0.1 was derived, this exhibited a low positive correlation between the students’ performances in EES and PPT exams conducted by the Joint Admission Matriculation board for the year 2013 and 2014. This means that electronic examination should be encouraged among students to attain better performance in their academic carrier.
5.
CONCLUSION
In this study, it could be deduced that examining students using the electronic method is an effective approach to enhance students’ performance, it helps to reduce drastically examination misconducts such as: personification, leakages of examination questions, harassment of female students by male lecturers, cheating and lots more. In addition, it reduces cost of conducting examination in our institutions and it is time saving.
6.
REFERENCES
[1] Allen M.J. (2004) Assessing Academic Programs in Higher Education. Bolton M.A, Anker Publishing, Alexandria: Association for Supervision and Curriculum Development, pp.70-75
Assisted Assessment Conference, Loughborough University, Loughborough, UK, pp. 55
[3] Erle, L., Benjamin, O., Einar, W.S., and Raymond, S. (2006). Computer-based versus Penand-paper Testing: Students’ Perception. Ann Acad Med Singapore 35, 599-603.
[4] Fyfe, G., Meyer, J., Fyfe, S., Ziman, M.,Sanders, K., and Hill, J. (n.d). Self-evaluation of assessment performance can enhance student’s perception of feedback on computer-generated tests.
[5] Hanna, G. S., Dettmer, P. A. (2004). Assessment for Effective Teaching Using Context-Adaptive Planning. New York: Pearson
[6] http://en-wikipedia.org/wiki/education_in_nigeria; retrieved on the 23rd MAY, 2017.
[7] Johnson, M. and Green, S. (2004). On-line assessment: the impact of mode on students’ strategies, perceptions and behaviours. University of Cambridge.