© 2019, IRJET | Impact Factor value: 7.211 | ISO 9001:2008 Certified Journal
| Page 959
IMAGE SEGMENTATION USING CLASSIFICATION OF RADIAL BASIS
FUNCTION OF NEURAL NETWORK IN BRAIN TUMOR DETECTION
P. PRIYADHARSHINI
1, R. THILLAIKKARASI
2, S. SARAVANAN
31
PG scolar, ME., (Applied Electronics) Department of ECE, Salem College of Engineering And Technology, Salem.
2
Assistant Professor, Department of ECE, Salem College of Engineering and Technology, Salem.
3
Professor /Head, Department Of EEE, Muthayammal Engineering College, Namakkal, Tamilnadu, India
---***---ABSTRACT -
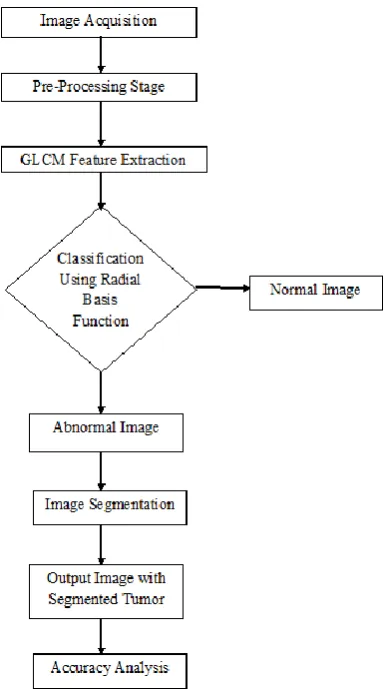
The location of with tumors in the brain is oneof the factors that determine how a brain tumor affects an individual's functioning and what symptoms the tumor causes. Along with the Spinal cord, the tumor forms the Central Nervous System (CNS). The brain tumor can occur at any stage. Image pre-processing techniques are used to improve the quality to an image before processing and sending into an application. The image processing techniques use a small neighborhood of a pixel in an input image to get a new brightness value in the output image. These pre-processing techniques are also called as separation and discerning enhancement. The algorithm incorporates steps for pre‐processing, image segmentation, and feature extraction of the GLCM. The RBFN is a 3-layer network where the input vector is the first layer, the second "hidden" layer is the RBF neurons, and the third layer is the output layer containing linear combination neurons. Finally, using the segmentation technique and morphological operations tumorous region is isolated from an abnormal input image.
INTRODUCTION
The size can vary extensively. Real-time diagnosis of tumors by using more reliable algorithms has been the main focus of the latest developments in medical imaging and identification taking part in brain tumor using MRI images. The segmentation of the cells and their nuclei from the rest of the image content is one of the main problems faced by most of the medical imagery diagnosis systems. The process of determining in most powerful and diagnosis segmentation. Image Segmentation is performed on the input images.
A. Operations and Types of Tumor:
3D appearance segmentation aids in the automated diagnosis of brain diseases and helps in qualitative and quantitative analysis of images such as measuring accurate size and volume of the detected portion.
B. Tumor:
An enlargement part of the body, generally without inflammation, caused by an unusual development of fleshy tissue, whether nonthreatening or malignant.
C. Types of Tumor:
There are three types of tumor:
1) Benign; 2) Pre- Malignant; 3) Malignant.
1) Benign Tumor:
A benign tumor is a tumor is the one that does not develop in an unexpected way; it doesn't affect its neighboring healthy tissues and also does not enlarge to non-neighboring tissues. The secret agent is the common example of benign tumors.
2) Pre-Malignant Tumor:
It is also a precancerous stage, imitated as a disease, if not precisely treated it may lead to the tumor.
3) Malignant Tumor:
Malignant is fundamentally a medical word that defines a severe progressing disease. The malignant tumor is a term which is normally used for the description of cancer. The Magnetic Resonance Imaging (MRI) is to view the internal structures of the body in element particularly for imaging soft tissues and it does not use any particle emission. The major problem in image segmentation is the inaccurate diagnosis of the tumor region which gets reduced mainly due to the contrast, blur, noise, artifacts, and distortion. Even a small amount of noise can change the classification. (1)
© 2019, IRJET | Impact Factor value: 7.211 | ISO 9001:2008 Certified Journal
| Page 960
MATERIALS AND METHODS
In this phase, an image is improved in the way that finer details are enhanced and noise is uninvolved from the image. Most commonly used enhancement and noise reduction techniques are applied that can give the best possible results. Development of result in more prominent edges and a perfected image is developed, a noise will be concentrated on the distorting effect of the image.
The Magnetic Resonance Imaging (MRI) is to view the internal structures of the body in detail exclusively for imaging soft tissue and it does not use any radioactivity. The brain tumor is an abnormal growth of tissues in the brain and is mainly caused by radiation to the head, genetic risk, HIV infection, cigarette smoking and also due to environmental toxins. The major problem in image segmentation is the inaccurate diagnosis of the tumor region which gets reduced mainly due to the contrast. (6)
Fig 2 Flow chart of Proposed Methodology
A. Image Acquisition
Images are obtained using MRI scan & displayed in 2D having pixels as its elements. MRI scan was stored in a database of images in JPEG image formats. These images are displayed as grayscale images. The entries of grayscale images are ranging from 0 to 255, where o point to total black color and 255 signifies the whole white color.
B. Pre-Processing Stage
[image:2.595.345.512.264.564.2]The sum of contrast augmentation for some greatness is directly proportional to the slope of the Cumulative Distribution Function (CDF).
Fig 3 Filtered Images
Fig 4 Adaptive Histogram Equalization
C. Extraction of Texture Feature
[image:2.595.96.289.334.679.2]© 2019, IRJET | Impact Factor value: 7.211 | ISO 9001:2008 Certified Journal
| Page 961
Texture feature extraction by using GLCMIt even provides a contrast between malignant and normal tissue, which may be below the threshold of human perception. The statistical features of MR images are obtained using Gray Level Co-occurrence Matrix (GLCM), which is also known as Gray Level Spatial Dependence Matrix (GLSDM)? GLCM, introduced by Heraldic is a statistical approach that can well describe the longitudinal connection between pixels of dissimilar gray intensities. GLCM is a two-dimensional histogram in which (i, j)the element is the frequency of event I that occurs with j.
D) Classification using RBF
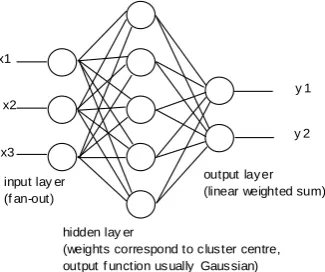
The next step in the proposed system is to classify and train the extracted signal. We use the RBF network as described in the below Figure 3 to train and test the signals of MRI. Learning is of 2 stages: using two methods such as unsupervised methods, supervised methods14. The basic RBF is of the three-layer network, as shown in Figure 3.
The main features of RBF are as follows and shown in the above Figure 3. They are 2 layer feed forward net-work. RBF consists of a set of the hidden layer. MLP is used to implement the output nodes. It covers even smaller regions also. It is much faster than BPN since it has 2 stages of learning. The different learning algorithms are:
The architecture of the Radial Basis Function
Network
RBF has wide-ranging research importance because they are world-wide approaches, fast learning speed due to locally tuned neurons and they have compressed topology than other neural networks. Radial basis function network is used for a wide range of applications primarily because it can approximate any regular function and its training speed is faster than multi-layer perceptron (MLP). The architecture of the RBF network is given below.
x1
x2
x3 input lay er (f an-out)
hidden lay er
(weights correspond to cluster centre, output f unction usually Gaussian)
output layer (linear weighted sum)
y 1
[image:3.595.325.519.345.484.2]y 2
Fig 4 Architecture of RBF
However, if pattern classification is required, then a hard-limiter or sigmoid perform can be placed on
the output neurons to convey0/1 output values and also the cluster. The single feature of the RBF network is the process performed in the out of sight layer. Furthermore, this distance measure is made non-linear, so that if a design an area that is close by to a cluster interior it gives a value close to 1.Then the Gaussian operate most typically used radial-basis operate may be a Gaussian operate. In associate degree RBF network, r is the distance from the cluster center. The equation represents a Gaussian bell-shaped curve.
The distance measured from the cluster center is usually the Euclidean distance. For each neuron in the hidden layer, the weights represent the coordinates of the center of the cluster. The root-mean-square distance between the current cluster center and its P nearest neighbors is calculated, and this is the value chosen for. So, if the current cluster center is cj, the value consider.
Advantages/Disadvantages
RBF trains faster than an MLP .
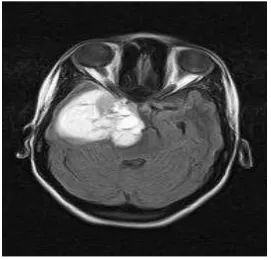
[image:3.595.74.237.572.708.2] It is slower than an MLP, so wherever speediness is a factor an MLP may be more applicable.
Fig 5 The Given Image is Abnormal
E) Image Segmentation
Image segmentation can partition the brain imaging scan image into multiple segments (sets of pixels, conjointly called super pixels). One of the simplest methods is that of histogramming and Thresholding. If we plot the Number of pixels which have a specific grey value versus that value, we create the histogram of the image. Properly normalized, the histogram is essentially the probability density function of the grey values of the image Assume that we have an image consisting of a bright object on a dark background and Assume that we want to extract the object. For such an image, the histogram will have two Peaks and a valley between them. We can choose as the threshold then the grey value which corresponds to the valley of the histogram, indicated by t in figure 6.2a, and label all pixels with grey values greater than as object pixels and all pixels with grey values smaller than as background pixels.
© 2019, IRJET | Impact Factor value: 7.211 | ISO 9001:2008 Certified Journal
| Page 962
the method of allocating a label to each element in apicture such pixels with the similar label share assured
visual physical characteristics. The result of image splitting up is a set of segments that mutually cover the entire image or a set of contours extracted from the image. The main difficulties in the edge recognition process are that the malignant cells near the spacious of the MRI are very fat, thus look like very dark on the MRI, which is very mystifying in the edge recognition process. To overcome the difficult, two steps were completed.
a. Histogram Equalization
Histogram equalization is used to enhance contrast. In some case were histogram equalization can very poor and then decreasing the contrast.
Fig 6: a) The original MRI b) Histogram Equalized MRI
b. Thresholding
[image:4.595.365.501.97.225.2]Thresholding is the simplest method of image segmentation. From a grayscale image, Thresholding can be used to create binary images in many vision presentations, it is convenient to be ably isolated out the constituencies of the image.
[image:4.595.53.272.294.401.2]Fig 7: Original MRI Image
Fig 8: Threshold Segmented Image (White portion indicates tumor)
CONCLUSION
Finally, for the recommended system, the essential effect Image has to be chosen for determining better segmentation techniques. An effective database with high recognition has to be implemented. Early detection of the tumor will be useful to the patients for who are smaller tumors that are class 1 and class 2 tumors which can be cured easily.
REFERENCE
[1] Roopali R.Laddha, S.A. Ladhake ―A Review on Brain Tumor Detection Using Segmentation And Threshold Operations‖, International Journal of Computer Science & Information Technologies‖, Vol.5, 2014.
[2] Ahmed Kharrat, Mohamed Ben Messaoud, Nacéra Benamrane, Mohamed Abid (2009) ―Detection Of Brain Tumor In Medical Images‖, IEEE International Conference On Signals, Circuits And Systems
[3] S. Rajeshwari, T. Sree Sharmila ―Efficient Quality Analysis Of MRI Image Using Preprocessing Techniques‖, IEEE 2013
[4] N. Kwak, and C.H. Choi, "Input Feature Selection for
classification problem", IEEE Transactions on Neural
Networks, 13(1), 143- 159, 2002
[5] Prinyanka, Balwinder Singh ―A Review On Brain Tumor Detection Using Segmentation‖, International Journal of Computer Science & Mobile Computibg , Vol 2,Issue.7, 2013.
[image:4.595.94.230.534.664.2]© 2019, IRJET | Impact Factor value: 7.211 | ISO 9001:2008 Certified Journal
| Page 963
[7] P. Padmapriya*, K. Manikandan, K. Jeyanthi, V. Renugaand J. Sivaraman ‘Detection and Classification of Brain Tumor using Radial Basis Function’ Indian Journal of Science and Technology, Vol 9(1, January 2016
[8] Wen-Bo Zhao1,2, De-Shuang Huang2, and Lin Guo2!”Comparative Study between Radial Basis ProbabilisticNeural Networks andRadial Basis Function Neural Networks1”Department of Automation, University of Science and Technology of China Springer-Verlag Berlin Heidelberg 2003